Review
. 2023 May 12:14:1167937.
doi: 10.3389/fpsyg.2023.1167937. eCollection 2023.

Scientific collaborations and research trends in Parent-Child Interaction Therapy: a bibliometric analysis

Affiliations
Review

Scientific collaborations and research trends in Parent-Child Interaction Therapy: a bibliometric analysis

Sümeyye Ulaş et al. Front Psychol. .

Abstract

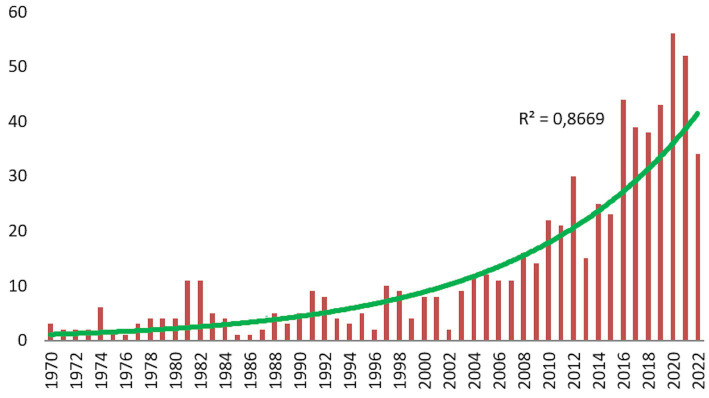
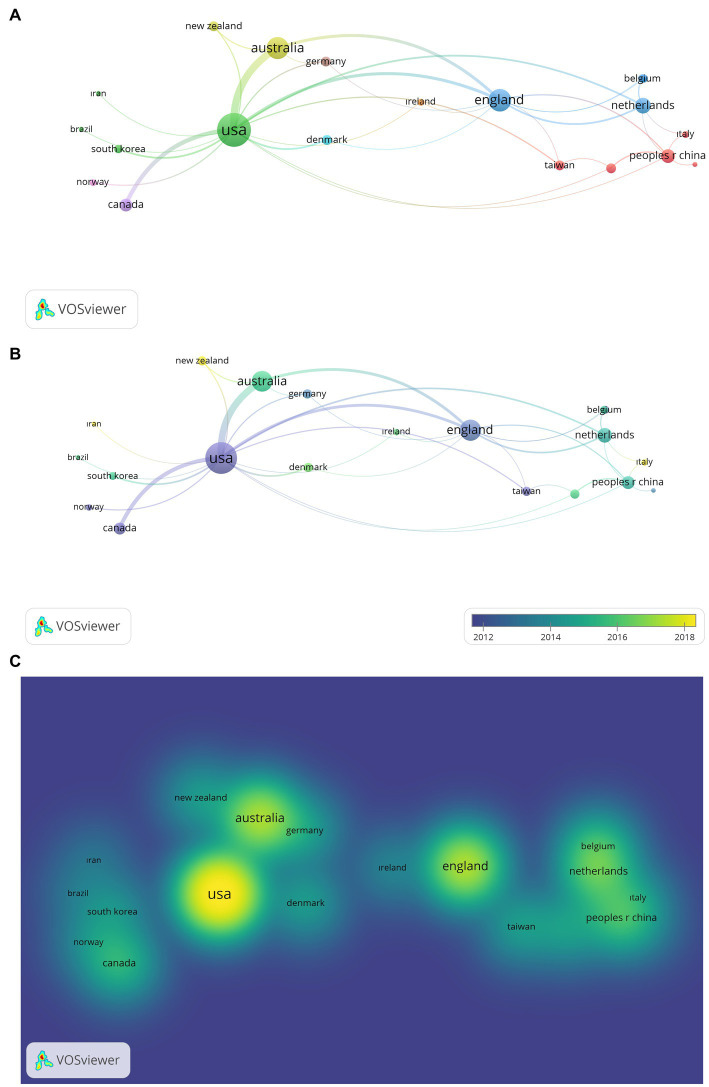
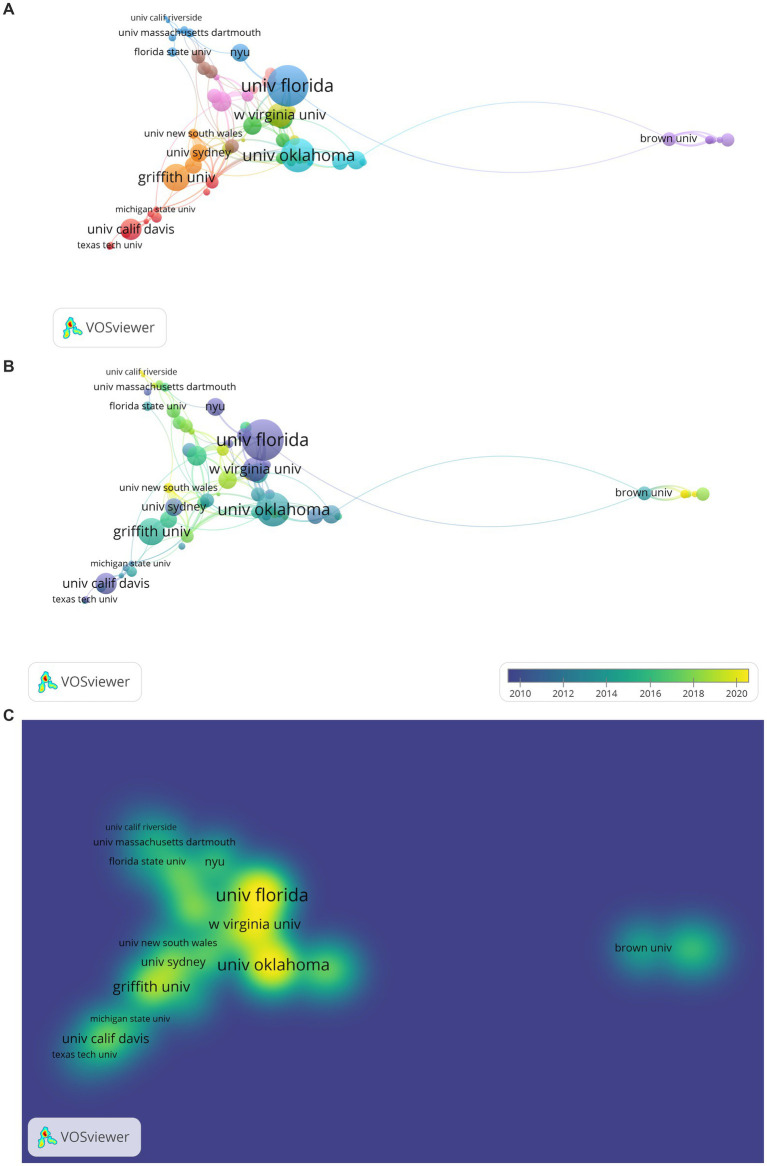
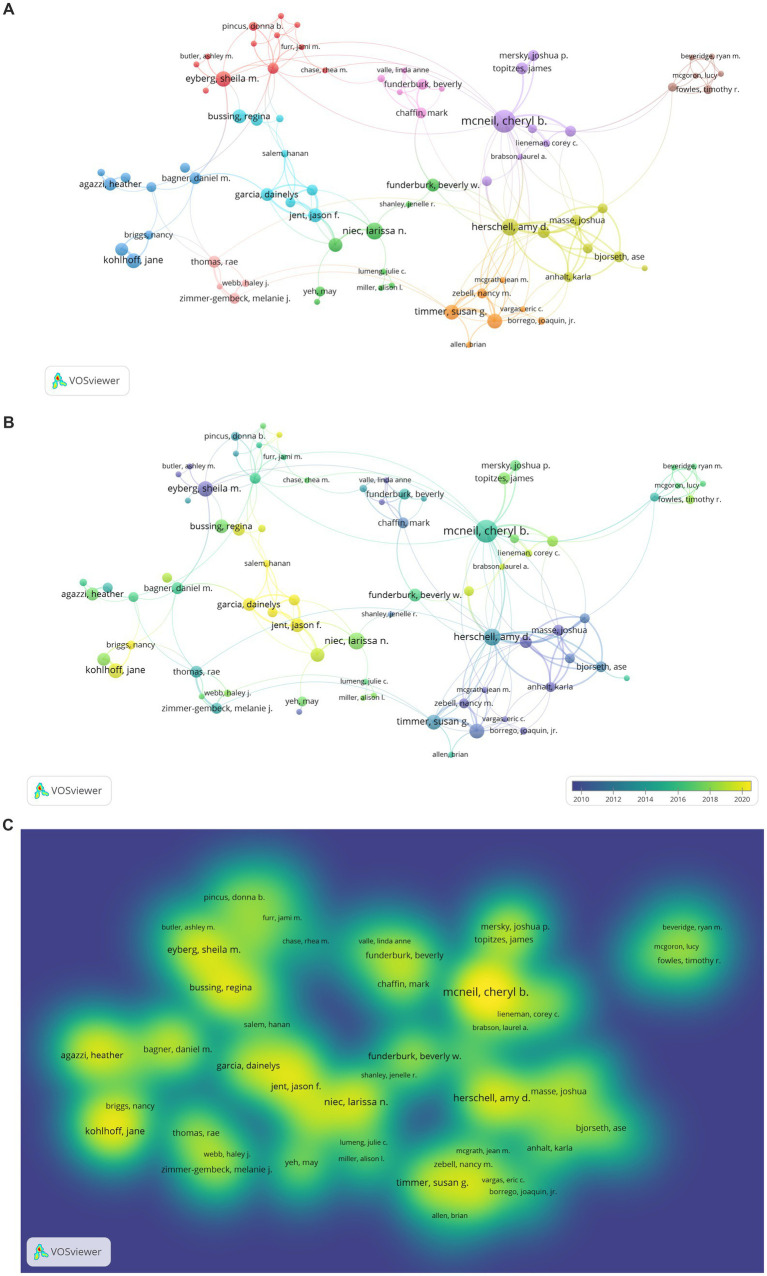
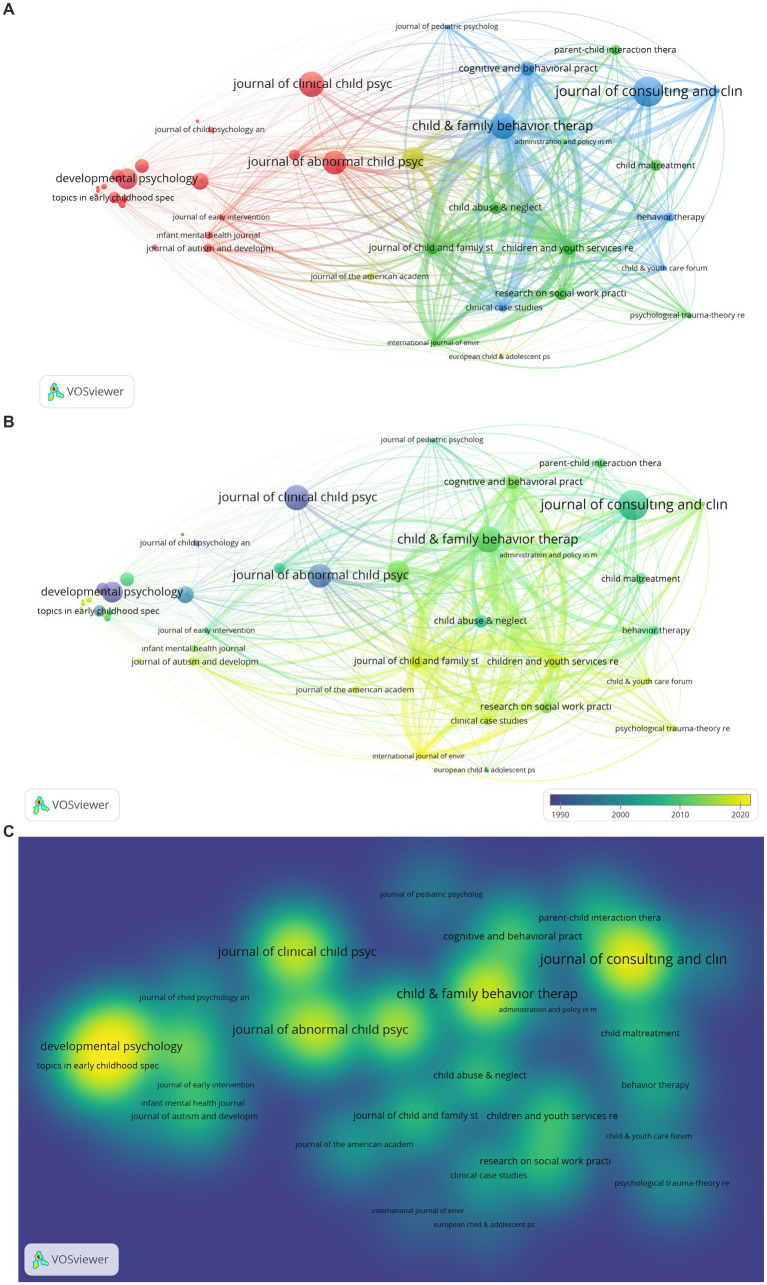
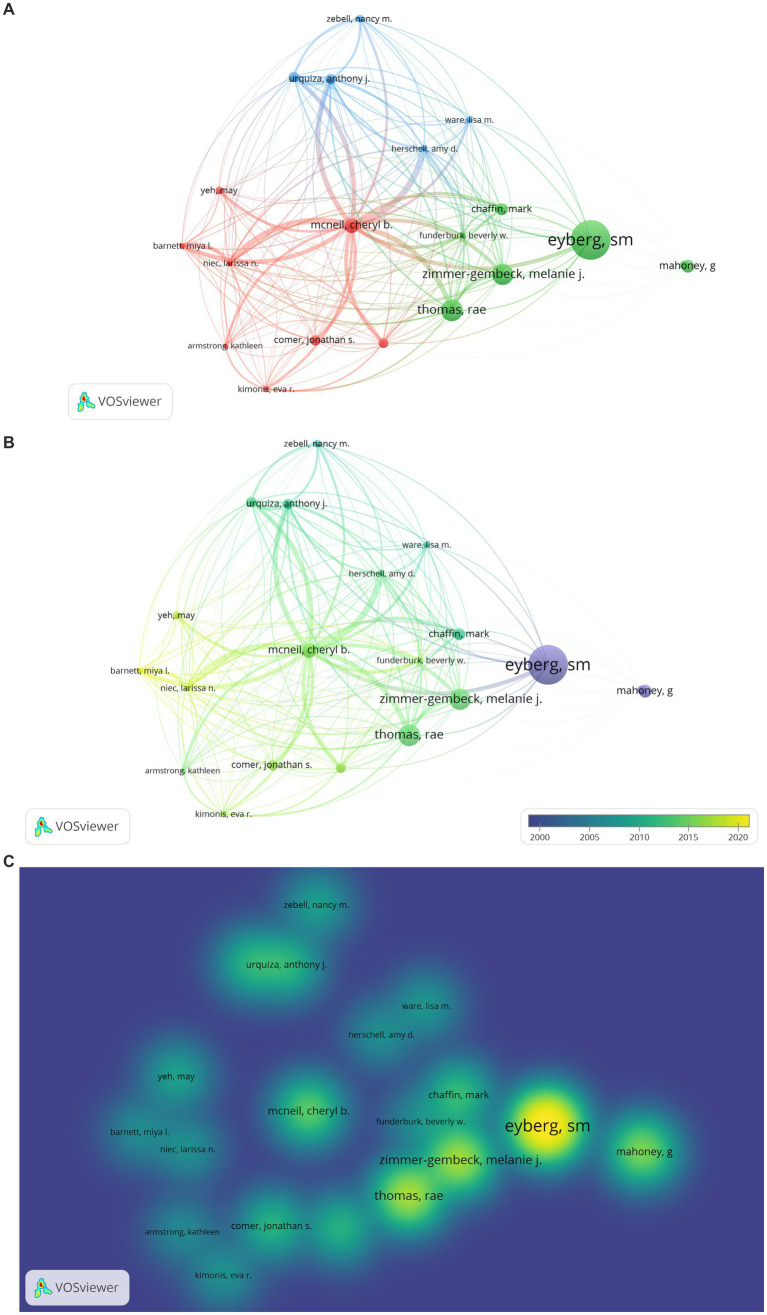
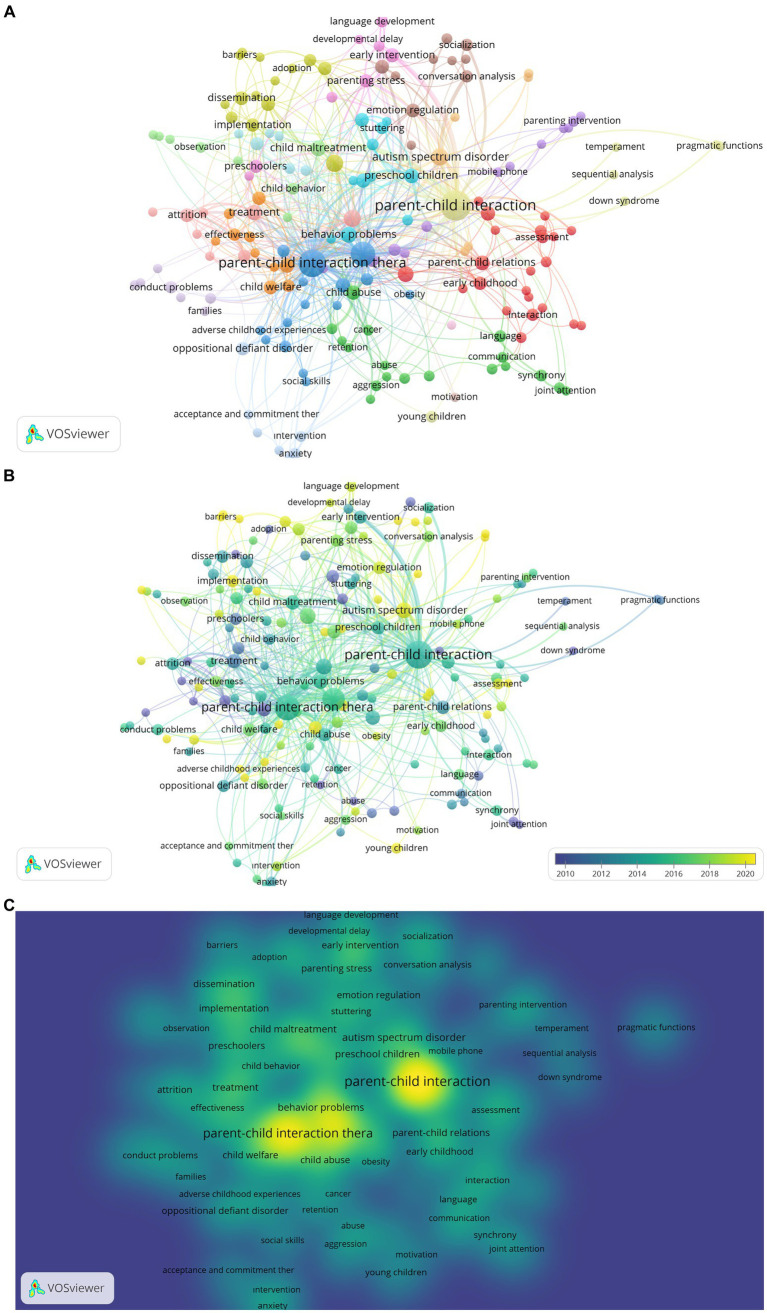
Parent-child interaction therapy (PCIT) is considered to be an effective intervention for children aged 2-7 years with conduct problems. PCIT research has been conducted for approximately 50 years; however, an analysis of general research patterns has not been published. In this context, the present study outlines a bibliometric analysis of scientific collaborations, prevalence across locations on the basis of countries and organizations, leading researchers, and trends within PCIT research. Findings demonstrate that PCIT is an area in which international scientific collaborations are intense and current, and collaborations continue to be formed around the world. Additionally, results indicate that dissemination of intercultural PCIT adaptations are continuous.

Keywords: PCIT; bibliometric analysis; parent–child interaction therapy; research trends; scientific collaborations.


Conflict of interest statement

The authors declare that the research was conducted in the absence of any commercial or financial relationships that could be construed as a potential conflict of interest.

Figures

Figure 1
Figure 1
The annual publication rate of PCIT.
Figure 2
Figure 2
Distribution of PCIT studies by WoS category.
Figure 3
Figure 3
Distribution of PCIT studies by publisher.
Figure 4
Figure 4
Distribution of PCIT studies by WoS index.
Figure 5
Figure 5
(A) Network Visualization of Country Collaborations of PCIT Studies. The larger the value taken according to the analysis unit, the larger the circles. The colors in the visualization do not have a specific meaning. (B) Overlay Visualization of Country Collaborations of PCIT Studies (Change by Years). The larger the value taken according to the analysis unit, the larger the circles. The circle colors ranging from purple to yellow indicate a chronological date. (C) Density Visualization of Country Collaborations of PCIT Studies. The larger the value taken according to the analysis unit, the larger the circles. The colors in the visualization do not have a specific meaning.
Figure 6
Figure 6
(A) Network Visualization of Organizational Collaborations of PCIT Studies. The larger the value taken according to the analysis unit, the larger the circles. The colors in the visualization do not have a specific meaning. (B) Overlay Visualization of Organizational Collaborations of PCIT Studies. The larger the value taken according to the analysis unit, the larger the circles. The circle colors ranging from purple to yellow indicate a chronological date. (C) Density Visualization of Organizational Collaborations of PCIT Studies. The larger the value taken according to the analysis unit, the larger the circles. The colors in the visualization do not have a specific meaning.
Figure 7
Figure 7
(A) Network Visualization of Researchers’ Collaboration in PCIT Studies. The larger the value taken according to the analysis unit, the larger the circles. The colors in the visualization do not have a specific meaning. (B) Overlay Visualization of Researchers’ Collaboration in PCIT Studies. The larger the value taken according to the analysis unit, the larger the circles. The circle colors ranging from purple to yellow indicate a chronological date. (C) Density Visualization of Researchers’ Collaboration in PCIT Studies. The larger the value taken according to the analysis unit, the larger the circles. The colors in the visualization do not have a specific meaning.
Figure 8
Figure 8
(A) Network Visualization of Journals Publishing PCIT Studies. The larger the value taken according to the analysis unit, the larger the circles. The colors in the visualization do not have a specific meaning. (B) Overlay Visualization of Journals Publishing PCIT Studies. The larger the value taken according to the analysis unit, the larger the circles. The circle colors ranging from purple to yellow indicate a chronological date. (C) Density Visualization of Journals Publishing PCIT Studies. The larger the value taken according to the analysis unit, the larger the circles. The colors in the visualization do not have a specific meaning.
Figure 9
Figure 9
(A) Citation Network Visualization of PCIT Researchers. The larger the value taken according to the analysis unit, the larger the circles. The colors in the visualization do not have a specific meaning. (B) Citation Overlay Visualization of PCIT Researchers. The larger the value taken according to the analysis unit, the larger the circles. The circle colors ranging from purple to yellow indicate a chronological date. (C) Citation Density Visualization of PCIT Researchers. The larger the value taken according to the analysis unit, the larger the circles. The colors in the visualization do not have a specific meaning.
Figure 10
Figure 10
(A) Co-occurrence Network Visualization of Keywords of PCIT Research. The larger the value taken according to the analysis unit, the larger the circles. The colors in the visualization do not have a specific meaning. (B) Co-occurrence Overlay Visualization of Keywords of PCIT Research. The larger the value taken according to the analysis unit, the larger the circles. The circle colors ranging from purple to yellow indicate a chronological date. (C) Co-occurrence Density Visualization of Keywords of PCIT Research. The larger the value taken according to the analysis unit, the larger the circles. The colors in the visualization do not have a specific meaning.

Similar articles

References

    1. Agazzi H., Knap K., Kimonis E. R. (2020). Parent–child interaction therapy-callous unemotional adaptation for a preschool boy with conduct problems. Clin. Case Stud. 19, 370–385. doi: 10.1177/1534650120950524, - DOI
    1. Agazzi H., Soca Lozano S., Hernandez M. (2022). Low treatment fidelity as an indication to switch ınterventions: pivoting from child-parent psychotherapy to parent-child interaction therapy for early childhood trauma. Clin. Case Stud. 22, 192–208. doi: 10.1177/15346501221124980 - DOI
    1. Agazzi H., Tan R., Tan S. Y. (2013). A case study of parent–child interaction therapy for the treatment of autism spectrum disorder. Clin. Case Stud. 12, 428–442. doi: 10.1177/1534650113500067 - DOI
    1. Allen K., Harrington J., Quetsch L. B., Masse J., Cooke C., Paulson J. F. (2022). Parent–child interaction therapy for children with disruptive behaviors and autism: a randomized clinical trial. J. Autism Dev. Disord. 53, 390–404. doi: 10.1007/s10803-022-05428-y, PMID: - DOI - PMC - PubMed
    1. Allen J., Marshall C. R. (2011). Parent–child interaction therapy (PCIT) in school-aged children with specific language impairment. Int. J. Lang. Commun. Disord. 46, 397–410. doi: 10.3109/13682822.2010.517600 - DOI - PubMed

LinkOut - more resources