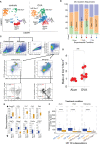
. 2023 May 12:14:1127485.
doi: 10.3389/fimmu.2023.1127485. eCollection 2023.

Single cell RNA sequencing reveals distinct clusters of Irf8-expressing pulmonary conventional dendritic cells

Affiliations

Single cell RNA sequencing reveals distinct clusters of Irf8-expressing pulmonary conventional dendritic cells

Adan Chari Jirmo et al. Front Immunol. .

Abstract

A single population of interferon-regulatory factor 8 (Irf8)-dependent conventional dendritic cell (cDC type1) is considered to be responsible for both immunogenic and tolerogenic responses depending on the surrounding cytokine milieu. Here, we challenge this concept of an omnipotent single Irf8-dependent cDC1 cluster through analysis of pulmonary cDCs at single cell resolution. We report existence of a pulmonary cDC1 cluster lacking Xcr1 with an immunogenic signature that clearly differs from the Xcr1 positive cDC1 cluster. The Irf8+Batf3+Xcr1- cluster expresses high levels of pro-inflammatory genes associated with antigen presentation, migration and co-stimulation such as Ccr7, Cd74, MHC-II, Ccl5, Il12b and Relb while, the Xcr1+ cDC1 cluster expresses genes corresponding to immune tolerance mechanisms like Clec9a, Pbx1, Cadm1, Btla and Clec12a. In concordance with their pro-inflammatory gene expression profile, the ratio of Xcr1- cDC1s but not Xcr1+cDC1 is increased in the lungs of allergen-treated mice compared to the control group, in which both cDC1 clusters are present in comparable ratios. The existence of two distinct Xcr1+ and Xcr1- cDC1 clusters is furthermore supported by velocity analysis showing markedly different temporal patterns of Xcr1- and Xcr1+cDC1s. In summary, we present evidence for the existence of two different cDC1 clusters with distinct immunogenic profiles in vivo. Our findings have important implications for DC-targeting immunomodulatory therapies.

Keywords: asthma; conventional dendritic cells; inflammation; single cell RNA sequencing; tolerance.


Conflict of interest statement

The authors declare that the research was conducted in the absence of any commercial or financial relationships that could be construed as a potential conflict of interest.

Figures
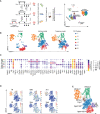
Figure 1
Figure 1
scRNASeq reveals heterogeneity of murine pulmonary cDC. Macrophages and cDCs were sorted from mice subjected to the OVA-induced model of asthma or tolerance as well as allergen-naïve control mice followed by 10x genomics platform based single cell generation and sequencing (A). Unsupervised clustering shows various populations which were identified based on their transcriptomic patterns (A). Clustering revealed multiple DC subpopulations in all treatment conditions (B). cDC subsets determining transcriptomic signatures (C, D) were used to annotate Irf8 and Irf4 dependent cDC populations (E). Lungs from n=8 animals were pooled, digested and single cells sorted. Technical replicates were done for the 10X genomics based single cell generation and subsequent sequencing.
Figure 2
Figure 2
Transcriptional patterns and functional heterogeneity of cDC1 clusters. Conventional DC1 were characterized based on expression of Irf8 and Batf3 and DC2 based on Irf4 and SIRP-α (A). Volcano plot showing subdivision of Irf8-expressing cDC1 based on Xcr1 expression (A, right). Differential gene expression depicted using Venn diagram showing DGEs between Xcr1+ and Xcr1- cDC1 (B) and gene ontology results of various biological processes differentially regulated in the 2 cDC1 clusters (C). A selection of functionally important genes differentially expressed between Xcr1+ and Xcr1- cDC1 clusters (D) and a comparative analysis of biological processes between Xcr1-Fcgr1+ cDC2 cluster and the cDC1 clusters Xcr1+Irf8+ and Xcr1-Irf8+ (E).
Figure 3
Figure 3
Impact of inflammation on Xcr1+ and Xcr1- cDC1 clusters revealed by scRNASeq. UMAP showing cDC clusters as seen in mice subjected to either allergen-naïve control procedure or experimental asthma (A). Frequencies of each DC cluster in the control, OVA-induced asthma or tolerance models (B). Characterization and analysis of Xcr1-expressing cDC1 in mice subjected to either control or asthma protocol showing a shift in subset distribution (C) and violin graph analysis indicating that the changes in frequencies occur in Xcr1- cluster in animals subjected to the experimental asthma (D). Analysis of selected genes relevant for functional differences between the Xcr1+ and Xcr1- cluster (E) and expression of CLEC12A on Irf8+ subpopulations of cDCs (F). p value in (D) was calculated using the non-parametric Mann-Whitney Test and the dots indicate the number of animals in each group. AM (Alveolar macrophages), DCs (dendritic cells). **Represents a p value less than 0.01, **** Represents a p value less than 0.0001.
Figure 4
Figure 4
Temporal patterns of pulmonary cDCs using RNA velocity. RNA velocity was applied to understand temporal patterns of various cDC clusters identified using scRNASeq (A). Latent time showing temporal patterns based on transcriptional activities in identified clusters (B) and heatmap of velocity-driving genes with annotations of a few at the positions where they appear for the different cDC clusters (C). RNA velocity graph for the Irf8-expressing sub-clusters (D) and dynamic model showing putative driver genes for the Irf8-expressing subgroup with annotations of a selected gene set (E). Comparative analysis of selected putative driver genes of the Xcr1+ (orange cluster) and Xcr1- (green cluster) comparing spliced and unspliced mRNA ratios (F).
Figure 5
Figure 5
Cluster-specific differential velocity expression patterns of pulmonary cDCs. RNA velocity length and expression patterns of genes Relb, Cacnb3, Clec9a, Ifit1 and Top2a on pulmonary cDCS (A-C) showing differences in both velocity and expression patterns on various clusters of cDCs. Partition abstraction graph (PAGA) showing trajectories of the clusters embedded into the velocity graph (D) and expression of Zbtb46 on various clusters (E). The solid black arrows represent transitions with high confidence based on the velocity data. Lack of arrows in D depicts lack of velocity connectivity between the clusters.

References

    1. Do Y, Park CG, Kang YS, Park SH, Lynch RM, Lee H, et al. . Broad T cell immunity to the LcrV virulence protein is induced by targeted delivery to DEC-205/CD205-positive mouse dendritic cells. Eur J Immunol (2008) 38(1):20–9. doi: 10.1002/eji.200737799 - DOI - PMC - PubMed
    1. Steinman RM. Dendritic cells and vaccines. Proc (Bayl Univ Med Cent) (2008) 21(1):3–8. doi: 10.1080/08998280.2008.11928346 - DOI - PMC - PubMed
    1. Villadangos JA, Schnorrer P. Intrinsic and cooperative antigen-presenting functions of dendritic-cell subsets in vivo . Nat Rev Immunol (2007) 7(7):543–55. doi: 10.1038/nri2103 - DOI - PubMed
    1. Heath WR, Carbone FR. Dendritic cell subsets in primary and secondary T cell responses at body surfaces. Nat Immunol (2009) 10(12):1237–44. doi: 10.1038/ni.1822 - DOI - PubMed
    1. Wu L, Shortman K. Heterogeneity of thymic dendritic cells. Semin Immunol (2005) 17(4):304–12. doi: 10.1016/j.smim.2005.05.001 - DOI - PubMed

Publication types