. 2023 May 16;9(5):e16152.
doi: 10.1016/j.heliyon.2023.e16152. eCollection 2023 May.

Bioinformatic analyzes and validation of cystathionine gamma-lyase as a prognostic biomarker and related to immune infiltrates in hepatocellular carcinoma

Affiliations

Bioinformatic analyzes and validation of cystathionine gamma-lyase as a prognostic biomarker and related to immune infiltrates in hepatocellular carcinoma

Jianfeng Xiang et al. Heliyon. .

Retraction in

Abstract

Background: The role of cystathionine γ-lyase (CTH) in the prognosis and immune invasion of hepatocellular carcinoma (HCC) remains poorly understood.

Methods: In this study, the clinical data of patients with HCC were analyzed, and the expression level of CTH was compared between HCC and normal tissues using the R package and various databases.

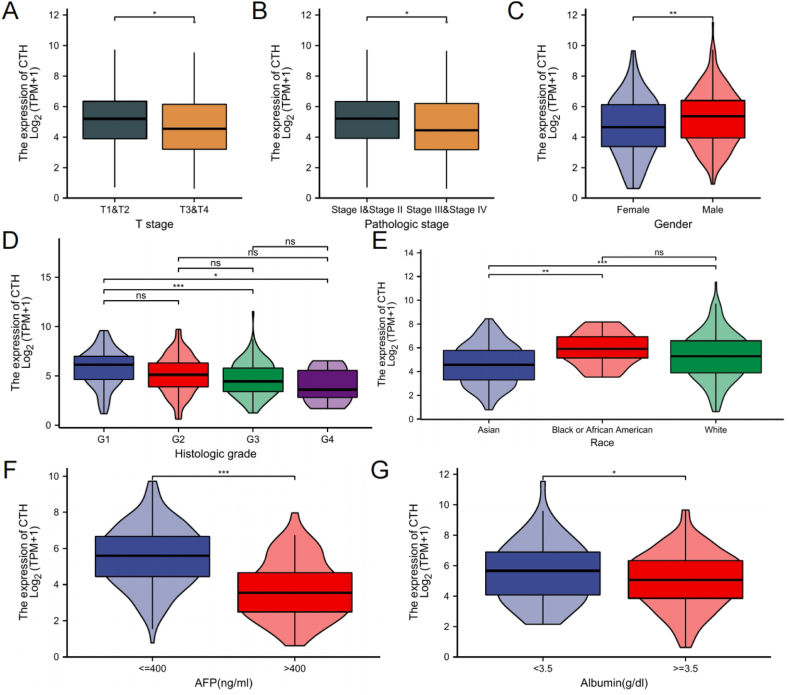
Results: We found that CTH expression was significantly decreased in HCC compared with normal tissues, and its expression was associated with various clinicopathological factors, including tumor stage, gender, tumor status, residual tumor, histologic stage, race, alpha-fetoprotein (AFP), albumin, drinking, and smoking. Our results suggest that CTH might be a protective factor for the survival of patients with HCC. Further functional analysis revealed that high CTH expression was enriched in the Reactome signaling by interleukins and the Reactome neutrophil degranulation. Moreover, CTH expression was closely correlated with a variety of immune cells, including a negative correlation with the CD56 (bright) NK cells and follicular helper T cell (TFH), while a positive correlation with Th17 cells and central memory T cell (Tcm). High expression of CTH in immune cells predicted a better prognosis of HCC. Our findings further indicated Pyridoxal phosphate, l-cysteine, Carboxymethylthio-3-(3-chlorophenyl)-1,2,4-oxadiazol, 2-[(3-Hydroxy-2-Methyl-5-Phosphonooxymethyl-Pyridin-4-Ylmethyl)-Imino]-5-phosphono-pent-3-enoic acid and L-2-amino-3-butynoic acid as potential target candidate medications for HCC treatment based on CTH.

Conclusion: Our study suggests that CTH can serve as a biomarker to predict the prognosis and immune infiltration of HCC.

Keywords: Biomarker; Cystathionine gamma-lyase (CTH); Hepatocellular carcinoma; Immune infiltration; Prognosis.


Conflict of interest statement

The authors declare that they have no known competing financial interests or personal relationships that could have appeared to influence the work reported in this paper

Figures

Fig. 1
Fig. 1
Expression levels of CTH in diverse malignant tumors. (A) Expression of CTH in different cancers compared with normal tissues in TCGA and GTEX databases. (B) Expression of CTH among different cancers in the TIMER database. (C) Differential expression levels of CTH in HCC in HCCDB database (D, E) Differential expression levels of CTH in HCC analyzed by R software (F) A ROC curve was established to test the value of CTH to identify HCC tissue. ns, p ≥ 0.05; *, p < 0.05; **, p < 0.01; ***, p < 0.001.
Fig. 2
Fig. 2
Clinical relevance of CTH in HCC. The level of CTH were significantly correlated with the tumor stage (A), pathologic stage (B), gender (C), histologic grade (D), race (E), alpha-fetoprotein (F) and albumin (G) of HCC patients. ns, pnts. ns*, p < 0.05; **, p < 0.01; ***, p < 0.001.
Fig. 3
Fig. 3
Expression of CTH and CTH related DEGs in HCC tissues. Immunohistochemical images showed high expression of CTH in normal liver tissues (A-C; G) and low expression of CTH in HCC tissues (D-F; H). The heat map of the top 50 CTH related up and down-regulated DEGs (I,J). Validations of the expression of the top 5 CTH related up and down-regulated DEGs in HCC (K,L). ns, p pions *, p < 0.05; **, p < 0.01; ***, p < 0.001.
Fig. 4
Fig. 4
Function and pathway enrichment analysis of CTH in HCC. Considerable GO terms of the top 300 genes most positively related to CTH, including biological processes (A), cell component (B) and molecular function (C). (D) Considerable KEGG pathways of the top 300 genes most positively related to CTH. Enrichment plots from the GSEA, including reactome signaling by interleukins and reactome neutrophil degranulation. NES, normalized enrichment score; p. adj, adjusted p value; FDR, false discovery rate.
Fig. 5
Fig. 5
Survival analysis of CTH in HCC patients. Kaplan-Meier survival curve analysis showed the overall survival (OS; n = 364), disease free survival (DSS; n = 362) and progression specific survival (PFS; n = 370) of different CTH in HCC using the Kaplan-Meier plotter database (A–C). OS and DSS analysis of tumor stages 1&2 (D, E; n = 257). OS and DSS analysis of tumor stages 3&4 (F, G; n = 90). OS analysis of AFP<400 (H; n = 215). OS analysis of Child-Pugh grade A&B&C (I; n = 241). Forest plot of univariate analysis (J).
Fig. 6
Fig. 6
Effects of alcohol consumption and hepatitis virus on the prognosis of CTH in HCC patients. (A, B) none alcohol consumption groups; (C, D) alcohol consumption groups; (E. F) none hepatitis virus groups; (G, H) hepatitis virus groups; (I, J) none alcohol and none hepatitis groups; (K, L) both alcohol consumption and hepatitis group.
Fig. 7
Fig. 7
Quantitative methods for predicting HCC patients' probabilities of 1-, 3-, and 5-year OS. (A) A Nomogram for predicting 1-, 3-, and 5-year OS in patients with HCC. (B) Time-dependent ROC plot for predicting 1-, 3-, and 5-year OS probabilities. OS, overall survival; AUC, area under ROC curve.
Fig. 8
Fig. 8
The correlations between the levels of TILs in human cancers analyzed by R package and TISIDB database. (A) The correlations between 24 TILs and CTH in HCC. (B) Heat map of CTH expression and 28 types of TILs across human heterogeneous cancers. Statistically significant TILs were selected for differential expression in HCC tissues containing CTH, in which iDC (C), B cells (D), macrophages (E), T cells (H), Tem (J), TFH (K), Th1 cells (M), Th2 cells (N) and NK CD56 bright cell (O) decreased, while neutrophils (F), Th17 cells (G), Tcm (I) and Tgd (L) increased. iDC, immature DC; Tem, T effector memory; TFH, T follicular helper; Tgd, T gamma delta; pDC, plasmacytoid DC; aDC, activated DC; Tcm, T central memory. TIL, tumor infiltrating lymphocyte. ns, pumor in*, p < 0.05; **, p < 0.01; ***, p < 0.001.
Fig. 9
Fig. 9
The correlations between CTH expression and 13 types of TILs with statistical significance in HCC patients. Among them, CTH level was negatively correlated with iDC (A), B cells (B), macrophages (C), T cells (F), Tem (H), TFH (I), Th1 cells (K), Th2 cells (L) and NK CD56 bright cell (M), and positively correlated with neutrophils (D), Th17 cells (E), Tcm (G) and Tgd (J). iDC, immature DC; Tem, T effector memory; TFH, T follicular helper; Tgd, T gamma delta; pDC, plasmacytoid DC; aDC, activated DC; Tcm, T central memory. TIL, tumor infiltrating lymphocyte.
Fig. 10
Fig. 10
Comparison of Kaplan-Meier survival curves of the high and low expression of CTH in HCC based on TIL subgroups. (A–H) High CTH level enriched in B cells, CD4+ memory T cells, CD8+ T cells, macrophages, NK T cells, Treg T cells, Th1 cells and Th2 cells had better OS in HCC.
Fig. 11
Fig. 11
Mutation, CNV, Methylation and Potential Drug Candidates on CTH. The CTH multiomics analysis (A) and screening of CTH targeted drug candidates(B). Pyridoxal phosphate (DB00114), l-cysteine (DB00151), 2-[(3-Hydroxy-2-Methyl-5-Phosphonooxymethyl-Pyridin-4-Ylmethyl)-Imino]-5-phosphono-pent-3-enoic acid (DB00151), Carboxymethylthio-3-(3-Chlorophenyl)-1, 2, 4-Oxadiazol (DB02328) and L-2-amino-3-butynoic acid (DB04217) were targets of CTH.
Fig. 12
Fig. 12
Up-regulation of CTH inhibits invasive abilities of HepG2 and Hep3B cells. (A) Compared with the negative control group in HepG2 and Hep3B cells, CTH expression in overexpression plasmid-transfected group was up-regulated using RT-qPCR. (B–C) Compared with the control group, transwell assay revealed that the up-regulation of CTH significantly inhibited the invasion ability of HepG2 and Hep3B cells using Students' t-test. ***, p < 0.001; ****, p < 0.0001.

References

    1. Ruman U., et al. Nanocarrier-based therapeutics and theranostics drug delivery systems for next generation of liver cancer nanodrug modalities. Int. J. Nanomed. 2020;15:1437–1456. - PMC - PubMed
    1. Lazarevich N.L., et al. Progression of HCC in mice is associated with a downregulation in the expression of hepatocyte nuclear factors. Hepatology. 2004;39(4):1038–1047. - PubMed
    1. Tanaka S., Arii S. Molecular targeted therapies in hepatocellular carcinoma. Semin. Oncol. 2012;39(4):486–492. - PubMed
    1. Ardelt M.A., et al. Inhibition of cyclin-dependent kinase 5: a strategy to improve sorafenib response in hepatocellular carcinoma therapy. Hepatology. 2019;69(1):376–393. - PMC - PubMed
    1. Wei Z., et al. Growth inhibition of human hepatocellular carcinoma cells by overexpression of G-protein-coupled receptor kinase 2. J. Cell. Physiol. 2012;227(6):2371–2377. - PMC - PubMed

Publication types