. 2023 May 12:13:1168772.
doi: 10.3389/fonc.2023.1168772. eCollection 2023.

Identification of the hub genes associated with prostate cancer tumorigenesis

Affiliations

Identification of the hub genes associated with prostate cancer tumorigenesis

Honghui Zhu et al. Front Oncol. .

Abstract

Introduction: Prostate cancer (PCa) is one of the most common malignant tumors of the male urogenital system; however, the underlying mechanisms remain largely unclear. This study integrated two cohort profile datasets to elucidate the potential hub genes and mechanisms in PCa.

Methods and results: Gene expression profiles GSE55945 and GSE6919 were filtered from the Gene Expression Omnibus (GEO) database to obtain 134 differentially expressed genes (DEGs) (14 upregulated and 120 downregulated) in PCa. Gene Ontology and pathway enrichment were performed using the Database for Annotation, Visualization, and Integrated Discovery, showing that these DEGs were mainly involved in biological functions such as cell adhesion, extracellular matrix, migration, focal adhesion, and vascular smooth muscle contraction. The STRING database and Cytoscape tools were used to analyze protein-protein interactions and identify 15 hub candidate genes. Violin plot, boxplot, and prognostic curve analyses were performed using Gene Expression Profiling Interactive Analysis, which identified seven hub genes, including upregulated expressed SPP1 and downregulated expressed MYLK, MYL9, MYH11, CALD1, ACTA2, and CNN1 in PCa compared with normal tissue. Correlation analysis was performed using the OmicStudio tools, which showed that these hub genes were moderately to strongly correlated with each other. Finally, quantitative reverse transcription PCR and western blotting were performed to validate the hub genes, showing that the abnormal expression of the seven hub genes in PCa was consistent with the analysis results of the GEO database.

Discussion: Taken together, MYLK, MYL9, MYH11, CALD1, ACTA2, SPP1, and CNN1 are hub genes significantly associated with PCa occurrence. These genes are abnormally expressed, leading to the formation, proliferation, invasion, and migration of PCa cells and promoting tumor neovascularization. These genes may serve as potential biomarkers and therapeutic targets in patients with PCa.

Keywords: bioinformatics analysis; biomarkers; differentially expressed genes (DEGs); hub genes; prostate cancer.


Conflict of interest statement

The authors declare that the research was conducted in the absence of any commercial or financial relationships that could be construed as a potential conflict of interest.

Figures

Figure 1
Figure 1
Volcano plot and Venn plot of DEGs. (A, B) Volcano plot of DEGs between PCa and normal tissues in GSE55945 and GSE6919, respectively. The X coordinate waslog2 (fold change)and the Y coordinate was −log10 (p value). Each dot represents a gene. Red dots are the upregulated genes of significant expression. Black dots are unchanged expressed genes. (C) Venn plot of the overlapping 14 upregulated and 120 downregulated DEGs from the GSE55945 and GSE6919 datasets.
Figure 2
Figure 2
The results of function and pathway enrichment analysis in DEGs. (A) The bubble plots indicate the results of function enrichment analysis in DEGs, including biological process, cell component, and molecular function. (B) The bubble plots indicate the results of pathway enrichment analysis in DEGs.
Figure 3
Figure 3
PPI network complex and modular analysis of DEGs in PCa. The network nodes are proteins. The edges represent the predicted functional associations. (A) Using the STRING Website, a total of 134 DEGs (red dots represent upregulated genes and blue dots represent downregulated genes) were filtered into the DEGs PPI network complex. The node size reflects the density of the nodes and the surrounding nodes. (B) The most significant module was screened using MCODE in the Cytoscape software. The higher degree of DEGs is represented by a more intense red color.
Figure 4
Figure 4
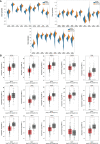
Violin plots and boxplots of 15 hub candidate genes using GEPIA. (A) Violin plots were analyzed to compare the expression distribution of 15 hub candidate genes in the GSE6919 and GSE55945 datasets. (B) Boxplots were performed to validate the expression of 15 hub candidate genes in PCa samples compared with normal samples based on TCGA and GTEx dataset. ACTA2, FLNA, MYH11, TAGLN, LDB3, MYLK, TPM1, MYL9, CNN1, FLNC, LMOD1, SMTN, CALD1, and CAV1 genes had significantly downregulated expression whereas SPP1 had significantly upregulated expression in PCa compared to normal specimen (*P < 0.05 versus normal group). The red and gray boxes represent PCa and normal tissues, respectively. The dots represent the expression in each sample.
Figure 5
Figure 5
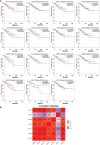
Prognostic curves of 15 hub candidate genes using GEPIA and a correlation matrix of seven hub genes proportions. (A) Prognostic curves were analyzed based on the TCGA and GTEx datasets. Downregulation of the genes MYLK, MYL9, MYH11, CALD1, ACTA2, and CNN1 and upregulation of SPP1 showed a significantly worse survival rate (P < 0.05) compared to that of the control, while the prognosis curves of the other eight genes were without statistical significance. The red lines represent patients with high gene expression, and blue lines represent patients with a low gene expression. (B) Correlation analysis performed using OmicStudio tools. Red represents positive correlations, and blue represents negative correlations.
Figure 6
Figure 6
The transcription of seven hub genes (MYLK, MYL9, MYH11, CALD1, ACTA2, SPP1, and CNN1) in the PCa and non-cancerous (NC) groups, as detected by qRT-PCR. *p< 0.05; **p< 0.01 versus NC group. The expression of the seven hub genes was normalized to the internal control (GAPDH) using the 2–ΔΔct method.
Figure 7
Figure 7
The protein expression level of seven hub genes (MYLK, MYL9, MYH11, CALD1, ACTA2, SPP1, and CNN1) in the PCa and non-cancerous (NC) groups, as detected by western blotting. (A) The protein images were obtained using ECL. (B) The protein image was digitized using Quantity One software and densitometry was used to quantify protein expression. *P< 0.05; **P< 0.01 versus NC group. The expression of the seven proteins was normalized to the internal control (β-actin and GAPDH).

References

    1. Cannarella R, Condorelli RA, Barbagallo F, La Vignera S, Calogero AE. Endocrinology of the aging prostate: current concepts. Front Endocrinol (2021) 12:554078. doi: 10.3389/fendo.2021.554078 - DOI - PMC - PubMed
    1. Wan H, Feng Y, Wu J, Zhu L, Mi Y. Functions and mechanisms of N6-methyladenosine in prostate cancer (Review). Mol Med Rep (2022) 26(3):280. doi: 10.3892/mmr.2022.12796 - DOI - PMC - PubMed
    1. Sousa B, Pereira J, Paredes J. The crosstalk between cell adhesion and cancer metabolism. Int J Mol Sci (2019) 20(8):1933. doi: 10.3390/ijms20081933 - DOI - PMC - PubMed
    1. Lee SW, Park SE, Jeong GS. Sporadic cell death in macroscale 3D tumor grafts with high drug resistance by activating cell-ECM interactions. Biofabrication (2021) 13(4). doi: 10.1088/1758-5090/ac24dd - DOI - PubMed
    1. Kang J, La Manna F, Bonollo F, Sampson N, Alberts IL, Mingels C, et al. . Tumor microenvironment mechanisms and bone metastatic disease progression of prostate cancer. Cancer Lett (2022) 530:156–69. doi: 10.1016/j.canlet.2022.01.015 - DOI - PubMed