. 2021 Jan 20;70(1):98-121.
doi: 10.1111/rssc.12451. eCollection 2021 Jan.

Quantifying the Trendiness of Trends

Affiliations

Quantifying the Trendiness of Trends

Andreas Kryger Jensen et al. J R Stat Soc Ser C Appl Stat. .

Abstract

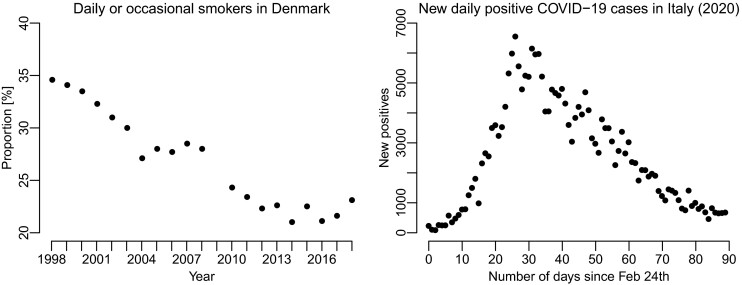
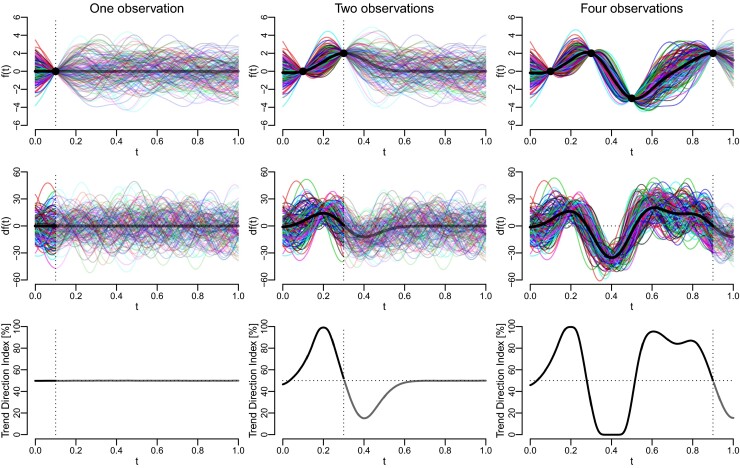
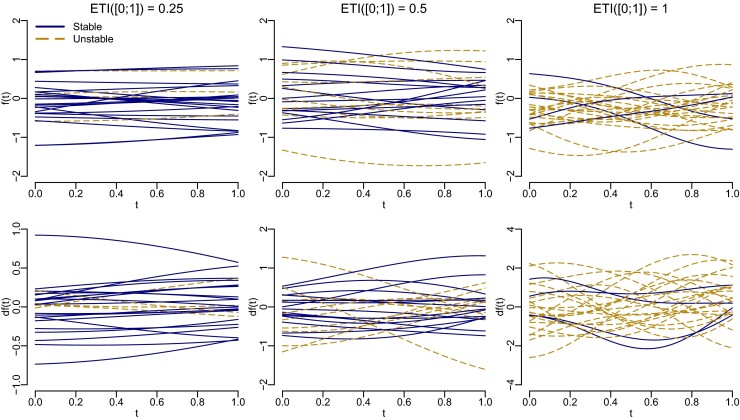
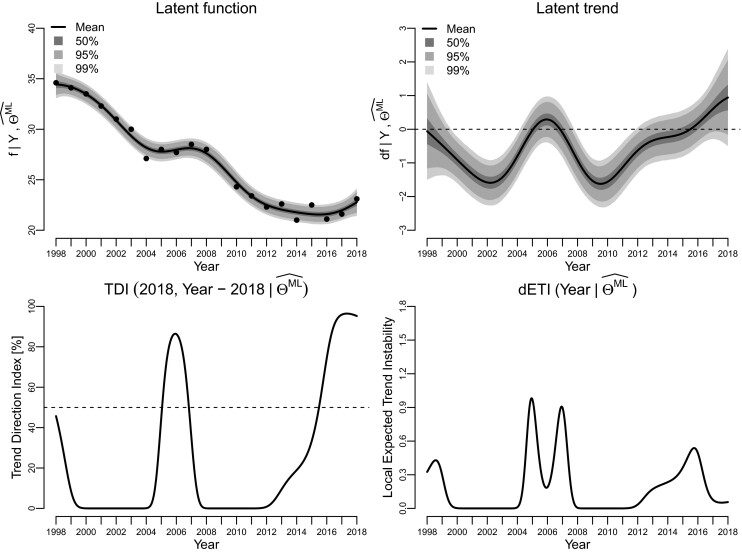
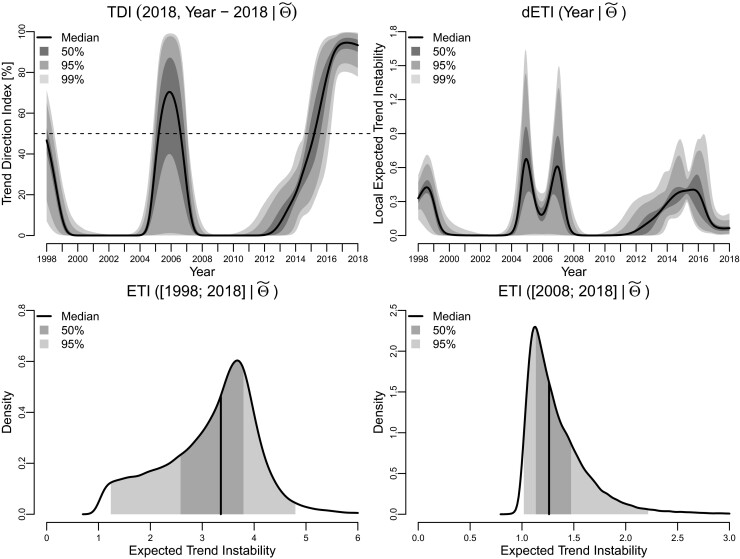
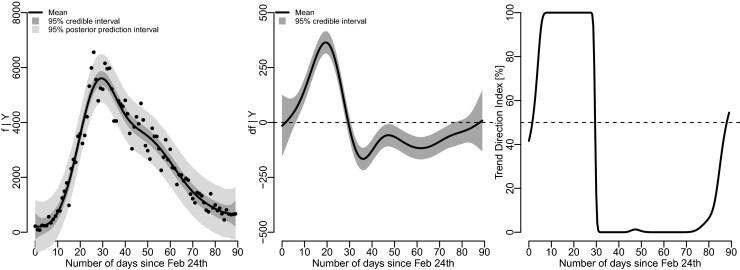
News media often report that the trend of some public health outcome has changed. These statements are frequently based on longitudinal data, and the change in trend is typically found to have occurred at the most recent data collection time point-if no change had occurred the story is less likely to be reported. Such claims may potentially influence public health decisions on a national level. We propose two measures for quantifying the trendiness of trends. Assuming that reality evolves in continuous time, we define what constitutes a trend and a change in trend, and introduce a probabilistic Trend Direction Index. This index has the interpretation of the probability that a latent characteristic has changed monotonicity at any given time conditional on observed data. We also define an index of Expected Trend Instability quantifying the expected number of changes in trend on an interval. Using a latent Gaussian process model, we show how the Trend Direction Index and the Expected Trend Instability can be estimated in a Bayesian framework, and use the methods to analyse the proportion of smokers in Denmark during the last 20 years and the development of new COVID-19 cases in Italy from 24 February onwards.

Keywords: Bayesian statistics; Gaussian processes; functional data analysis; trends.


Figures

FIGURE 1
FIGURE 1
Left panel: The proportion of daily or occasional smokers in Denmark during the last 20 years estimated from survey data and reported by the Danish Health Authority. The 2009 measurement is missing due to a problem with representativity. Right panel: The number of daily new cases tested positive for COVID-19 in Italy from 24 February 2020 and 90 days onwards
FIGURE 2
FIGURE 2
A total of 150 realizations from the posterior distribution of f (top row), df (middle row) with expected values in bold and the Trend Direction Index (bottom row) conditional on one, two and four noise-free observations. Dotted vertical lines show the points in time after which forecasting takes place [Colour figure can be viewed at wileyonlinelibrary.com]
FIGURE 3
FIGURE 3
A total of 25 random pairs sampled from the joint distribution of a Gaussian process (f) and its derivative (df) with different values of Expected Trend Instability (ETI). The first row shows samples from f, and the second row shows samples from df. The columns define different values of ETI. Sample paths that are trend stable are shown by solid blue lines, and unstable sample paths are shown by dashed gold coloured lines [Colour figure can be viewed at wileyonlinelibrary.com]
FIGURE 4
FIGURE 4
Results from fitting the latent Gaussian process model by maximum likelihood. The first row shows the posterior distributions of f (left) and df (right) with the posterior means in bold and grey areas showing pointwise probability intervals for the posterior distribution. The second row shows the estimated Trend Direction Index (left) and the local Expected Trend Instability (right)
FIGURE 5
FIGURE 5
Results from fitting the latent Gaussian process model by Bayesian analysis. The first row shows the posterior distributions of TDI (left) and local ETI (right) with the posterior means in bold and gray areas showing pointwise 95% and 99% probability intervals for the posterior distribution. The second row shows densities and probability intervals for the expected trend instability for the 20-year period back-in-time from 2018 (left) and 10 year back-in-time (right)
FIGURE 6
FIGURE 6
Results from the trend analysis of the Italian COVID-19 data. The left panel shows the number of new positives since 24 February along with the posterior mean of f and 95% credible and posterior prediction intervals. The middle panel shows the posterior distribution of the trend (df), and the right panel shows the Trend Direction Index

References

    1. Arnold, T.B. & Tibshirani, R.J. (2019) genlasso: Path Algorithm for Generalized Lasso Problems. Available from: https://CRAN.R-project.org/package=genlasso.
    1. Barry, D. & Hartigan, J.A. (1993) A Bayesian analysis for change point problems. Journal of the American Statistical Association, 88(421), 309–319.
    1. Basseville, M. & Nikiforov, I.V. (1993) Detection of abrupt changes: Theory and application. Upper Saddle River: Prentice-Hall.
    1. Bergmeir, C. & Benítez, J. M.. 2012. On the use of cross-validation for time series predictor evaluation. Information Sciences, 191, 192–213.
    1. Carlstein, E., Müller, H.-G. & Siegmund, D. eds. (1994) Change-point problems. Vol. 23. Lecture Notes—Monograph Series. Hayward, CA: Institute of Mathematical Statistics.

LinkOut - more resources