. 2023 May 12:17:1081190.
doi: 10.3389/fncel.2023.1081190. eCollection 2023.

Free fatty acids support oligodendrocyte survival in a mouse model of amyotrophic lateral sclerosis

Affiliations

Free fatty acids support oligodendrocyte survival in a mouse model of amyotrophic lateral sclerosis

Takashi Maruyama et al. Front Cell Neurosci. .

Abstract

Introduction: Amyotrophic lateral sclerosis (ALS) is a fatal neurodegenerative disease characterized by the white matter degeneration. Although changes in blood lipids are involved in the pathogenesis of neurological diseases, the pathological role of blood lipids in ALS remains unclear.

Methods and results: We performed lipidome analysis on the plasma of ALS model mice, mutant superoxide dismutase 1 (SOD1G93A) mice, and found that the concentration of free fatty acids (FFAs), including oleic acid (OA) and linoleic acid (LA), decreased prior to disease onset. An in vitro study revealed that OA and LA directly inhibited glutamate-induced oligodendrocytes cell death via free fatty acid receptor 1 (FFAR1). A cocktail containing OA/LA suppressed oligodendrocyte cell death in the spinal cord of SOD1G93A mice.

Discussion: These results suggested that the reduction of FFAs in the plasma is a pathogenic biomarker for ALS in the early stages, and supplying a deficiency in FFAs is a potential therapeutic approach for ALS by preventing oligodendrocyte cell death.

Keywords: SOD1; amyotrophic lateral sclerosis (ALS); free fatty acids; lipidome; oligodendrocyte.


Conflict of interest statement

The authors declare that the research was conducted in the absence of any commercial or financial relationships that could be construed as a potential conflict of interest.

Figures

FIGURE 1
FIGURE 1
Free fatty acid (FFA) concentration is reduced in the plasma of SOD1G93A mice. The plasma was obtained from WT or SOD1G93A mice at P60 and P100, and subjected to mass spectrometry for lipid analysis. (A) Kaplan–Meier curve showing the probability of SOD1G93A mice without tremor symptoms (n = 9). (B–D) A heat map showing the z-score of each fatty acid (B), lysophosphatidylcholine (C), and lysophosphatidic acid (D) in the plasma. The rows and columns represent lipids and samples, respectively (E,F). Graph indicating the relative concentration of oleic acid (OA) (E), and linoleic acid (LA) (F) in the plasma. The error bars represent mean ± SEM (n = 4 for each group). *P < 0.05, assessed by one-way ANOVA followed by Tukey–Kramer test for panel (E).
FIGURE 2
FIGURE 2
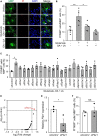
FFAR1 is a candidate molecule that regulates oligodendrocyte cell death. (A) Representative images show the fluorescence of PI (red) and immunocytochemistry for MBP (green) of primary oligodendrocytes treated with vehicle, glutamate, glutamate + OA + LA, OA + LA. White arrows indicate PI+ MBP+ cells. Scale bar: 30 μm. (B) Graph indicating the percentage of PI+ MBP+ cells in MBP+ cells (vehicle: n = 6, glutamate: n = 6, glutamate + OA + LA: n = 6, OA + LA: n = 5). (C) Graph showing the percentage of PI+ MBP+ cells in MBP+ cells of primary oligodendrocyte culture transfected with siRNA library followed by treatment with glutamate + OA + LA (n = 3 for each). (D) Plot indicating the –log10 (p-value) and log2 (fold change) of PI+ MBP+ cell percentage compared with control siRNA in each siRNA treatment (n = 3 for each group). (E) Relative expression of Ffar1 mRNA in primary oligodendrocytes after control or Ffar1 siRNA treatment (n = 3 for each group). (F) The percentage of PI+ MBP+ cells in MBP+ cells after Control or Ffar1 siRNA treatment (n = 3 for each group). Error bars represent mean ± SEM, **P < 0.01, *P < 0.05, assessed by one-way ANOVA followed by Tukey–Kramer test for panels (B–D), and by two-sided Student’s t-test for panels (E,F), NS, not significant.
FIGURE 3
FIGURE 3
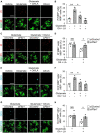
OA and LA inhibit glutamate-induced oligodendrocyte apoptosis via FFAR1. (A) Representative images show the fluorescence of PI (red) and immunocytochemistry for MBP (green) of purified primary oligodendrocytes treated with vehicle, glutamate, glutamate + OA/LA, and OA/LA. Scale bar: 100 μm. (B) Graph showing the percentage of PI+ MBP+ cells in MBP+ cells assessed from panel (A) (Vehicle: n = 4, glutamate: n = 4, glutamate + OA/LA: n = 4, and OA/LA: n = 4). (C) Representative images showing the fluorescence of PI (red) and immunocytochemistry for MBP (green) in purified primary oligodendrocytes treated with control siRNA or Ffar1 siRNA in the presence of glutamate with or without OA/LA. Scale bar: 100 μm. (D) Graph showing the percentage of PI+ MBP+ cells in MBP+ cells (Control siRNA in glutamate: n = 4, Control siRNA in glutamate + OA/LA: n = 4, Ffar1 siRNA in glutamate + OA/LA: n = 4, and Ffar1 siRNA in glutamate + OA/LA: n = 4). (E) Representative images showing fluorescence of immunocytochemistry for CC3 (cyan) and MBP (green) of purified primary oligodendrocytes treated with vehicle, glutamate, glutamate + OA/LA, and OA/LA. Scale bar: 100 μm. (F) Graph showing the percentage of CC3+ MBP+ cells in MBP+ cells assessed from panel (E) (vehicle: n = 4, glutamate: n = 4, glutamate + OA/LA: n = 4, and OA/LA: n = 4). (G) Representative images showing the fluorescence of immunocytochemistry for MBP (green) and CC3 (cyan) of purified primary oligodendrocytes treated with control siRNA or Ffar1 siRNA in the presence of glutamate with or without OA/LA. Scale bar: 100 μm. (H) Graph showing the percentage of CC3+ MBP+ cells in MBP+ cells assessed from panel (G) (Control siRNA in glutamate: n = 4, Control siRNA in glutamate + OA/LA: n = 4, Ffar1 siRNA in glutamate + OA/LA: n = 4, and Ffar1 siRNA in glutamate + OA/LA: n = 4). NS, not significant, *P < 0.05, **P < 0.01, assessed by one-way ANOVA followed by Tukey–Kramer test for panels (B,F), and two-way ANOVA followed by Sidak’s multiple comparison tests for panels (D,H).
FIGURE 4
FIGURE 4
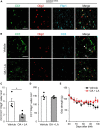
OA and LA prevent the OL loss in SOD1G93A mice. (A) Representative images show the immunohistochemistry for CC1 (green), Olig2 (red), and Ffar1 (cyan) in the spinal cord section of SOD1G93A at P100. (B) Representative images indicate immunohistochemistry for CC1 (green), Olig2 (red), and CC3 (cyan) in the spinal cord of Vehicle or OA + LA injected SOD1G93A mice at P100. White arrows indicate CC1+ Olig2+ CC3+ cells. (C) Graph shows the number of CC1+ Olig2+ CC3+ cells per mm2 (n = 4 for each group). (D) Graph shows the number of CC1+ Olig2+ cells per mm2 (n = 4 for each group). (E) Graph showing the gram of grip strength (vehicle: n = 3, OA/LA: n = 4). *P < 0.05 assessed by two-sided Student’s t-test for panel (C) and two-way ANOVA followed by Sidak’s multiple comparison test for panel (E). Scale bars: 25 μm for panels (A,B).
FIGURE 5
FIGURE 5
OA and LA prevent the degeneration of MNs in SOD1G93A mice. (A) Representative images show the immunohistochemistry for ChAT in the spinal cord section. (B) The graph shows the number of ChAT+ cells per section (vehicle: n = 5, OA + LA: n = 4). (C–F) Representative images show the immunohistochemistry for Iba1 (green, C) and GFAP (red, E) in the spinal cord section. Graphs show the relative fluorescence intensity of Iba1 (D) and GFAP (F), respectively (n = 4 for each group). Error bars represent mean ± SEM, *P < 0.05 assessed by two-sided Student’s t-test. NS, not significant. Scale bars: 100 μm (A,C,E).

Similar articles

Cited by

References

    1. Abdelmagid S. A., Clarke S. E., Nielsen D. E., Badawi A., El-Sohemy A., Mutch D. M., et al. (2015). Comprehensive profiling of plasma fatty acid concentrations in young healthy Canadian adults. PLoS One 10:e0116195. 10.1371/journal.pone.0116195 - DOI - PMC - PubMed
    1. Ahn J. H., Kim M. H., Kwon H. J., Choi S. Y., Kwon H. Y. (2013). Protective effects of oleic acid against palmitic acid-induced apoptosis in pancreatic AR42J cells and its mechanisms. Korean J. Physiol. Pharmacol. 17 43–50. 10.4196/kjpp.2013.17.1.43 - DOI - PMC - PubMed
    1. Allan K. C., Hu L. R., Scavuzzo M. A., Morton A. R., Gevorgyan A. S., Cohn E. F., et al. (2021). Non-canonical targets of HIF1a impair oligodendrocyte progenitor cell function. Cell Stem Cell 28 257–272.e11. 10.1016/j.stem.2020.09.019 - DOI - PMC - PubMed
    1. Avila-Martin G., Galan-Arriero I., Gómez-Soriano J., Taylor J. (2011). Treatment of rat spinal cord injury with the neurotrophic factor albumin-oleic acid: Translational application for paralysis, spasticity and pain. PLoS One 6:e26107. 10.1371/journal.pone.0026107 - DOI - PMC - PubMed
    1. Barber S. C., Mead R. J., Shaw P. J. (2006). Oxidative stress in ALS: A mechanism of neurodegeneration and a therapeutic target. Biochim. Biophys. Acta 1762 1051–1067. 10.1016/j.bbadis.2006.03.008 - DOI - PubMed

LinkOut - more resources