. 2023;6(5):383-391.
doi: 10.1038/s41929-023-00947-y. Epub 2023 Apr 17.

Three-dimensional nanoimaging of fuel cell catalyst layers

Affiliations

Three-dimensional nanoimaging of fuel cell catalyst layers

Robin Girod et al. Nat Catal. 2023.

Abstract

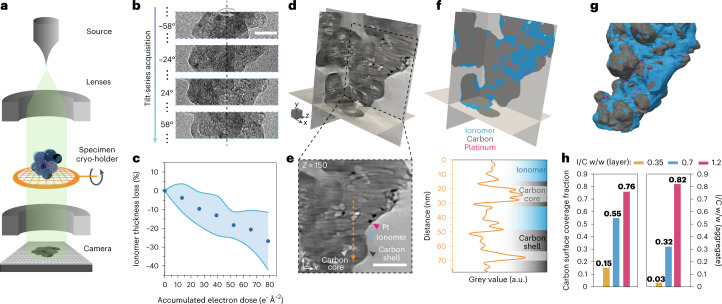
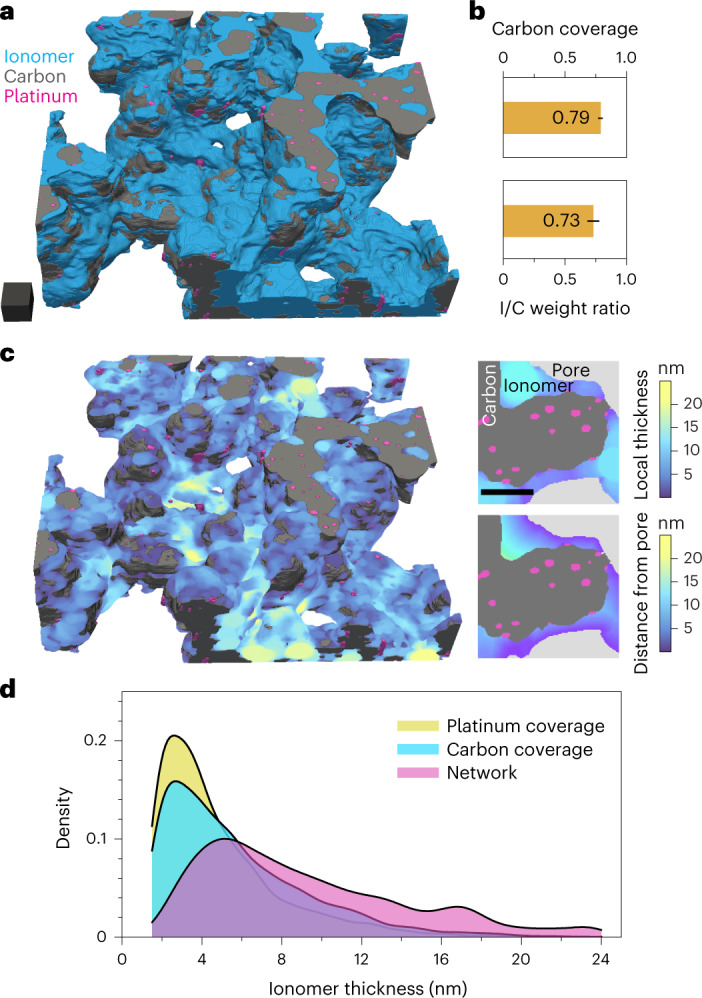
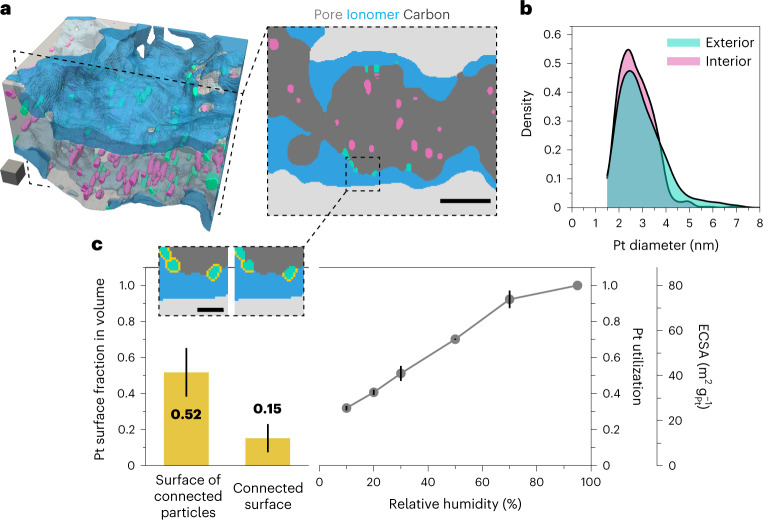
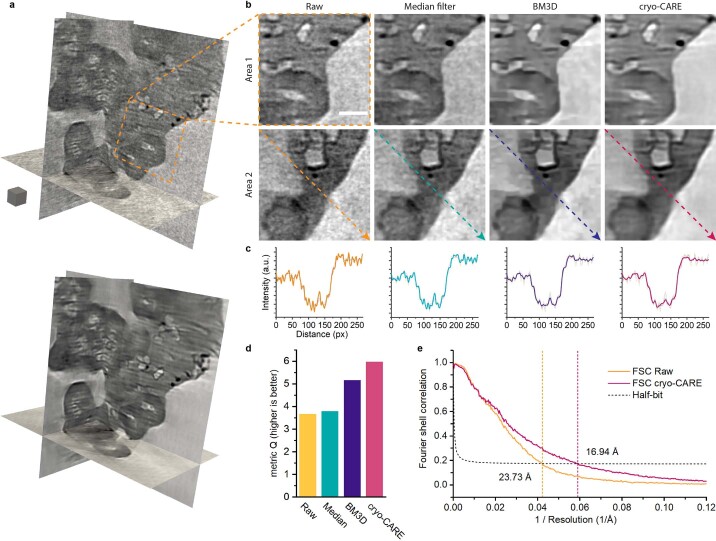
Catalyst layers in proton exchange membrane fuel cells consist of platinum-group-metal nanocatalysts supported on carbon aggregates, forming a porous structure through which an ionomer network percolates. The local structural character of these heterogeneous assemblies is directly linked to the mass-transport resistances and subsequent cell performance losses; its three-dimensional visualization is therefore of interest. Herein we implement deep-learning-aided cryogenic transmission electron tomography for image restoration, and we quantitatively investigate the full morphology of various catalyst layers at the local-reaction-site scale. The analysis enables computation of metrics such as the ionomer morphology, coverage and homogeneity, location of platinum on the carbon supports, and platinum accessibility to the ionomer network, with the results directly compared and validated with experimental measurements. We expect that our findings and methodology for evaluating catalyst layer architectures will contribute towards linking the morphology to transport properties and overall fuel cell performance.

Keywords: Electrocatalysis; Energy; Fuel cells; Imaging studies.


Conflict of interest statement

Competing interestsThe authors declare no competing interests.

Figures

Fig. 1
Fig. 1. Cryo-ET workflow and analyses on Nafion–LSC–platinum aggregates.
a, Schematic demonstrating electron tomography acquisition. Aggregates are dispersed on a grid and imaged over >70 angles in 2° increments. b, Representative projections acquired during the tilt series. Scale bar, 50 nm. c, Average beam-induced degradation measured from thickness loss of ionomer layers imaged at 98 K. Data points are the mean, whereas the shaded area represents 1 s.d. (N = 11). d,e, Multi-orthoslices view (d) and representative tomograms (e) of a 0.7 w/w Nafion/LSC with 8.7 wt% platinum on carbon (sample LSC7 in Supplementary Table 1). Scale bar, 50 nm; scale cube, 203 nm3. A line profile of the grey levels is plotted along the orange dashed arrow in e to point out the different features. Shaded areas are provided as guides to identify regions that correspond to the ionomer phase (blue), carbon shells (dark grey) and carbon hollow cores (light grey). f,g, Segmentation results from the same aggregate (f) and corresponding surface rendered view (g). h, Quantitative analysis of the carbon coverage and effective I/C w/w ratio in aggregates from the catalyst layers prepared with different ionomer content (samples LSC3, LSC7 and LSC12 in Supplementary Table 1).
Fig. 2
Fig. 2. Cryo-ET reconstruction of a microtomed 3M ionomer–HSC–platinum catalyst layer and ionomer network analysis.
The catalyst layer was prepared with a 0.7 I/C weight ratio and a 19.8 wt%Pt catalyst (sample HSC7 in Supplementary Table 1). a,b, Segmented reconstruction (a) and measurements of I/C weight ratio and carbon surface coverage (b). Error bars represent the measurement error due to segmentation (see Methods). Scale cube, 203 nm3. c, A 3D map of the ionomer local thickness, and magnified images illustrating the difference in calculation to the local thickness algorithm, and a graph-based distance calculation from the external pore. Scale bar, 20 nm. d, Distribution of the ionomer thickness plotted for different sampling and calculation methods. The network thickness is sampled randomly throughout the ionomer in the local thickness map, whereas carbon and platinum coverages are sampled randomly at their respective interfaces with the ionomer in the distance-from-pore maps. The cutoff at 1.5 nm accounts for the resolution limit.
Fig. 3
Fig. 3. Platinum-related morphology analysis in the microtomed 3M ionomer–HSC–platinum catalyst layer.
a, Sub-volume and magnified 2D maps from the segmented reconstruction in Fig. 2 demonstrating the localization of platinum nanoparticles interior (pink) or exterior (green) to the porous carbon supports. Scale cube, 103 nm3; scale bar, 20 nm. b, Distribution of the platinum diameters as a function of their location. The cutoff at 1.5 nm accounts for the resolution limit. c, Comparison of platinum surface measurements from tomography and electrochemistry. As illustrated in the magnified slices (scale bar, 5 nm), the measurements from the tomographic reconstruction represent the fraction of the platinum surface in direct contact with the ionomer (connected surface), and the fraction of the platinum surface of all particles in contact with the ionomer (surface of connected particles). Electrochemical measurements are the ECSA and platinum utilization from CO stripping surface area measurements as a function of relative humidity in the membrane electrode assembly (MEA), scanned from 0.1–1.0 V at 10 mV s–1 and 80 °C. The grey dots represent the average of N = 2 measurements. Error bars represent the measurements error due to segmentation for tomography (see Methods) and the min–max values of N = 2 measurements for electrochemical data.
Extended Data Fig. 1
Extended Data Fig. 1. Comparison of denoising methods for tomographic reconstruction and resolution estimation.
a, Multi-orthoslice overview of a raw reconstruction of an aggregate from the LSC7 sample and comparison with the same volume denoised with the cryo-CARE method. Scale cube is 203 nm3. b, Representative areas from the reconstruction and denoising results following a median filter with a 2×2 pixels kernel, the BM3D algorithm,, and the cryo-CARE method. Median and BM3D were applied plane-by-plane while cryo-CARE is a volumetric method. Scale bar is 20 nm. c, Line profiles plotted from the area 2 as shown by the corresponding arrows in (b). d, Metric Q comparison. Higher values indicate lower levels of noise and blur in 252 px2 anisotropic patches of an image. e, Fourier shell correlation plots computed from the even and odd volumes before (raw) and after denoising with cryo-CARE. The resolution was estimated at the half-bit criterion.
Extended Data Fig. 2
Extended Data Fig. 2. Methodology and performance of the segmentation process.
a, Schematic depiction of the training strategy as described in Methods on the LSC7 sample. For each denoised reconstruction, 1/10 z-sections are extracted and sparsely annotated by hand in 2D. This dataset is used for training a U-Net model which is then applied to predict the segmentation maps of every z-sections, that is, plane-by-plane, in the denoised volume, before reassembling in 3D. Scale cube is 203 nm3 and scale bars are 50 nm. b, e, Example tomograms and close-ups taken from the reconstructions and c, f, corresponding segmentation output for the LSC7 (b,c) and HSC7 (e,f) samples. Scale bars are 50 nm, 20 nm in the close-ups. d, g, Comparison of segmentation metric scores computed from a validation dataset held-out from training. For each class, recall is defined as the fraction of ground truth pixels of this class correctly labelled as such in the output, precision as the fraction of output pixels of this class correctly labelled. The F1 score incorporates both metrics in one.
Extended Data Fig. 3
Extended Data Fig. 3. Cryo-ET reconstructions of Nafion-LSC-Pt aggregates with increasing I/C ratio.
a-c, Segmented volumes of aggregates from the LSC3, 7 and 12 samples, respectively. All volumes are shown at the same scale, the scale cube is 203 nm3.

References

    1. Debe MK. Electrocatalyst approaches and challenges for automotive fuel cells. Nature. 2012;486:43–51. doi: 10.1038/nature11115. - DOI - PubMed
    1. Fan J, et al. Bridging the gap between highly active oxygen reduction reaction catalysts and effective catalyst layers for proton exchange membrane fuel cells. Nat. Energy. 2021;6:475–486. doi: 10.1038/s41560-021-00824-7. - DOI
    1. Jiao K, et al. Designing the next generation of proton-exchange membrane fuel cells. Nature. 2021;595:361–369. doi: 10.1038/s41586-021-03482-7. - DOI - PubMed
    1. Padgett E, et al. Connecting fuel cell catalyst nanostructure and accessibility using quantitative cryo-STEM tomography. J. Electrochem. Soc. 2018;165:F173–F180. doi: 10.1149/2.0541803jes. - DOI
    1. Ko M, Padgett E, Yarlagadda V, Kongkanand A, Muller DA. Revealing the nanostructure of mesoporous fuel cell catalyst supports for durable, high-power performance. J. Electrochem. Soc. 2021;168:024512. doi: 10.1149/1945-7111/abe28e. - DOI