. 2023 May 30:12:e86394.
doi: 10.7554/eLife.86394.

Improved isolation of extracellular vesicles by removal of both free proteins and lipoproteins

Affiliations

Improved isolation of extracellular vesicles by removal of both free proteins and lipoproteins

Dmitry Ter-Ovanesyan et al. Elife. .

Abstract

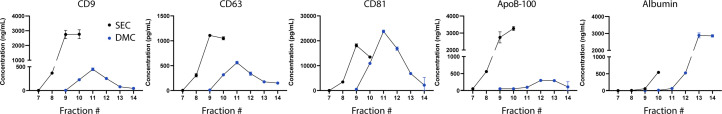
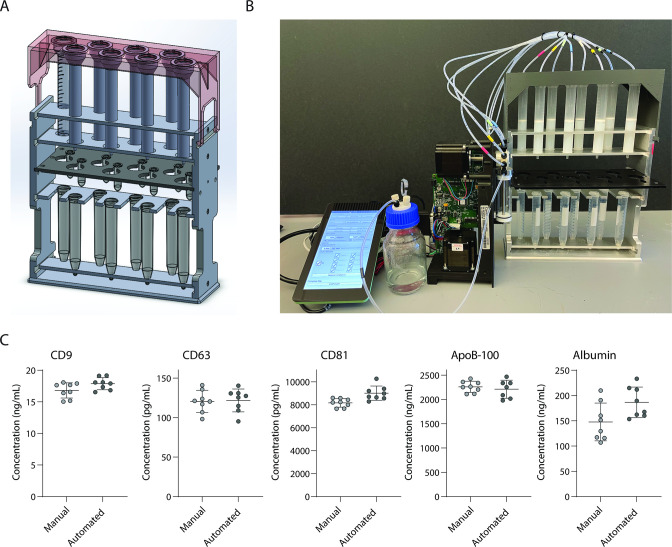
Extracellular vesicles (EVs) are released by all cells into biofluids such as plasma. The separation of EVs from highly abundant free proteins and similarly sized lipoproteins remains technically challenging. We developed a digital ELISA assay based on Single Molecule Array (Simoa) technology for ApoB-100, the protein component of several lipoproteins. Combining this ApoB-100 assay with previously developed Simoa assays for albumin and three tetraspanin proteins found on EVs (Ter-Ovanesyan, Norman et al., 2021), we were able to measure the separation of EVs from both lipoproteins and free proteins. We used these five assays to compare EV separation from lipoproteins using size exclusion chromatography with resins containing different pore sizes. We also developed improved methods for EV isolation based on combining several types of chromatography resins in the same column. We present a simple approach to quantitatively measure the main impurities of EV isolation in plasma and apply this approach to develop novel methods for enriching EVs from human plasma. These methods will enable applications where high-purity EVs are required to both understand EV biology and profile EVs for biomarker discovery.

Keywords: ApoB-100; EVs; biochemistry; chemical biology; exosomes; extracellular vesicles; human; lipoproteins; medicine.


Conflict of interest statement

DT DT has filed IP on methods for EV isolation and analysis, TG TG has filed IP on methods for EV isolation and analysis, BB BB has filed IP on methods for EV isolation and analysis, AN, SW, RL, WT No competing interests declared, DK DK has filed IP on methods for EV isolation and analysis, GC GMC has filed IP on methods for EV isolation and analysis, DW DRW has filed IP on methods for EV isolation and analysis

Figures

Figure 1.
Figure 1.. Validation of ApoB-100 Simoa assay.
Simoa ApoB-100 assay was validated using: (A) Calibration curve using purified ApoB-100 protein. (B) Dilutions of human plasma (from three different individuals) to confirm dilution linearity of endogenous ApoB-100. Error bars represent the standard deviation from two technical replicates.
Figure 2.
Figure 2.. Size exclusion chromatography (SEC) of plasma using different resins.
(A) Levels of CD9, CD63, CD81, ApoB-100, and albumin were measured by Simoa after SEC of 1 ml plasma in each fraction using either Sepharose CL-2B, Sepharose CL-4B, or Sepharose CL-6B resin. (B) Extracellular vesicle (EV) yield is calculated in fractions 7–10 for Sepharose CL-2B, Sepharose CL-4B, or Sepharose CL-6B by averaging the ratios of CD9, CD63, and CD81. (C) Purity of EVs with respect to lipoproteins or free proteins is calculated by dividing relative EV yield (the average of the ratios of CD9, CD63, and CD81) by levels of ApoB-100 (top) or albumin (bottom). Error bars represent the standard deviation of four columns measured on different days with two technical replicates each.
Figure 2—figure supplement 1.
Figure 2—figure supplement 1.. In-column phosphate-buffered saline (PBS) washes improve extracellular vesicle (EV) recovery.
(A) Levels of CD9, CD63, CD81, and albumin were measured by Simoa after EV isolation from 1 ml plasma with size exclusion chromatography (SEC) using 0, 1, 2, or 3 in-column 10 ml PBS washes. Error bars represent the standard deviation from two technical replicates. (B) Percent recovery of EVs using average of ratios of CD9, CD63, and CD81 in SEC isolation relative to plasma.
Figure 3.
Figure 3.. Separation of extracellular vesicles (EVs), lipoproteins, and free proteins from plasma using density gradient centrifugation.
Levels of CD9, CD63, CD81, albumin, and ApoB-100 were measured by Simoa in individual 1 ml fractions (collected from the top) after density gradient centrifugation of plasma using an iodixanol gradient. Error bars represent the standard deviation of two replicates of each measurement.
Figure 3—figure supplement 1.
Figure 3—figure supplement 1.. Comparison of density gradient centrifugation to size exclusion chromatography (SEC).
Levels of CD9, CD63, CD81, ApoB-100 albumin were measured (in duplicate and then averaged) by Simoa to compare extracellular vesicle (EV) isolation from 1 ml plasma using density gradient (DG) centrifugation, SEC, or density gradient centrifugation followed by size exclusion chromatography (DG-SEC). For the DG and DG-SEC condition, fraction 10 was analyzed. Simoa measurements were used to quantify relative EV recovery (A), EV/ApoB-100 ratio (B), and EV/albumin ratio (C).
Figure 4.
Figure 4.. Comparison of novel columns for extracellular vesicle (EV) isolation from plasma using electron microscopy and Simoa.
(A) Schematic of the columns being compared: size exclusion chromatography (SEC) column comprised of 10 ml Sepharose CL-6B, dual-mode chromatography (DMC) columns comprised of 10 ml Sepharose CL-6B SEC resin atop 2 ml Fractogel cation exchange resin, Tri-Mode Chromatography (TMC) columns comprised of 10 ml Sepharose CL-6B SEC resin atop 2 ml 2:1 ratio of 2 ml Fractogel cation exchange resin to Capto Core 700 multimodal chromatography resin. (B) Electron microscopy of EVs isolated from plasma using SEC (left), DMC (middle), or TMC (right) columns. EVs indicated with red arrows (among background of lipoproteins). (C) EV recovery is calculated for EV isolation from plasma for SEC (fractions 7–10), DMC (fractions 9–12), or TMC (fractions 9–12). Simoa measurements in the designated fractions for CD9, CD63, and CD81 are taken as a ratio relative to measurements of these proteins from diluted plasma and these three ratios are then averaged to calculate recovery. (D) Purity of EVs with respect to free proteins is determined by dividing relative EV yield (the average of the ratios of CD9, CD63, and CD81) by relative levels of albumin in each condition. (E) Purity of EVs with respect to lipoproteins is determined by dividing relative EV yield (the average of the ratios of CD9, CD63, and CD81) by relative levels of ApoB-100 in each condition. Error bars represent the standard deviation of four column measured on different days with two technical replicates each.
Figure 4—figure supplement 1.
Figure 4—figure supplement 1.. Comparison of resin volumes and ratios for Tri-Mode Chromatography (TMC) column.
Levels of CD9, CD63, CD81, ApoB-100, and albumin were measured (in duplicate and then averaged) by Simoa in extracellular vesicle (EV) samples isolated from 1 ml plasma to compare TMC columns with different volumes and ratios of Fractogel cation exchange resin to Capto Core 700 resin. All conditions describe the bottom layer under a 10 ml Sepharose CL-6B top layer. The 1, 2, or 4 ml volume of the bottom later indicates the volume of the solid resin mixture of Fractogel cation exchange resin and Capto Core 700 resin. The following fractions were collected for each: 8–11 for 1 ml bottom layer, 9–12 for 2 ml bottom layer, and 11–14 for 4 ml bottom layer.
Figure 4—figure supplement 2.
Figure 4—figure supplement 2.. Analysis of markers in individual fractions of size exclusion chromatography (SEC) and dual-mode chromatography (DMC).
Levels of CD9, CD63, CD81, ApoB-100, and albumin were measured by Simoa in fractions 7–10 for SEC with 10 ml Sepharose CL-6B column and fractions 7–14 for DMC using a column with 2 ml Fractogel cation exchange bottom layer and 10 ml Sepharose CL-6B top layer. Error bars represent the standard deviation from two technical replicates.
Figure 4—figure supplement 3.
Figure 4—figure supplement 3.. Comparison of marker levels in size exclusion chromatography (SEC), dual-mode chromatography (DMC), and Tri-Mode Chromatography (TMC).
Levels of CD9, CD63, CD81, ApoB-100, and albumin were measured by Simoa in extracellular vesicle (EV) samples isolated from 1 ml plasma using SEC (fractions 7–10), DMC (fractions 9–12), or TMC columns (fractions 9–12). Error bars represent the standard deviation of four column measured on different days with two technical replicates each.
Figure 5.
Figure 5.. Development and validation of automated device for running size exclusion chromatography (SEC) columns in parallel.
(A) CAD image of semi-automated SEC stand designed to hold eight columns at once with sliding collection tube holder that allows liquid to drip either into 2 ml collection tubes, or to waste. (B) Photograph of stand connected to a Tecan Cavro syringe pump controlled by a Raspberry Pi. (C) Simoa comparison of CD9, CD63, CD81, ApoB-100, and albumin when SEC was performed on 16 samples of 1 ml plasma using either manual SEC (8 samples) or SEC on the automated device (8 samples). Each point is the average of two Simoa measurements (technical replicates).

Update of

  • doi: 10.1101/2023.01.20.524891

References

    1. Blom H, Åkerblom A, Kon T, Shaker S, van der Pol L, Lundgren M. Efficient chromatographic reduction of Ovalbumin for egg-based influenza virus purification. Vaccine. 2014;32:3721–3724. doi: 10.1016/j.vaccine.2014.04.033. - DOI - PubMed
    1. Brownlee Z, Lynn KD, Thorpe PE, Schroit AJ. A novel "salting-out" procedure for the isolation of tumor-derived Exosomes. Journal of Immunological Methods. 2014;407:120–126. doi: 10.1016/j.jim.2014.04.003. - DOI - PMC - PubMed
    1. German JB, Smilowitz JT, Zivkovic AM. Lipoproteins: When size really matters. Current Opinion in Colloid & Interface Science. 2006;11:171–183. doi: 10.1016/j.cocis.2005.11.006. - DOI - PMC - PubMed
    1. Hartjes TA, Mytnyk S, Jenster GW, van Steijn V, van Royen ME. Extracellular Vesicle Quantification and characterization: Common methods and emerging approaches. Bioengineering. 2019;6:7. doi: 10.3390/bioengineering6010007. - DOI - PMC - PubMed
    1. Johnsen KB, Gudbergsson JM, Andresen TL, Simonsen JB. What is the blood concentration of extracellular Vesicles? implications for the use of extracellular Vesicles as blood-borne biomarkers of cancer. Biochimica et Biophysica Acta. Reviews on Cancer. 2019;1871:109–116. doi: 10.1016/j.bbcan.2018.11.006. - DOI - PubMed

Publication types

MeSH terms