. 2023 Jun 6;120(23):e2216908120.
doi: 10.1073/pnas.2216908120. Epub 2023 May 30.

Tuft cells mediate commensal remodeling of the small intestinal antimicrobial landscape

Affiliations

Tuft cells mediate commensal remodeling of the small intestinal antimicrobial landscape

Connie Fung et al. Proc Natl Acad Sci U S A. .

Abstract

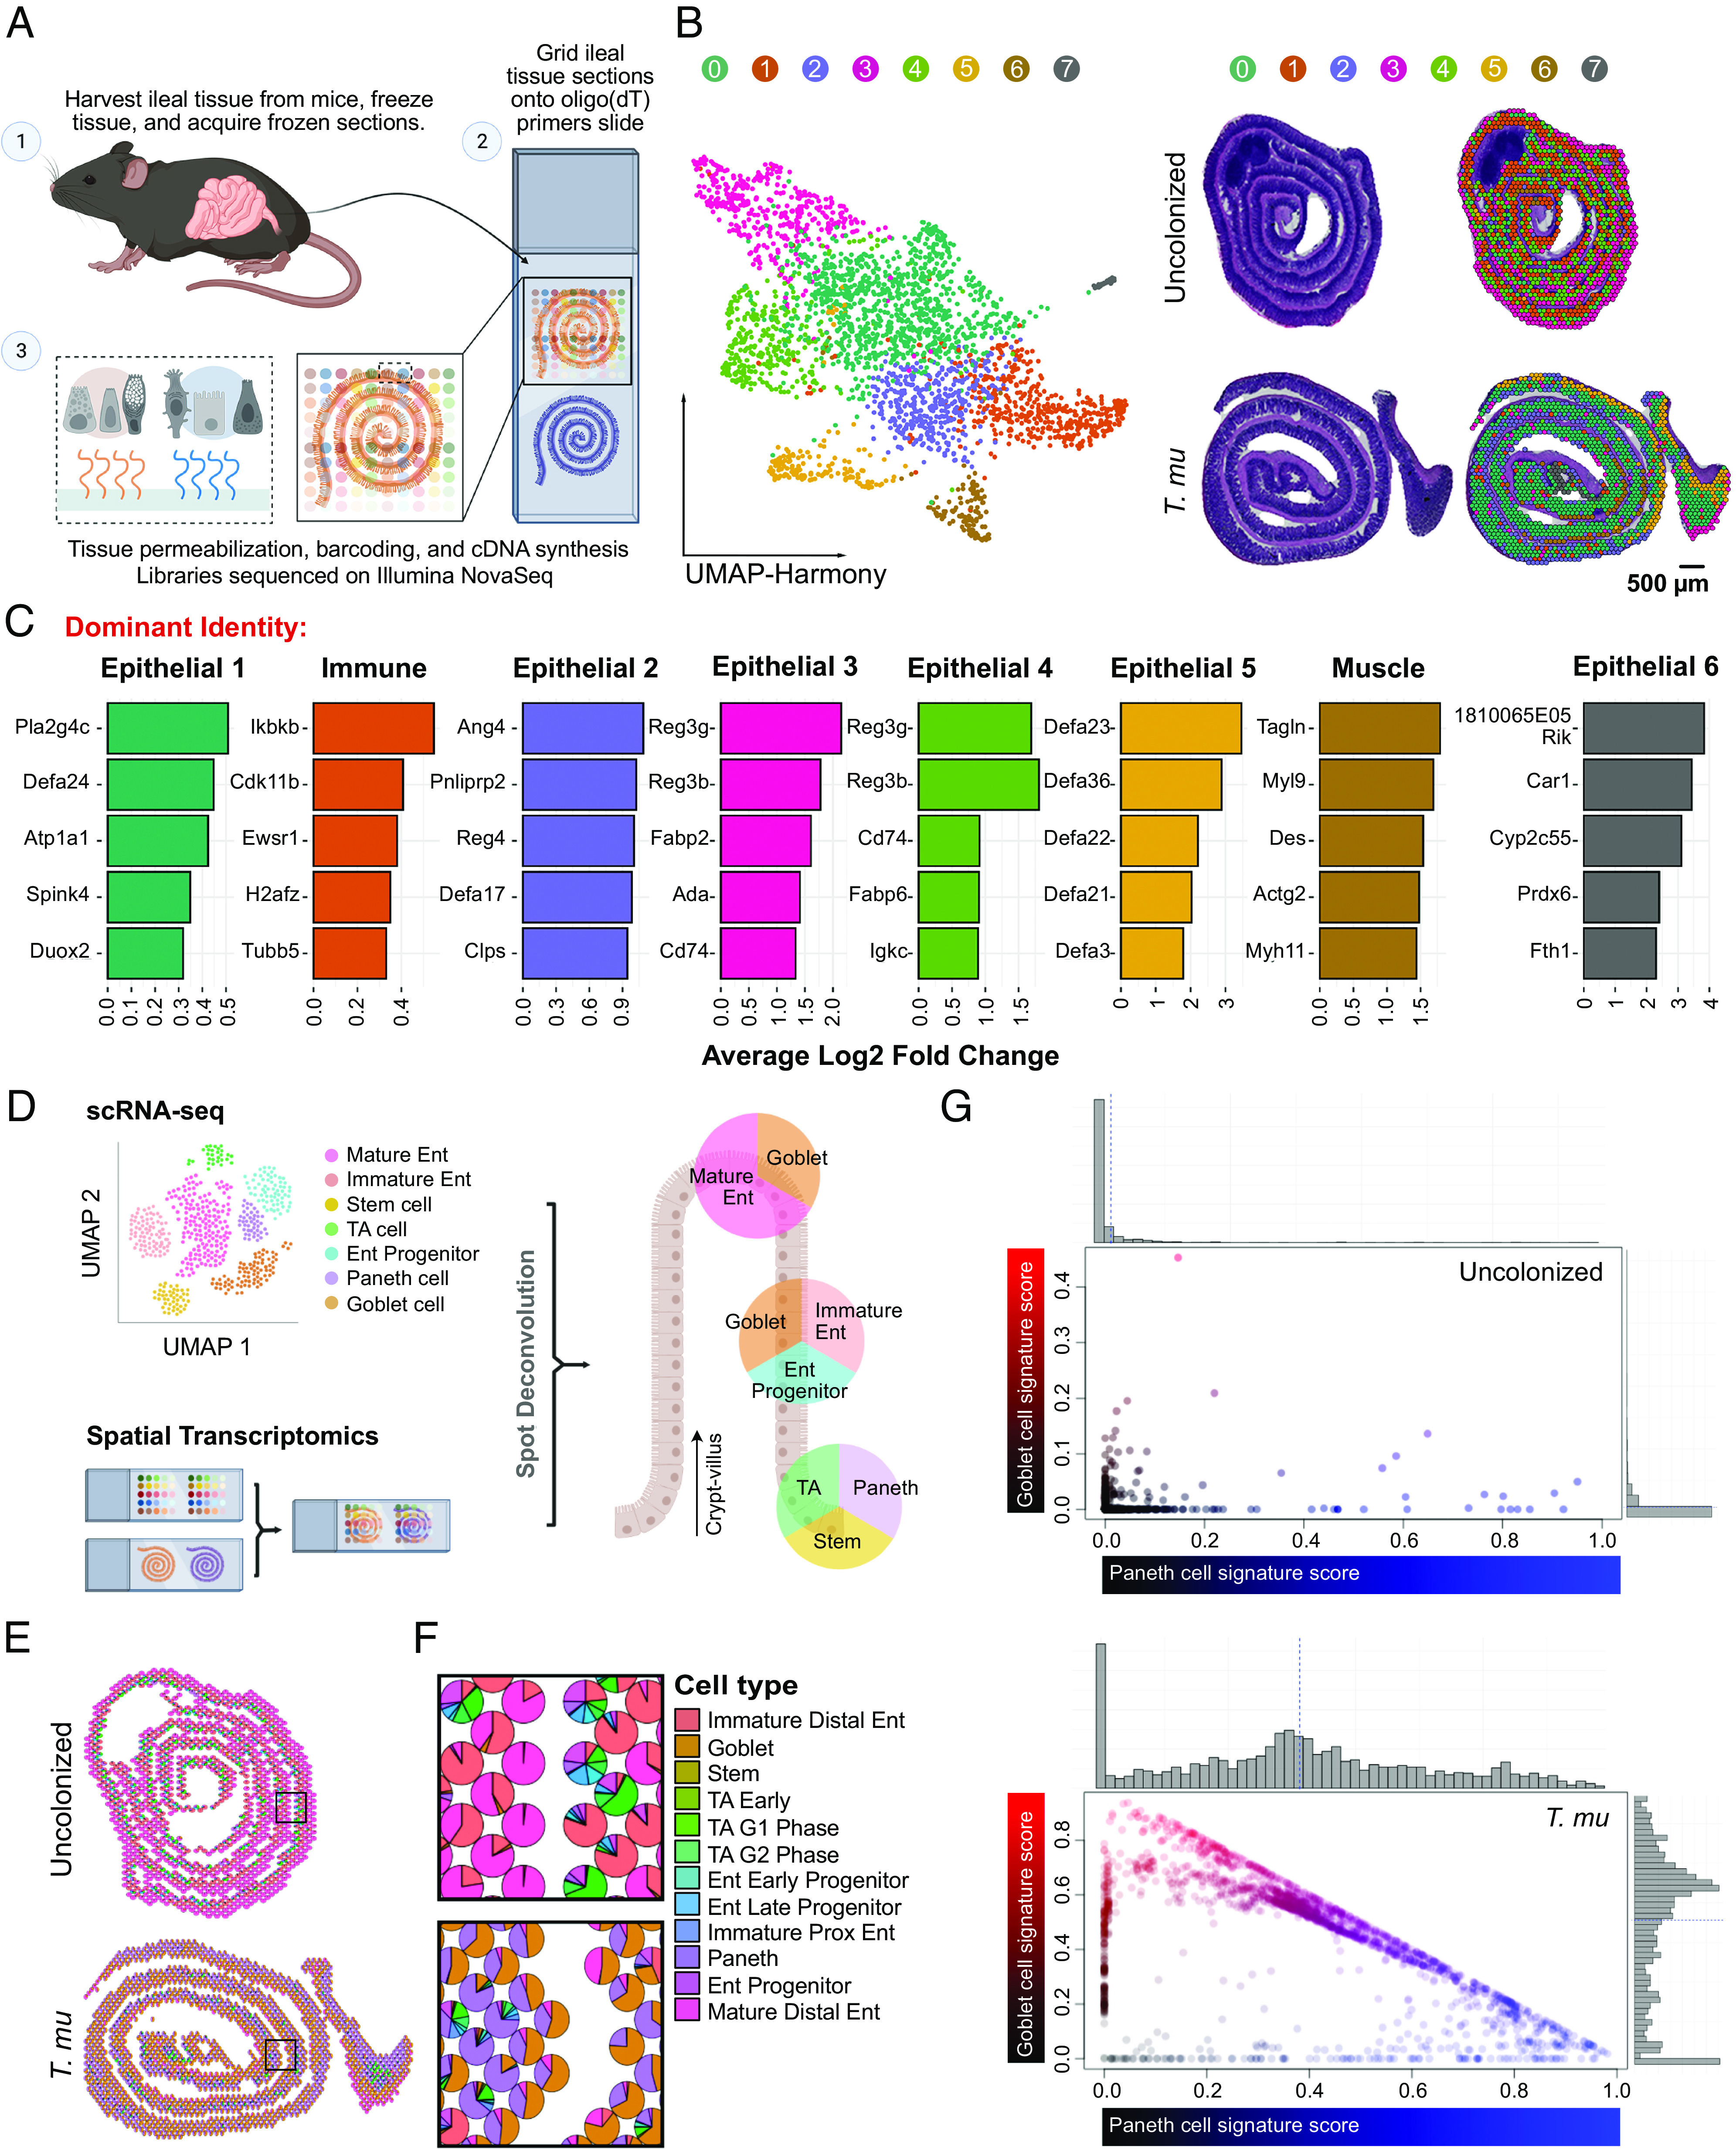
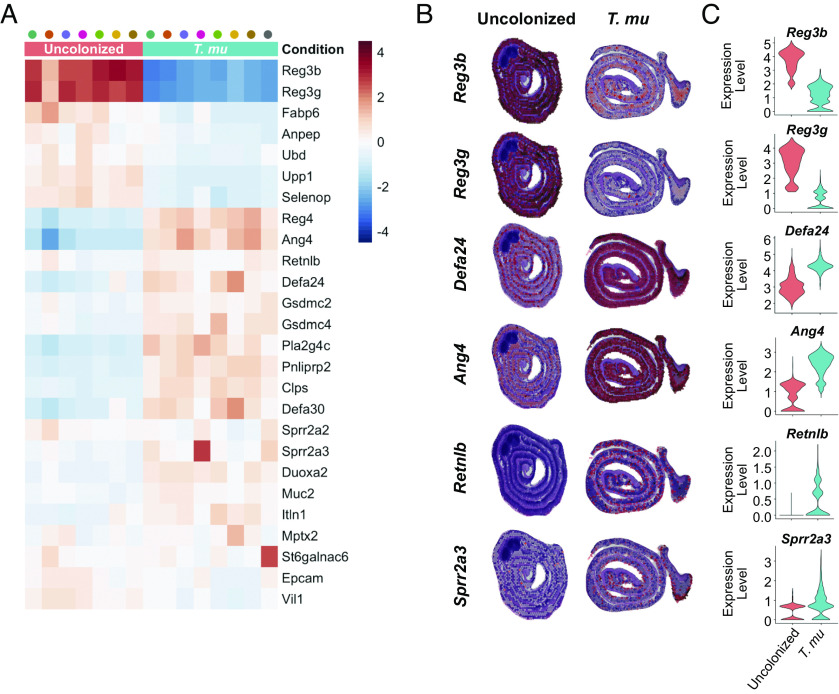
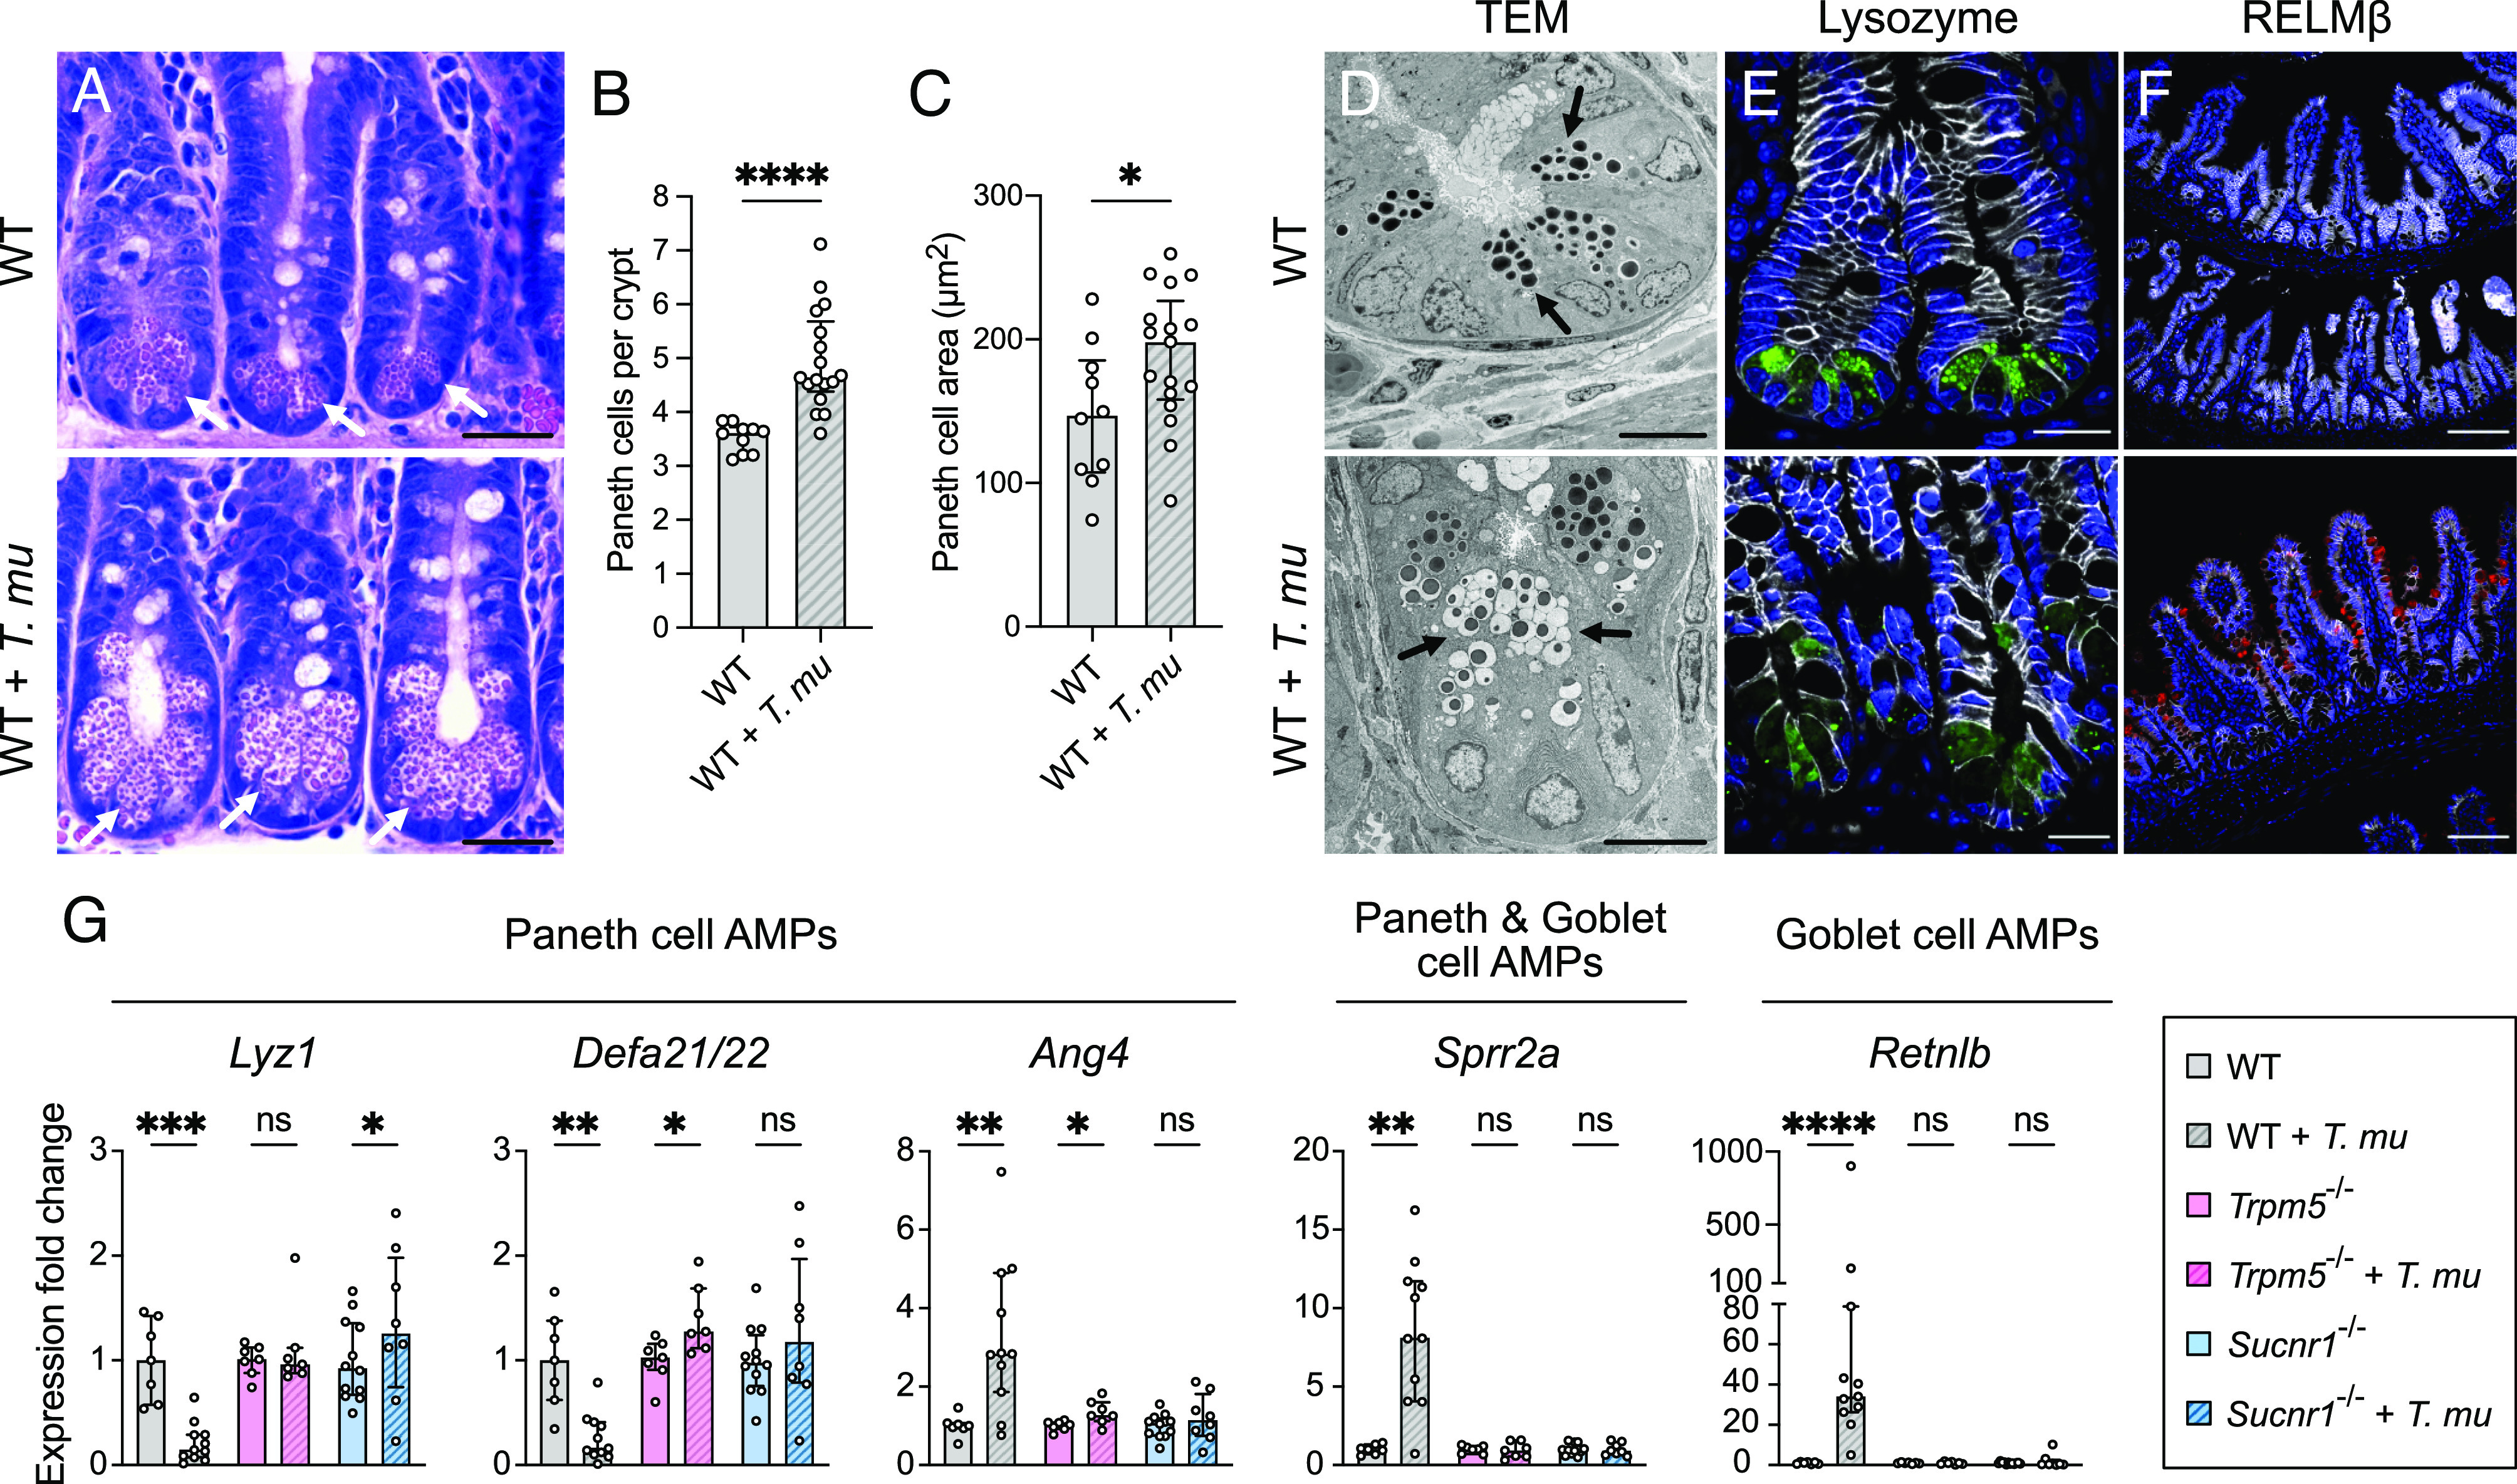
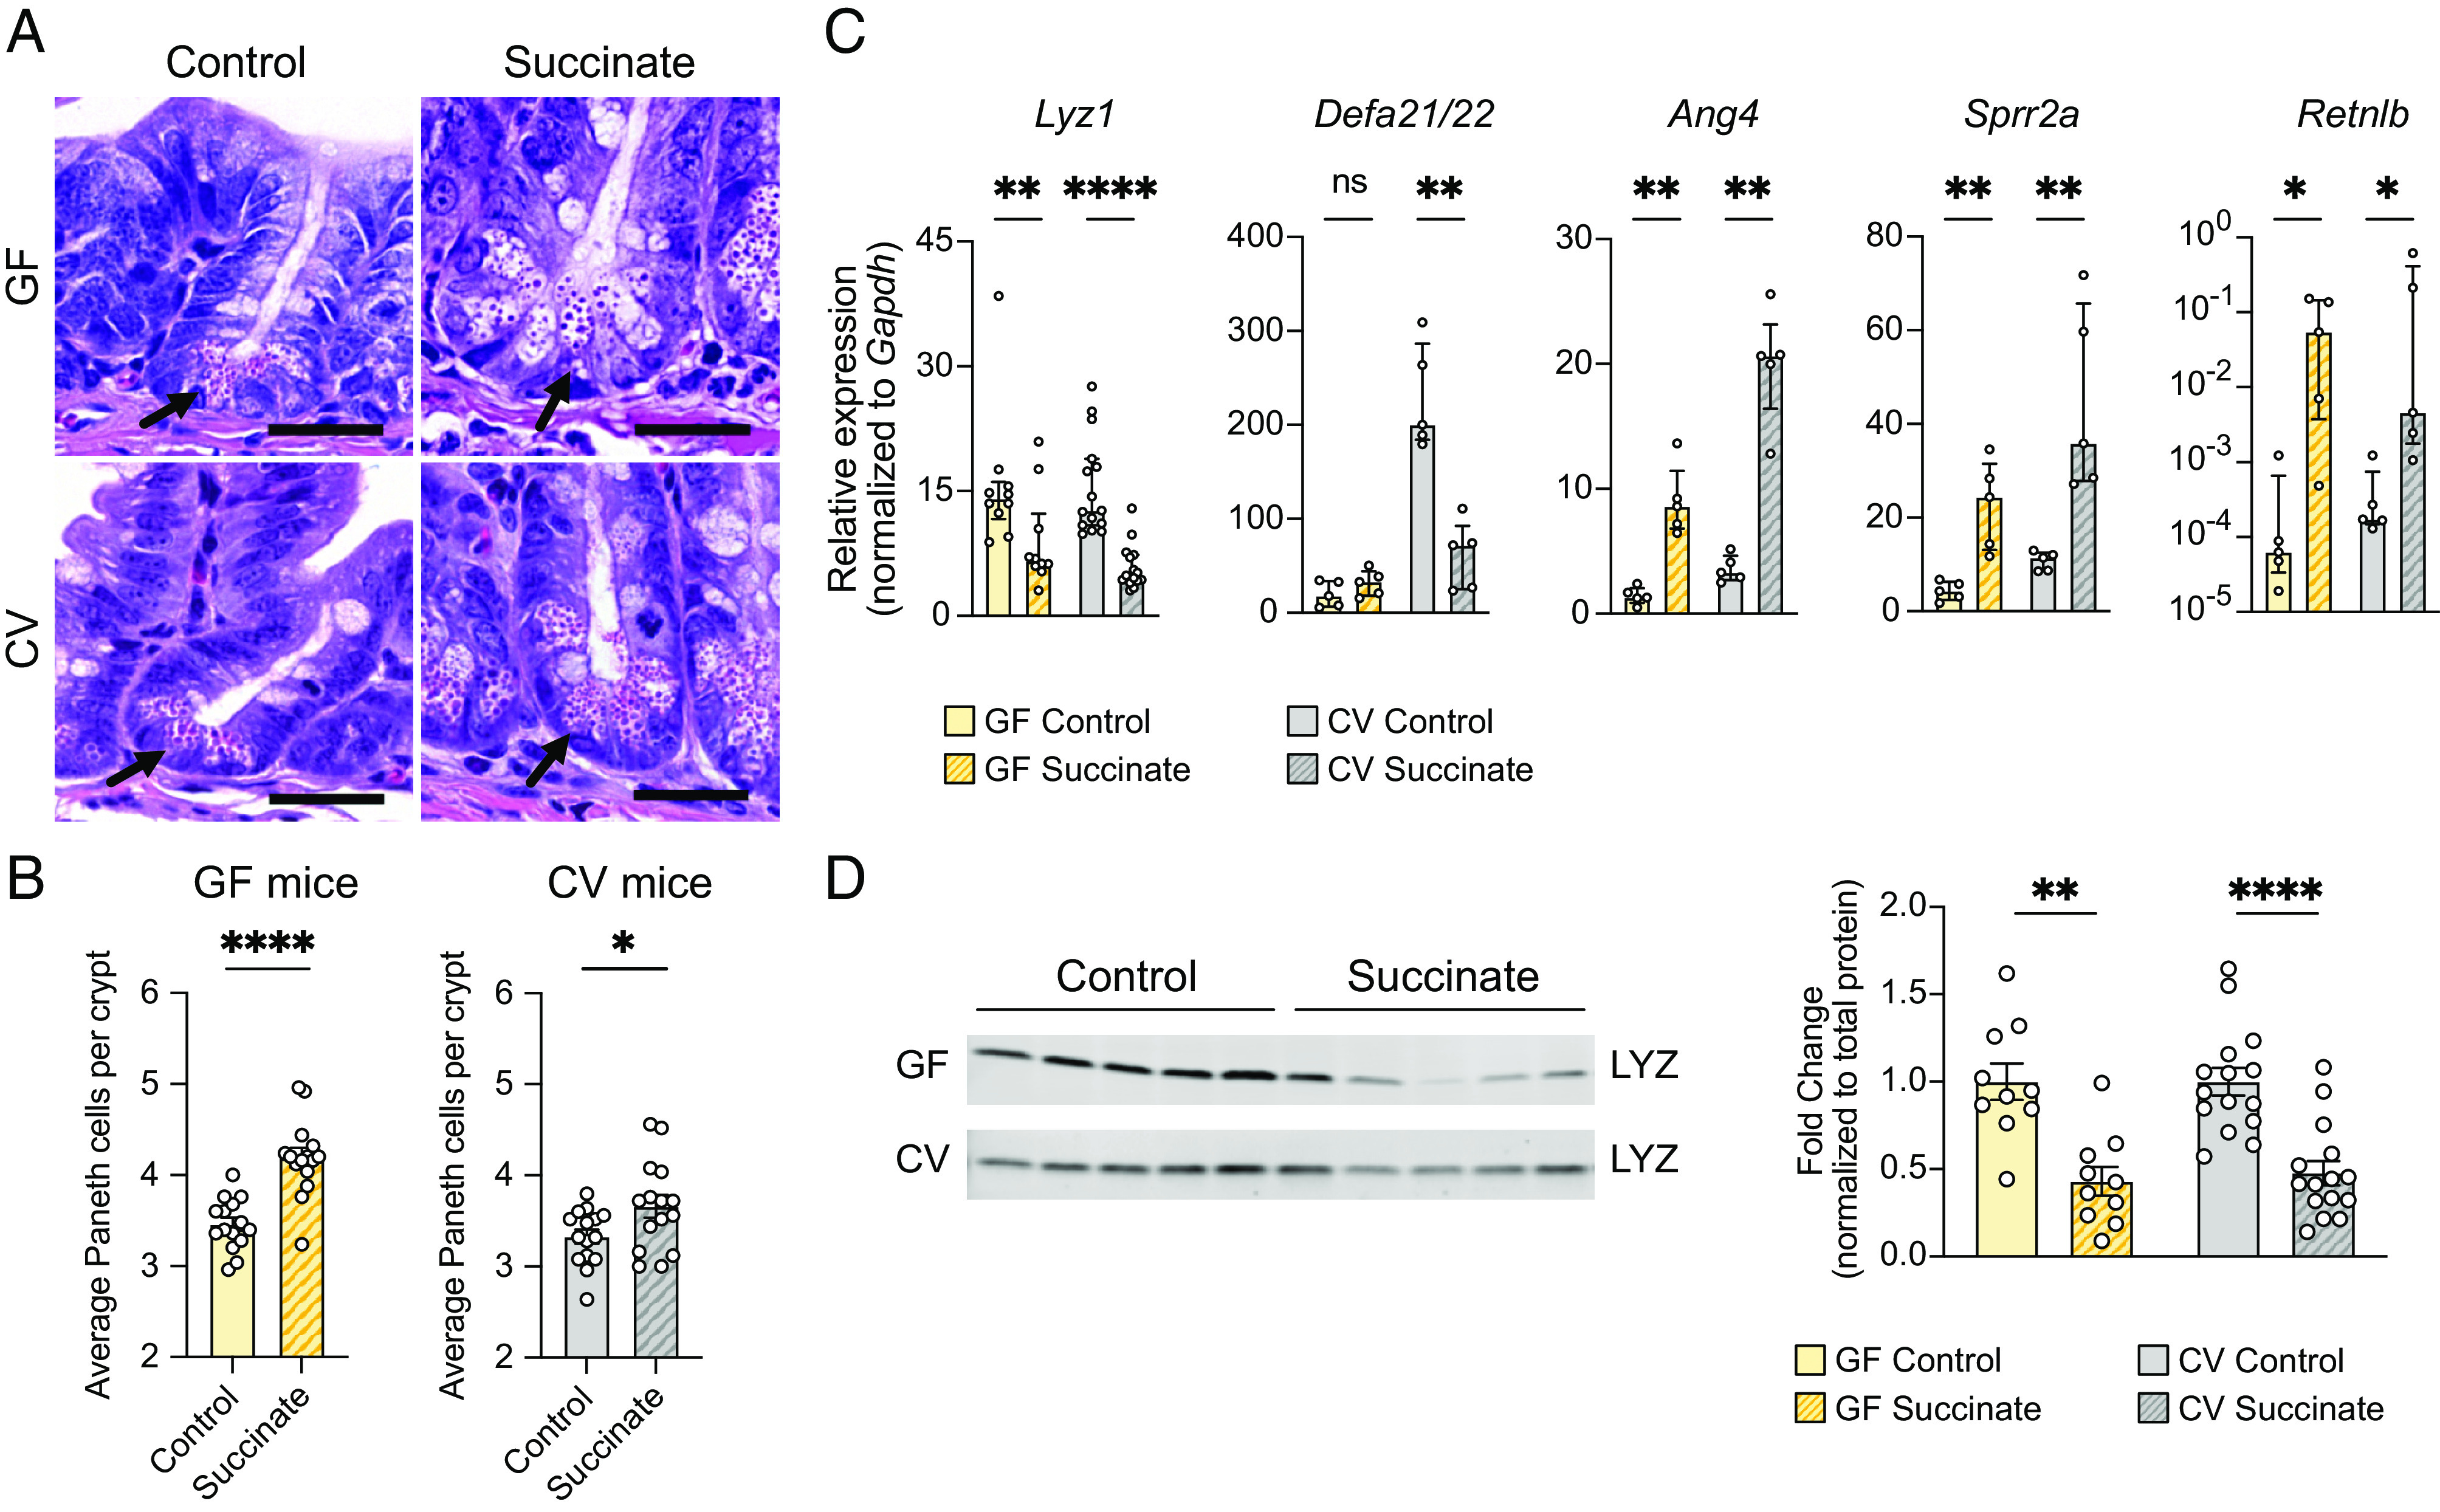
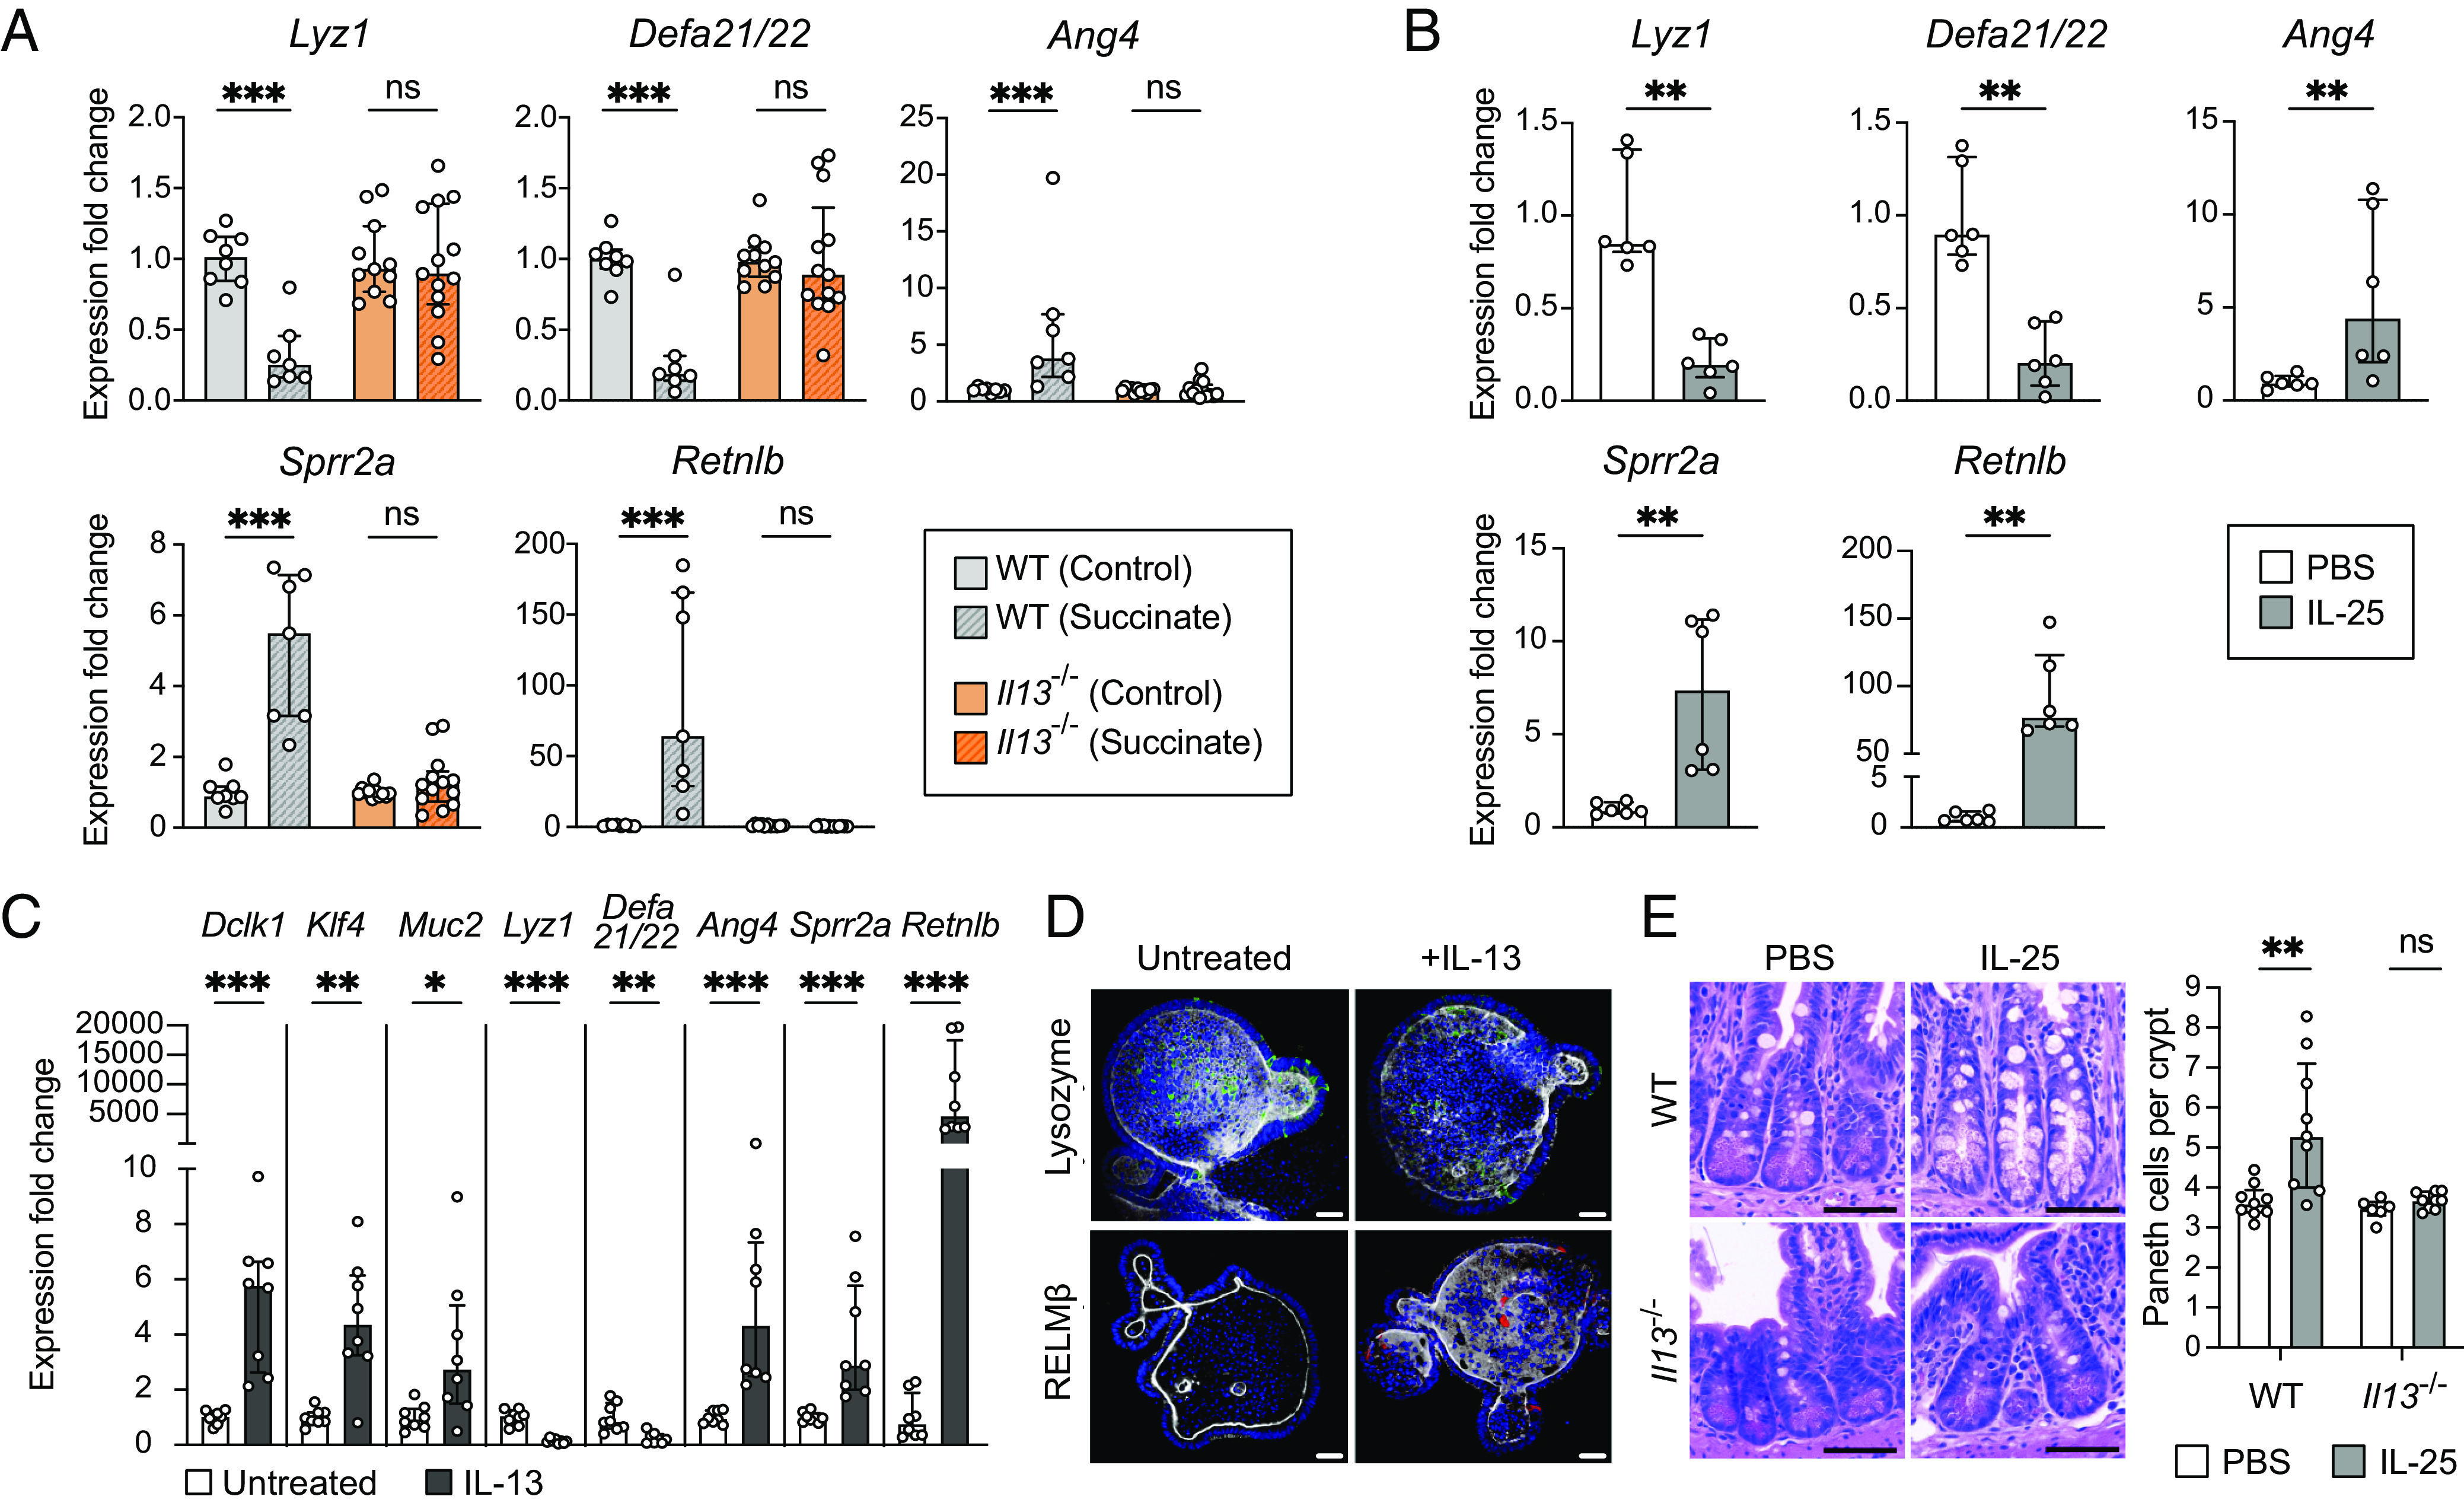
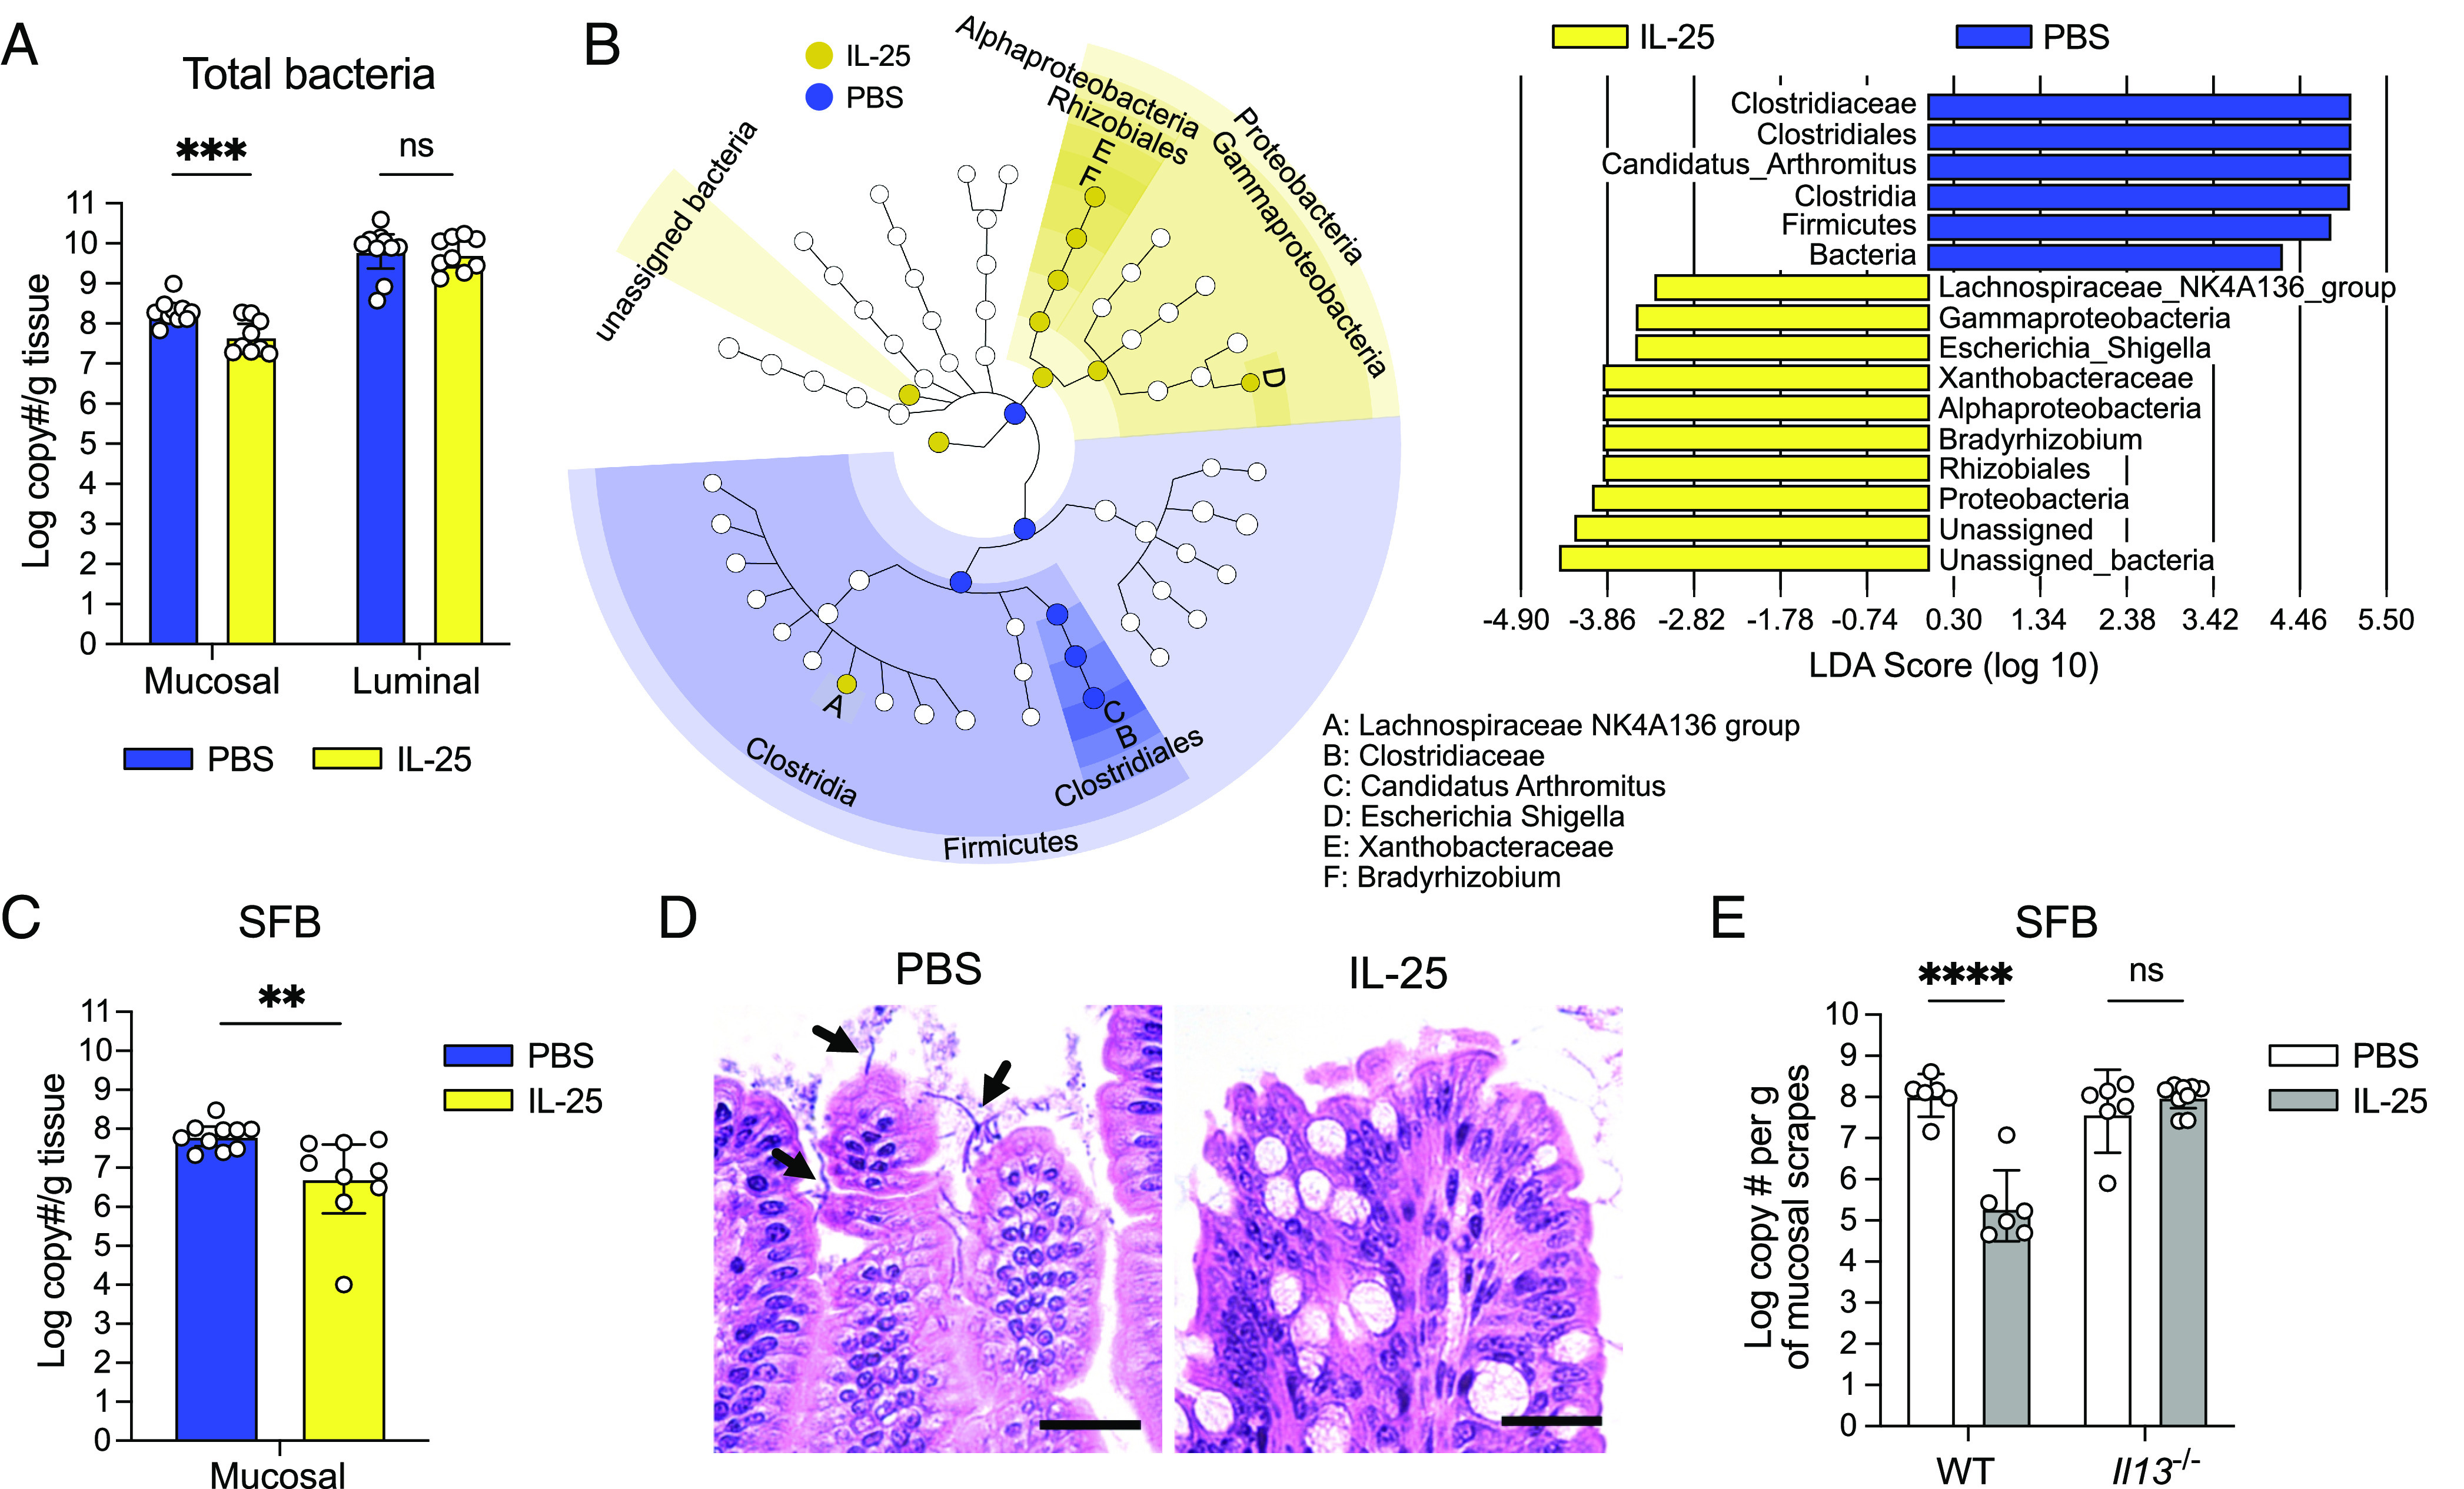
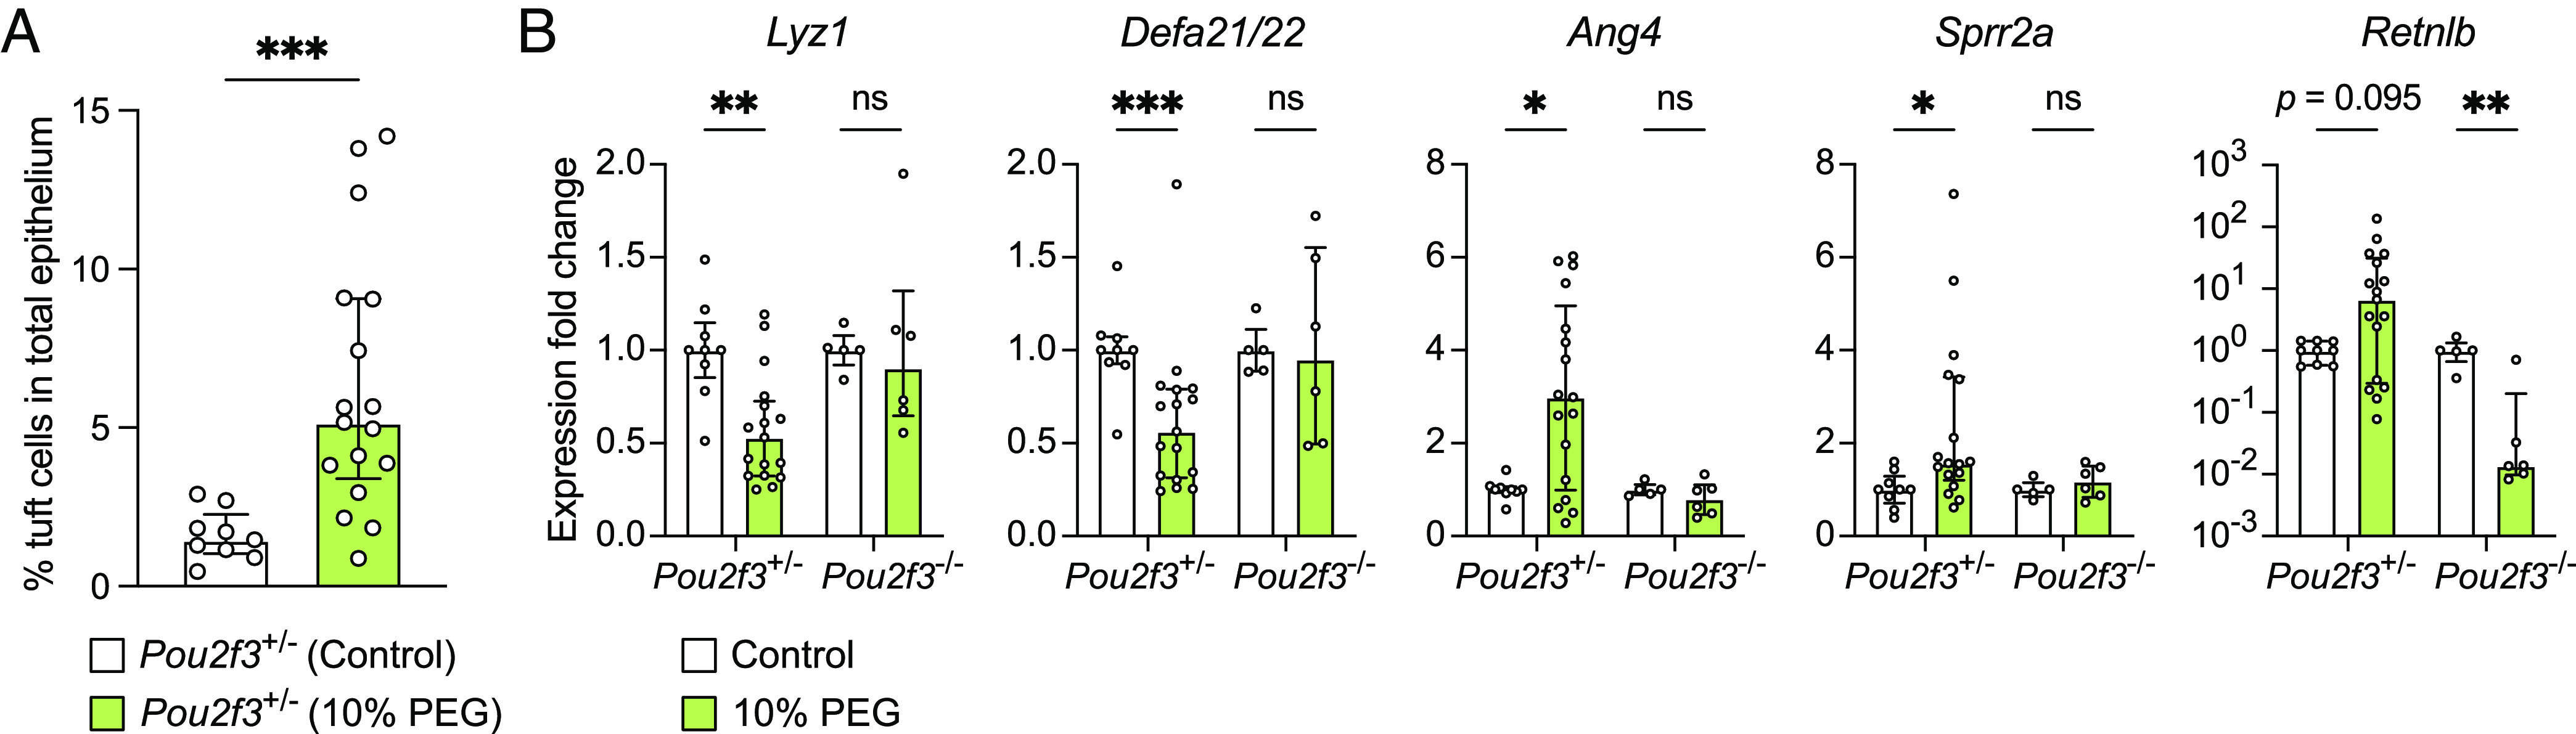
Succinate produced by the commensal protist Tritrichomonas musculis (T. mu) stimulates chemosensory tuft cells, resulting in intestinal type 2 immunity. Tuft cells express the succinate receptor SUCNR1, yet this receptor does not mediate antihelminth immunity nor alter protist colonization. Here, we report that microbial-derived succinate increases Paneth cell numbers and profoundly alters the antimicrobial peptide (AMP) landscape in the small intestine. Succinate was sufficient to drive this epithelial remodeling, but not in mice lacking tuft cell chemosensory components required to detect this metabolite. Tuft cells respond to succinate by stimulating type 2 immunity, leading to interleukin-13-mediated epithelial and AMP expression changes. Moreover, type 2 immunity decreases the total number of mucosa-associated bacteria and alters the small intestinal microbiota composition. Finally, tuft cells can detect short-term bacterial dysbiosis that leads to a spike in luminal succinate levels and modulate AMP production in response. These findings demonstrate that a single metabolite produced by commensals can markedly shift the intestinal AMP profile and suggest that tuft cells utilize SUCNR1 and succinate sensing to modulate bacterial homeostasis.

Keywords: Paneth cell; antimicrobial peptides; succinate; tuft cell; type 2 immunity.


Conflict of interest statement

The authors declare no competing interest.

Figures

Fig. 1.
Fig. 1.
ST analysis of the T. mu–colonized SI reveals goblet and Paneth cell expansion. (A) Schematic of the ST pipeline. (B) Harmonized UMAP plots of ST spots organized by cluster identity (Left); corresponding hematoxylin and eosin (H&E)-stained tissue scans with overlaid Seurat clustering (Right). (C) Top 5 highly expressed genes for each cluster shown by log 2-fold change compared to other clusters. Clusters annotated based on dominance of gene expression associated with epithelial, immune, or muscle cells. (D) Schematic of the Seurat anchoring method to integrate a single-cell RNA sequencing (scRNA-seq) small intestinal epithelial dataset (30) with the ST dataset. (E and F) Scatter pie plots of the ileum depicting predicted epithelial cellular identities (E), with the corresponding zoomed regions of interest (F). Ent, enterocyte; TA, transit-amplifying; G1, G1/S cell-cycle phase; G2, G2/M cell-cycle phase; Prox, proximal. (G) Visualization of goblet (red) and Paneth cell (blue) signature scores of ST spots colored by identity. Gray histograms on top and right show the distribution of spots along each axis.
Fig. 2.
Fig. 2.
T. mu colonization alters the small intestinal AMP repertoire. (A) Heatmap of AMP genes clustered by sample condition and ranked with the corresponding Z-score. Each column represents a cluster from the uncolonized (pink) or T. mu–colonized mouse (aqua). (B and C) Gene features overlay plots on ST spots throughout ileal tissue of the uncolonized or T. mu–colonized mouse (B), with corresponding violin plots depicting global gene expression (C).
Fig. 3.
Fig. 3.
T. mu induces goblet and Paneth cell hyperplasia and alters AMP production in the distal SI via tuft cell stimulation. (A) Representative images of H&E-stained sections of the ileal crypts from uncolonized or T. mu–colonized WT mice. White arrows indicate representative Paneth cells. (Scale bar: 25 µm.) (B) Average number of Paneth cells per crypt in the ilea of uncolonized and T. mu–colonized WT mice (n = 10 to 17 mice per group). (C) Average size of individual Paneth cells (µm2) in the ilea of uncolonized and T. mu–colonized WT mice (n = 10 to 17 mice per group). (D) Representative transmission electron microscopy images of the ileal crypts from uncolonized or T. mu–colonized WT mice. Black arrows indicate representative Paneth cell secretory granules. (Scale bar: 10 µm.) (E and F) Representative fluorescence microscopy images of the ilea from uncolonized or T. mu–colonized WT mice. Nuclei (blue), E-cadherin (white), LYZ (Paneth cell AMP) (green), RELMβ (goblet cell AMP) (red). (E) Scale bar: 20 µm. (F) Scale bar: 100 µm. (G) Expression of representative AMP genes determined by qRT-PCR in the ileal epithelial fraction from uncolonized or T. mu–colonized WT, Trpm5−/−, and Sucnr1−/− mice (n = 7 to 12 mice per group). Relative expression normalized to Gapdh. In panels B, C, and G, center values = median; error bars = interquartile range (IQR). Significance was determined using the Mann–Whitney U test. ns = no significance, *P < 0.05, **P < 0.01, ***P < 0.001, ****P < 0.0001.
Fig. 4.
Fig. 4.
Oral administration of succinate results in similar changes to small intestinal AMP production as T. mu colonization. (A) Representative images of H&E-stained sections of the ileal crypts from control or succinate-treated GF (top row) or CV mice (bottom row). (Scale bar: 25 µm.) (B) Average number of Paneth cells per crypt in the ilea of control or succinate-treated GF or CV WT mice (n = 15 mice per group). Center values = arithmetic mean; error bars = SEM. Significance was determined using Student’s t test. (C) Expression of representative AMP genes determined by qRT-PCR in the ilea of control or succinate-treated GF and CV mice (n = 5 to 15 mice per group). Relative expression normalized to Gapdh. Center values = median; error bars = IQR. Significance was determined using the Mann–Whitney U test. (D) Representative western blot images and quantitative analysis of intracellular LYZ levels in the ilea of control or succinate-treated GF and CV mice. Each band or symbol represents an individual mouse. LYZ levels normalized to REVERT total protein stain (SI Appendix, Fig. S5F) (n = 10 to 15 mice per group). Center values = arithmetic mean; error bars = SEM. A linear mixed model was used to determine significance. ns = no significance, *P < 0.05, **P < 0.01, ****P < 0.0001.
Fig. 5.
Fig. 5.
The type 2 cytokine IL-13 is critical for small intestinal Paneth cell hyperplasia and changes to AMP expression downstream of tuft cell stimulation. (A) Expression of representative AMP genes determined by qRT-PCR in the ileal epithelial fraction of control or succinate-treated WT and Il13−/− mice (n = 7 to 13 mice per group). (B) Expression of representative AMP genes determined by qRT-PCR in the ileal epithelial fraction of WT mice IP-injected with phosphate-buffered saline (PBS) or IL-25 (n = 6 mice per group). (C) Expression of Dclk1 (tuft cell marker), Klf4 and Muc2 (goblet cell markers), and representative AMP genes determined by qRT-PCR in untreated or IL-13-treated ileal organoids (n = 8 samples per group). (D) Representative fluorescence microscopy images of untreated or IL-13-treated ileal organoids. Nuclei (blue), F-actin (white), LYZ (green), RELMβ (red). (Scale bar: 30 µm.) (E) Left: Representative images of H&E-stained sections of the ileal crypts from PBS- or IL-25-injected WT or Il13−/− mice. (Scale bar: 50 µm.) Right: Average number of Paneth cells per crypt in the ilea of PBS- or IL-25-injected WT or Il13−/− mice (n = 6 to 9 mice per group). For qRT-PCR data, relative expression normalized to Gapdh. For all panels, center values = median; error bars = IQR. Significance was determined using the Mann–Whitney U test. ns = no significance, *P < 0.05, **P < 0.01, ***P < 0.001.
Fig. 6.
Fig. 6.
Type 2 immune induction depletes mucosa-associated bacteria in the SI. (A) Absolute quantification of total bacterial 16S rRNA gene copies in the ileal mucosal and luminal fractions of PBS- or IL-25-injected mice (n = 9 to 10 mice per group). (B) Linear discriminant analysis (LDA) Effect Size (LEfSe) analysis using a LDA threshold score of 2 to identify ileal mucosa-associated bacterial taxa in PBS- or IL-25-injected mice. The cladogram (Left) highlights taxonomic relatedness of bacteria, while the LDA plot (Right) is an ordered list of enriched bacteria. (C) Absolute quantification of SFB 16S rRNA gene copies in the ileal mucosal fractions of PBS- or IL-25-injected mice (n = 9 to 10 mice per group). (D) Representative images of Carnoy’s-fixed, H&E-stained sections of ileal villi from PBS- or IL-25-injected mice showing SFB (black arrows). (Scale bar: 25 µm.) (E) Absolute quantification of SFB 16S rRNA gene copies in the ileal mucosal fractions of PBS- or IL-25-injected WT and Il13−/− mice (n = 6 to 9 mice per group). In Panels A, C, and E, center values = geometric mean; error bars = 95% CI. Significance was determined using a generalized linear model. ns = no significance, **P < 0.01, ***P < 0.001, ****P < 0.0001.
Fig. 7.
Fig. 7.
Tuft cells are required to induce AMP expression changes in response to bacterial dysbiosis in the distal SI. (A) Ileal tuft cell frequency in control or PEG-treated (12 d) Pou2f3+/− mice as determined by flow cytometry (n = 9 to 17 mice per group). (B) Expression of representative AMP genes determined by qRT-PCR in the ileal epithelial fraction of control or PEG-treated Pou2f3+/− and Pou2f3−/− mice (n = 5 to 17 mice per group). Relative expression normalized to Gapdh. Center values = median; error bars = IQR. Significance was determined using the Mann–Whitney U test. ns = no significance, *P < 0.05, **P < 0.01, ***P < 0.001.

References

    1. Sekirov I., Russell S. L., Antunes L. C. M., Finlay B. B., Gut microbiota in health and disease. Physiol. Rev. 90, 859–904 (2010). - PubMed
    1. de Vos W. M., Tilg H., Van Hul M., Cani P. D., Gut microbiome and health: Mechanistic insights. Gut 71, 1020–1032 (2022). - PMC - PubMed
    1. Johansson M. E. V., Hansson G. C., Immunological aspects of intestinal mucus and mucins. Nat. Rev. Immunol. 16, 639–649 (2016). - PMC - PubMed
    1. Meyer-Hoffert U., et al. , Secreted enteric antimicrobial activity localises to the mucus surface layer. Gut 57, 764–771 (2008). - PubMed
    1. Vaishnava S., et al. , The antibacterial lectin RegIIIγ promotes the spatial segregation of microbiota and host in the intestine. Science 334, 255–258 (2011). - PMC - PubMed

Publication types

LinkOut - more resources