. 2023 Aug 3;11(8):1068-1084.
doi: 10.1158/2326-6066.CIR-22-0565.

Immunogenetic Metabolomics Reveals Key Enzymes That Modulate CAR T-cell Metabolism and Function

Affiliations

Immunogenetic Metabolomics Reveals Key Enzymes That Modulate CAR T-cell Metabolism and Function

Paul Renauer et al. Cancer Immunol Res. .

Abstract

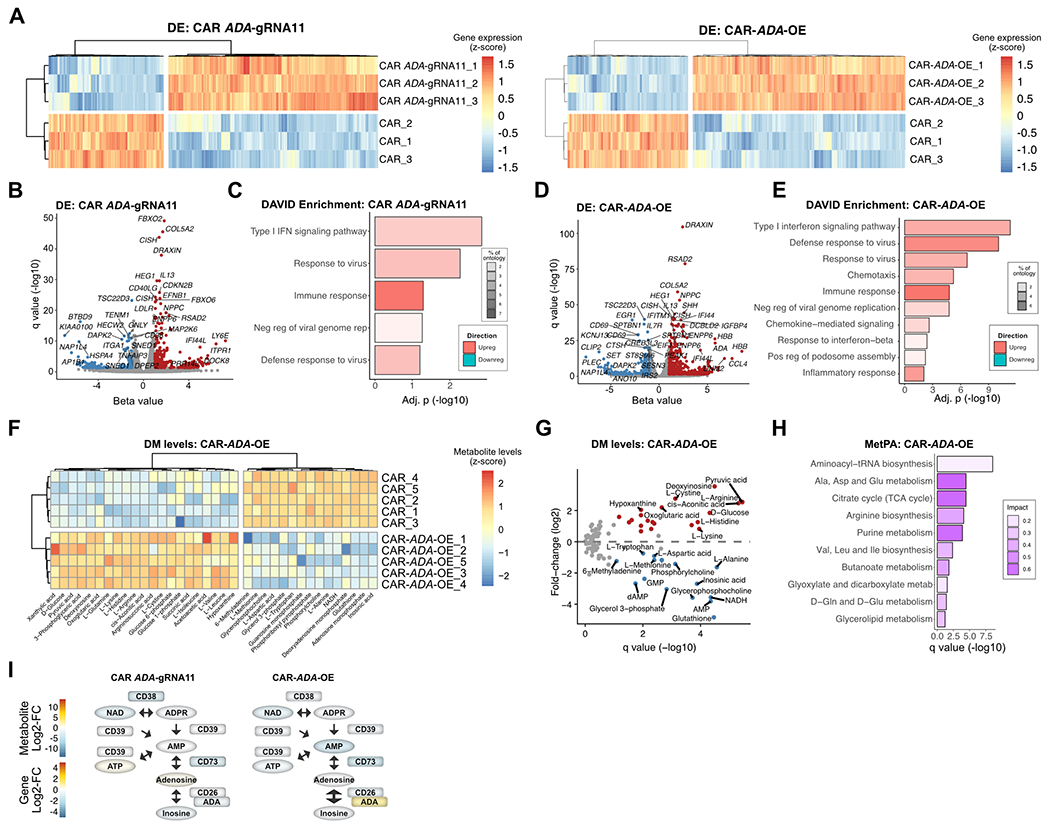
Immune evasion is a critical step of cancer progression that remains a major obstacle for current T cell-based immunotherapies. Hence, we investigated whether it is possible to genetically reprogram T cells to exploit a common tumor-intrinsic evasion mechanism whereby cancer cells suppress T-cell function by generating a metabolically unfavorable tumor microenvironment (TME). In an in silico screen, we identified ADA and PDK1 as metabolic regulators. We then showed that overexpression (OE) of these genes enhanced the cytolysis of CD19-specific chimeric antigen receptor (CAR) T cells against cognate leukemia cells, and conversely, ADA or PDK1 deficiency dampened this effect. ADA-OE in CAR T cells improved cancer cytolysis under high concentrations of adenosine, the ADA substrate, and an immunosuppressive metabolite in the TME. High-throughput transcriptomics and metabolomics analysis of these CAR T cells revealed alterations of global gene expression and metabolic signatures in both ADA- and PDK1-engineered CAR T cells. Functional and immunologic analyses demonstrated that ADA-OE increased proliferation and decreased exhaustion in CD19-specific and HER2-specific CAR T cells. ADA-OE improved tumor infiltration and clearance by HER2-specific CAR T cells in an in vivo colorectal cancer model. Collectively, these data unveil systematic knowledge of metabolic reprogramming directly in CAR T cells and reveal potential targets for improving CAR T-cell therapy.


Figures

Fig. 1:
Fig. 1:. In silico screen and mRNA-seq reveal ADA and PDK1 as metabolic reprogramming genes that induce immune response–related transcriptomic changes in primary human CD8+ T cells.
A, Flowchart of the multitier selection for identifying candidate genes that modulate T-cell metabolism. B, Schematic of mutant T-cell and CAR T-cell generation, multi-omics profiling and functional analyses. C-D, Quantification of CRISPR-mediated indel formation to ADA and PDK1 genes via Welch’s t test. Sample sequences and indel statistics are displayed in C and D, respectively. Plots are shown with the error (+/− SD) around the mean (bar). E, Heatmap of significant differentially expressed (DE) transcripts in ADA-gRNA11 or PDK1-gRNA13 T cells. F-G, Volcano plots of differentially expressed (DE) genes in (F) ADA-gRNA11 and (G) PDK1-gRNA13 T cells. Expression fold-changes and significance are represented by the Wald test beta-value and q value, respectively. H-I, Waterfall plots of pathway analyses of DE genes in (H) ADA-gRNA11 and (I) PDK1-gRNA13 T cells. Pathway enrichment was assessed separately for up- and down-regulated genes, but results are shown together. DE genes had a beta-change > 1 and q < 0.05. Indel quantification and differential gene expression were analyzed in 1 experiment with 3 biological replicates per condition.
Fig. 2:
Fig. 2:. Metabolic reprogramming in ADA and PDK1 mutant primary human CD8+ T cells.
A-B, Heatmaps of differential metabolite levels in (A) ADA and (B) PDK1 T-cell mutants, depicted with the z-score of log2 fold-changes. C-D, Waterfall plots of metabolic pathway analyses (MetPA) in (C) ADA and (D) PDK1 T-cell mutants. Bar color, size and opacity represent pathway significance and impact scores, which summarize the metabolite fold-changes of each pathway. In the knockout mutants, MetPA was performed using metabolomics and gene expression data. E-F, Flow cytometric analyses of functional markers in ADA and PDK1 T-cell mutants via Welch’s t test. Histograms are provided for (E) cytotoxicity and (F) exhaustion markers. Metabolomics and flow cytometry data were analyzed with 1 experimental replicate and n >= 3 biological replicates per condition.
Fig. 3:
Fig. 3:. Overexpression of ADA or PDK1 in primary human CD8+ CD19-specific CAR T cells enhances cytotoxicity.
A, Schematic maps of the CD19-specific CAR, CAR-ADA-OE, and CAR-PDK1-OE lentiviral vectors. B, Flow cytometry dot plots of CD19-specific CAR protein expression in CAR T-cell populations from a representative sample. C-E, CRISPR-mediated perturbations to ADA and PDK1 gene loci in CAR T-cell populations. Indel formation and protein expression were assessed by (C-D) Nextera DNA sequencing and (E) Immunoblot, respectively via Welch’s t test. F-G, Bar plots and line plots of co-culture cytotoxicity assay results for different CAR T-cell populations. Cytotoxicity was quantified as NALM6-GL cancer cell survival in co-culture assays with CAR T cells at different effector-target ratios (E:T). NALM6-GL levels were quantified by luciferase bioluminescence, relative to no treatment. Dunnett’s two-way ANOVA test results are shown for (F) ADA/PDK1 vs control CAR T cells (3 experiments, n = 5 replicates / condition), and the (G) ADA vs control CAR T cells in 30 nM and 120 nM adenosine (2 experiments, n = 3-4 replicates / condition). All statistics plots are shown with the error (+/− SD) around the mean (bar/line).
Fig. 4:
Fig. 4:. Multi-omics profiling and phenotypic characterization of ADA mutant primary human CD8+ CAR T cells.
A, Heatmaps of significant differentially expressed (DE) transcripts in ADA-gRNA11 and ADA-OE CAR-T-cell mutants. B, D, Volcano plots of DE analyses in (B) ADA-gRNA11 and (D) ADA-OE CAR T cells. Expression fold-changes and significance are represented by the beta-value and q value, respectively. C, E, Waterfall plots of pathway analyses of DE genes in (C) ADA-gRNA11 and (E) ADA-OE CAR T cells. Enrichment was assessed separately for up- and downregulated genes, but results are shown together. F, Heatmap of significant differential metabolite (DM) levels in ADA-OE CAR-T cell mutants. G, Volcano plot of differential metabolite levels in ADA-OE CAR T-cell mutants via Welch’s t tests. Labels are given to genes/metabolites with the highest significance and fold-changes, for which significant increases and decreases are shown in red and blue, respectively. H, Waterfall plot of integrated transcriptomic-metabolomic MetPA in ADA-OE CAR T cells. Bar color, size and opacity represent pathway significance and impact scores, which summarizes metabolite fold-changes of each pathway. I, Partial pathway map of extracellular adenosine metabolism in ADA CAR T-cell mutants. Log2-fold-changes of normalized metabolites and enzyme genes are depicted by ovals and rectangles, respectively (heatmap color-scale). Multi-gene enzyme levels are presented as log2-fold-changes of the sum of normalized gene counts. Metabolomics and transcriptomics included 1 experiment of n = 5 and n = 3 biological replicates, respectively, for each condition.
Fig. 5:
Fig. 5:. Multi-omics profiling and phenotypic characterization of PDK1 mutant primary human CAR T cells.
A, Heatmaps of significant differentially expressed (DE) transcripts in PDK1-gRNA13 and PDK1-OE CAR T-cell mutants. B, Volcano plot of DE analyses in PDK1-OE CAR T cells via Wald test. Expression fold-changes and significance are represented by the beta-value and q value, respectively. Labels are given to genes/metabolites with the highest significance and fold-changes, for which significant increases and decreases are shown in red and blue, respectively. C, Waterfall plots of pathway analyses of DE genes in PDK1-OE CAR T cells. Bar color, size and opacity represent pathway significance and impact scores, which summarizes metabolite fold-changes of each pathway. D, Heatmaps of differential metabolite (DM) levels in PDK1-gRNA13 and PDK1-OE CAR T cells. E, Volcano plot of DM levels in PDK1-gRNA13 and PDK1-OE CAR T cells, assessed via Welch’s t test. F, Waterfall plots of integrated transcriptomic-metabolomic MetPA in PDK1-gRNA13 and PDK1-OE CAR T cells. Bar color, size and opacity represent pathway significance and impact scores, which summarizes metabolite fold-changes of each pathway. G, Partial pathway maps of the TCA cycle in PDK1-gRNA13 and PDK1-OE CAR T cell mutants. Log2 fold-changes of metabolite and gene levels are depicted by ovals and rectangles, respectively (heatmap color-scale). Multi-gene enzyme levels were calculated as the log2-fold-changes of the sum of normalized gene counts. Metabolomics and transcriptomics data included 1 experiment with n = 5 and n = 3 samples per condition, respectively.
Fig. 6:
Fig. 6:. Phenotypic profiling of ADA-OE primary human CD8+ CAR T cells.
A-B, Flow cytometric analyses for effector molecule production and NALM6-GL cytolysis in ADA-OE vs control CAR T cells at 0, 2, and 4 days post-stimulation in a co-culture assay. Cancer cell lysis was measured as GFP+ cell numbers or percent of live lymphocytes. C, Proliferation assay of stimulated CAR T cells, measured as the dissipation of Cell Trace Violet dye across cell divisions (modeled by FlowJo software). Proliferation is compared at 0 vs any divisions and across each number of divisions. D-F, Flow cytometry analyses of markers for memory, exhaustion, and downstream targets of A2AR-PKA signaling. G, Schematic of A2AR-PKA signaling pathway. All experiments included >= 4 biological replicates per condition with >= 2 independent experiments. A-C used Sidak’s two-way ANOVAs, and D-F use Welch’s t tests. When indicated, CAR-T cells were stimulated with NALM6-GL at a 1:2 E:T ratio. All statistics plots are shown with the error (+/− SD) around the mean (bar/line).
Fig. 7:
Fig. 7:. ADA-OE enhances HER2-specific primary human CD3+ CAR T-cell function in an in vivo colorectal cancer model.
A, Schematic maps of the ADA-OE and control HER2-specific CAR lentiviral vector constructs. B, Tumor growth curves of ADA-OE and control HER2-specific CAR-T treatments in an in vivo HT29-GL tumor model. The left panel is shown with summary curves for each treatment, assessed by Tukey’s two-way ANOVA, while the right panels show spider plot curves of the individual growth curves, separately graphed by treatment group. C, Flow cytometry analyses of the percentages of tumor infiltrating ADA-OE vs control α-HER2 CAR-T cells. Tumor infiltration percentage is relative to live, single cells. D-E, Flow cytometry analyses of ADA-OE vs control CAR-T (D) proliferation (KI-67) and (E) memory phenotypes in CD4 or CD8 CAR-T cells. Flow cytometry statistics were performed via Welch’s t test. Tumor growth and flow cytometry experiments included >= 4 mice per treatment with 2 independent experiments. All statistics plots are shown with the error (+/− SD) around the mean (bar/line).

Update of

References

    1. Spranger S, Spaapen RM, Zha Y, Williams J, Meng Y, Ha TT, et al. Up-regulation of PD-L1, IDO, and T(regs) in the melanoma tumor microenvironment is driven by CD8(+) T cells. Science Translational Medicine 2013;5(200):200ra116. - PMC - PubMed
    1. Vaupel P, Multhoff G. Accomplices of the Hypoxic Tumor Microenvironment Compromising Antitumor Immunity: Adenosine, Lactate, Acidosis, Vascular Endothelial Growth Factor, Potassium Ions, and Phosphatidylserine. Frontiers in Immunology 2017;8. - PMC - PubMed
    1. McKinney EF, Smith KGC. Metabolic exhaustion in infection, cancer and autoimmunity. Nature Immunology 2018;19(3):213–21. - PubMed
    1. Brentjens RJ, Davila ML, Riviere I, Park J, Wang X, Cowell LG, et al. CD19-Targeted T Cells Rapidly Induce Molecular Remissions in Adults with Chemotherapy-Refractory Acute Lymphoblastic Leukemia. Science Translational Medicine 2013;5(177):177ra38–ra38. - PMC - PubMed
    1. Porter DL, Levine BL, Kalos M, Bagg A, June CH. Chimeric Antigen Receptor-Modified T Cells in Chronic Lymphoid Leukemia. New England Journal of Medicine 2011;365(8):725–33. - PMC - PubMed

Publication types