. 2023 May 31;14(1):3148.
doi: 10.1038/s41467-023-37897-9.

Learning perturbation-inducible cell states from observability analysis of transcriptome dynamics

Affiliations

Learning perturbation-inducible cell states from observability analysis of transcriptome dynamics

Aqib Hasnain et al. Nat Commun. .

Erratum in

Abstract

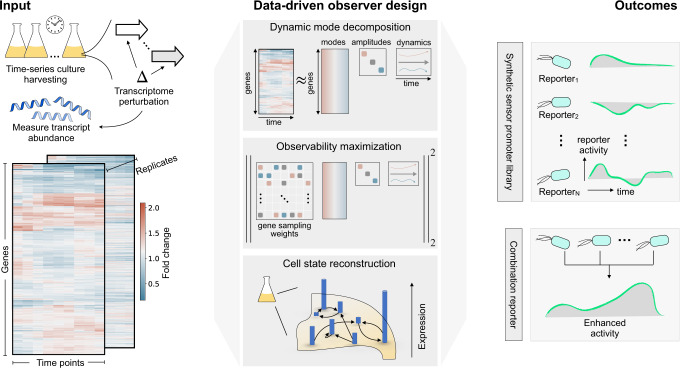
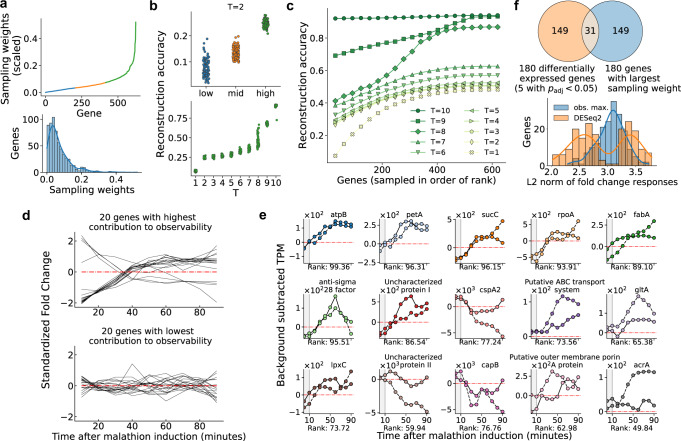
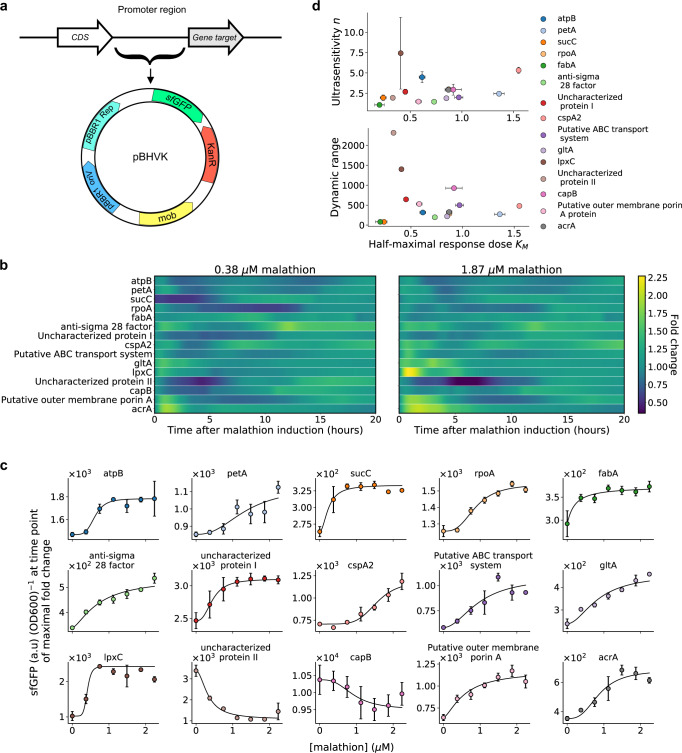
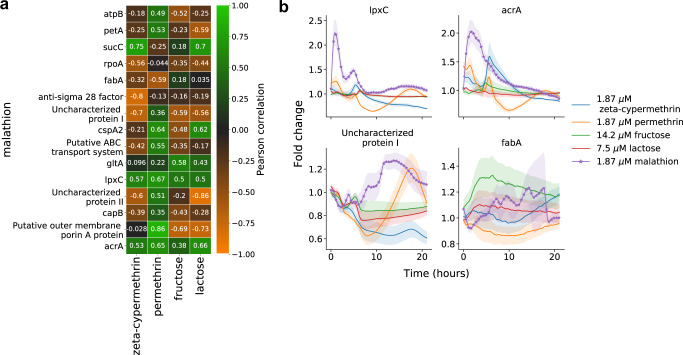
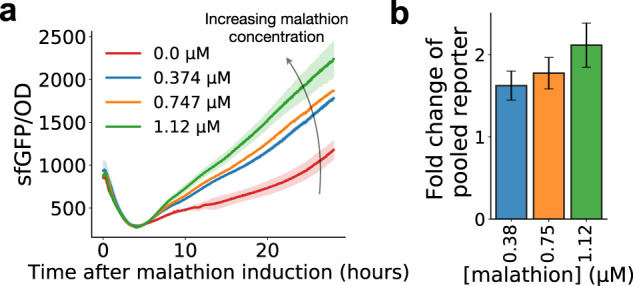
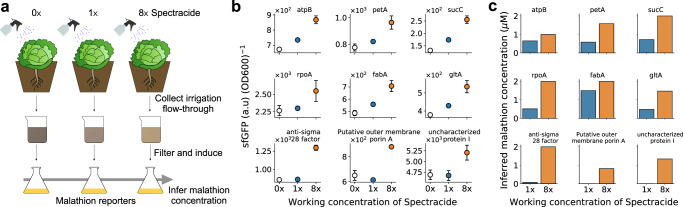
A major challenge in biotechnology and biomanufacturing is the identification of a set of biomarkers for perturbations and metabolites of interest. Here, we develop a data-driven, transcriptome-wide approach to rank perturbation-inducible genes from time-series RNA sequencing data for the discovery of analyte-responsive promoters. This provides a set of biomarkers that act as a proxy for the transcriptional state referred to as cell state. We construct low-dimensional models of gene expression dynamics and rank genes by their ability to capture the perturbation-specific cell state using a novel observability analysis. Using this ranking, we extract 15 analyte-responsive promoters for the organophosphate malathion in the underutilized host organism Pseudomonas fluorescens SBW25. We develop synthetic genetic reporters from each analyte-responsive promoter and characterize their response to malathion. Furthermore, we enhance malathion reporting through the aggregation of the response of individual reporters with a synthetic consortium approach, and we exemplify the library's ability to be useful outside the lab by detecting malathion in the environment. The engineered host cell, a living malathion sensor, can be optimized for use in environmental diagnostics while the developed machine learning tool can be applied to discover perturbation-inducible gene expression systems in the compendium of host organisms.


Conflict of interest statement

The authors declare no competing interests.

Figures

Fig. 1
Fig. 1. Transcriptional genetic sensors underlying the response from environmental perturbations can be extracted using data-driven sensor placement.
Bulk RNA sequencing (RNA-seq) measures transcript abundance over time following transcriptome perturbations (left). Our method (middle) starts by applying dynamic mode decomposition (DMD) to the fold change response of the transcriptome of a population of cells to discover dynamic modes which govern the evolution of the cell state. The dynamic modes are used to design a state observer (or equivalently, optimal gene sampling weights) from which the contribution of each gene to the observability of the transcriptome dynamics can be assessed. The gene sampling weights provide an interpretable ranking for the selection of biomarkers that are then used for cell state reconstruction. Our method returns: (1) a dynamics matrix (or equivalently, a set of dynamic modes) describing how expression of gene i at time t is impacted by gene j and time t − 1. and (2) gene sampling weights signifying a gene’s contribution to the observability of the cell state. The outcome (right), demonstrated in this work, is a library of synthetic analyte-responsive promoters (genetic reporters) that are used to detect an analyte of interest. Since each genetic reporter has a unique response to the same perturbation, the library can be pooled at the assay level to fuse the reporter responses, resulting in enhanced analyte detection.
Fig. 2
Fig. 2. Dynamic mode decomposition provides a predictive and interpretable model of gene expression dynamics.
a The coefficient of determination for the reconstruction is shown while varying number of DMD modes, r in (1) (left). 10 DMD modes are used to construct transcriptome dynamics in this work and the mean-squared error per gene is shown in the histogram on the right. b The eight-step prediction is visualized for five randomly selected genes in the transcriptomic dataset. The mean fold change across the two biological replicates (blue solid curve) and across predictions (orange dashed curve) are depicted. Magenta squares overlapping each gene’s initial condition indicates the data that is provided to make predictions. The coefficient of determination, R2, for the eight-step prediction across all genes is computed to be 0.92. c (Left) The DMD spectrum reveals the growth, decay, and oscillation of each of the 10 dynamic modes that comprise the transcriptomic dataset. Each marker is an eigenvalue, and its diameter is proportional to the magnitude of the corresponding dynamic mode. Eigenvalues inside the unit circle correspond to decaying dynamics, eigenvalues with nonzero imaginary part correspond to oscillatory dynamics, and eigenvalues outside the unit circle correspond to growing dynamics. (Right) The eigenvalue scaled amplitudes, λitbi, of modes 1, 2, and 6 are visualized (upper) along with the 10 genes whose dynamics are most impacted by each of the modes (lower). The marker used for each mode indicates which eigenvalue it corresponds with in c.
Fig. 3
Fig. 3. Gene sampling weights which maximize observability provide machine learned ranking for extraction of genetic sensing elements.
a The gene sampling weights, w, normalized by standard deviation of the corresponding gene, sorted by magnitude and plotted in the upper panel. The weights are grouped into three categories: (i) the third of genes with highest magnitude of sampling weights (green), (ii) the third of genes with second highest magnitude of sampling weights (orange), and ii) and the lower third that remains (blue). The lower panel is a histogram of the sampling weights and a kernel density estimate is superimposed. b The reconstruction accuracy (R2) between the true initial condition and the estimated initial condition when sampling 50 genes at random from each of the aforementioned groups for T = 2 time points (top). (Bottom) The reconstruction accuracy for the high group as a function of T. c Reconstruction accuracy between the estimated initial condition z^0 and the actual z¯0 is plotted for number of sampled time points T = 1 to T = 10. d The average fold change response of each of the 20 genes which contribute most (top) and least (bottom) to the observability of the initial cell state are plotted. e The background subtracted TPM (malathion (TPM) − negative control (TPM)) of the 15 biomarker genes selected from the proposed ranking–by contribution to observability. The label on each x-axis indicates the percentage rank (out of 624 genes) of the gene, with respect to the gene sampling weights, with 100% corresponding to highest rank. The two biological replicates are shown using solid and dashed lines, respectively. Malathion was introduced to the cultures after collecting the sample at 0 minutes, hence this sample is not used for modeling and cell state inference (shaded in gray). f A Venn diagram comparing 180 differentially expressed genes and genes with the largest sampling weights identified by our approach (top). DESeq2 was used to identify differentially expressed genes. The bottom panel shows a histogram of the L2 norm (Euclidean distance from the origin) of the fold change responses for the genes in the unique sets in the Venn diagram.
Fig. 4
Fig. 4. Our machine learning approach successfully extracted 15 sensors, each with distinct malathion response curves.
a A map of the plasmid, pBHVK, used to construct the library. The plasmid contains a kanamycin resistance gene as well as a fast-folding sfGFP gene. b Average per cell sfGFP signal at 0.37 μM (left) and 1.83 μM (right) malathion normalized by signal at 0.0 μM malathion is shown for all 15 engineered strains. c Transfer curves (or dose-response curves) for each strain are depicted with markers and their fit to Hill equation kinetics are given by solid lines. The Hill equation parameters are given in Table 1. The promoter sequences corresponding to each reporter and time points for each transfer curve are given in Supplementary Tables 2 and 4, respectively. The transfer curves are plotted at the time point of maximal fold change of the 2.24 μM response with respect to the 0 μM response. The error bars represent the standard deviation from the mean across three biological replicates. d Transfer curve parameters for the dose-responses depicted in c. The error bars represent the standard deviation from the mean across three biological replicates. Source data are provided as a Source Data file.
Fig. 5
Fig. 5. The 15-dimensional genetic reporter cell state provides a unique response to malathion.
a For each genetic reporter, the heatmap depicts the Pearson correlation of the malathion fold change response (rows) with the fold change response to zeta-cypermethrine, permethrin, fructose, or lactose (columns). b The fold change response (reporter + compound with respect to reporter + no compound) of four reporters – two with highest overall correlation and two with lowest overall correlation across compounds. The error bars represent the propagated standard deviations of each of the individual responses across three biological replicates. Source data are provided as a Source Data file.
Fig. 6
Fig. 6. Pooling all 15 malathion reporters results in enhanced reporting for environmental monitoring.
a Time-lapse response after pooling all 15 malathion reporters into a single well and inducing with malathion. Error bars represent the sample standard deviation across three biological replicates. b The fold change at 24 h of the pooled reporter with malathion induction with respect to the pooled reporter without malathion induction. The error bars represent the propogated standard deviations of each of the individual responses across three biological replicates and the bar height represents the fold change calculated using the mean sfGFP/OD signal from malathion and from control conditions. Source data are provided as a Source Data file.
Fig. 7
Fig. 7. Irrigation water containing malathion from an agricultural setting activates transcriptional reporters and allows for inference of environmental malathion concentration.
a Three cabbage plants are sprayed with a solution of 0, 1, and 8 times the working concentration of Spectracide, respectively. The flow-through is first captured and filtered and then used to induce transcriptional activity in the malathion reporter strains. Using previously characterized response curves for each reporter, an inference for the malathion concentration can be made. b The average per cell fluorescence (arbitrary units) of 9 out of the 15 malathon reporters, after 24 h of induction, showed activation due to the soil runoff solution containing malathion. The working concentration of Spectracide is instructed as 1oz of Spectracide to 1 gallon of water. The error bars represent the sample standard deviation from the mean across three biological replicates. Source data are provided as a Source Data file. c The concentration of malathion present in the irrigation water is inferred using the signal from b and the fitted response curves from Fig. 4d.

Similar articles

Cited by

References

    1. Voigt CA. Genetic parts to program bacteria. Curr. Opin. Biotechnol. 2006;17:548–557. doi: 10.1016/j.copbio.2006.09.001. - DOI - PubMed
    1. Bousse L. Whole cell biosensors. Sens. Actuat. B: Chem. 1996;34:270–275. doi: 10.1016/S0925-4005(96)01906-5. - DOI
    1. Moraskie, M. et al. Microbial whole-cell biosensors: current applications, challenges, and future perspectives. Biosens. Bioelectron.191, 113359 (2021). - PMC - PubMed
    1. Song, Y. et al. Application of bacterial whole-cell biosensors in health. Handb. Cell Biosens. 945–961 (2022).
    1. Salis H, Tamsir A, Voigt C. Engineering bacterial signals and sensors. Bacterial Sens. Signal. 2009;16:194–225. doi: 10.1159/000219381. - DOI - PubMed

Publication types

MeSH terms