. 2023 May 30;14(1):3121.
doi: 10.1038/s41467-023-38907-6.

Characteristics of methane emissions from alpine thermokarst lakes on the Tibetan Plateau

Affiliations

Characteristics of methane emissions from alpine thermokarst lakes on the Tibetan Plateau

Guibiao Yang et al. Nat Commun. .

Abstract

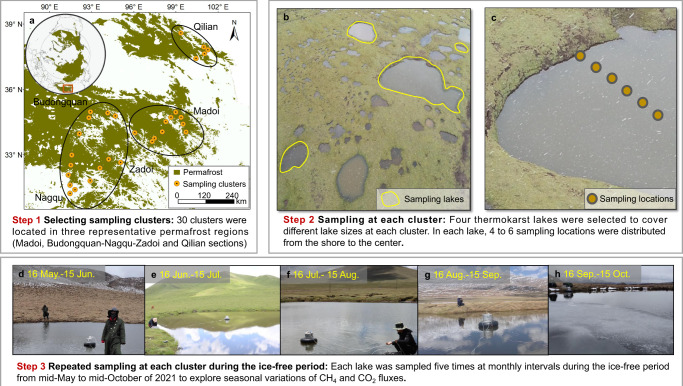
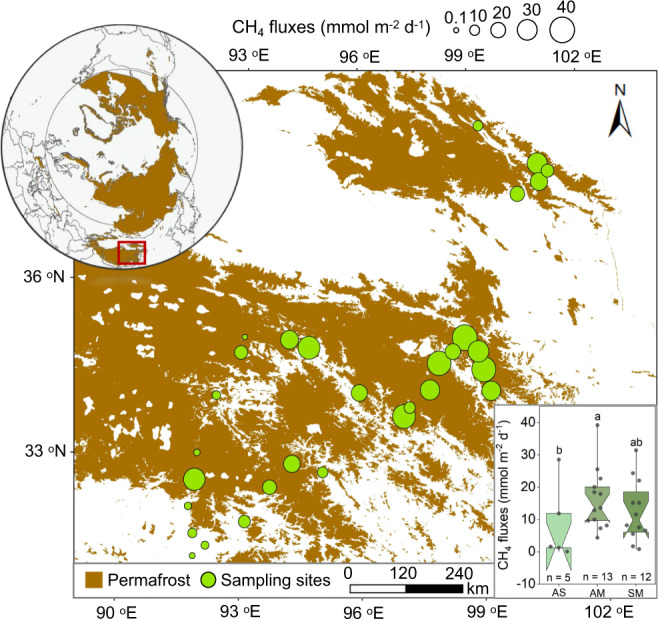
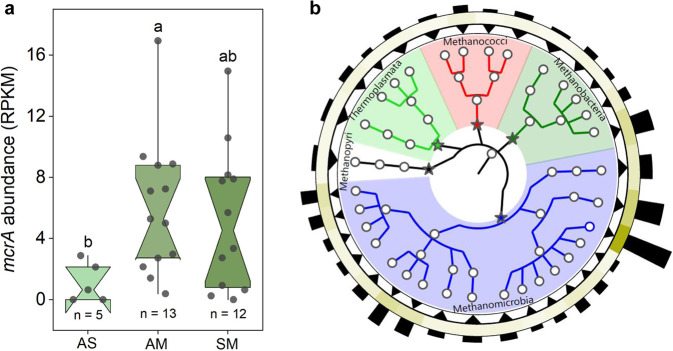
Understanding methane (CH4) emission from thermokarst lakes is crucial for predicting the impacts of abrupt thaw on the permafrost carbon-climate feedback. However, observational evidence, especially from high-altitude permafrost regions, is still scarce. Here, by combining field surveys, radio- and stable-carbon isotopic analyses, and metagenomic sequencing, we present multiple characteristics of CH4 emissions from 120 thermokarst lakes in 30 clusters along a 1100 km transect on the Tibetan Plateau. We find that thermokarst lakes have high CH4 emissions during the ice-free period (13.4 ± 1.5 mmol m-2 d-1; mean ± standard error) across this alpine permafrost region. Ebullition constitutes 84% of CH4 emissions, which are fueled primarily by young carbon decomposition through the hydrogenotrophic pathway. The relative abundances of methanogenic genes correspond to the observed CH4 fluxes. Overall, multiple parameters obtained in this study provide benchmarks for better predicting the strength of permafrost carbon-climate feedback in high-altitude permafrost regions.


Conflict of interest statement

The authors declare no competing interests.

Figures

Fig. 1
Fig. 1. The flow chart of the sampling campaign.
Our field sampling consists of the following three key steps. First, we choose 30 clusters of thermokarst lakes along a 1100 km transect on the Tibetan Plateau (a). Second, multiple locations within multiple lakes are selected at each cluster to eliminate spatial heterogeneity. In particular, four thermokarst lakes with different sizes are selected at each cluster (b). In each lake, 4 to 6 sampling locations are distributed from the shore to center (c), and at each location flux measurements are taken and averaged to estimate the CH4 and CO2 flux from the lake. Finally, each lake is sampled five times at monthly intervals during the ice-free period from mid-May to mid-October of 2021 to explore seasonal variation of CH4 or CO2 fluxes (dh). In-situ CH4 and CO2 fluxes are determined using an opaque lightweight floating chamber equipped with a closed loop to a near-infrared laser CH4/CO2 analyzer (GLA231-GGA, ABB., Canada). In (a), the permafrost map of the Northern Hemisphere is obtained from the National Snow & Ice Data Center. Spatial distribution of permafrost on the Tibetan Plateau is derived from Zou et al.. The ellipses indicate the three representative permafrost regions in our study area, including the Madoi, Budongquan-Nagqu-Zadoi and Qilian sections. Photos are taken by G.Y.
Fig. 2
Fig. 2. CH4 fluxes in alpine thermokarst lake on the Tibetan Plateau.
Bubble size is proportional to the value of the CH4 flux at each cluster, with a larger size representing a higher value. The background permafrost maps of the Northern Hemisphere and the Tibetan Plateau are derived from the National Snow & Ice Data Center and Zou et al., respectively. The inset shows the comparison of CH4 fluxes in thermokarst lakes located in the three grassland types. AS, AM and SM represent alpine steppe, alpine meadow and swamp meadow, respectively. Box plots present the 25th and the 75th quartile (interquartile range), and whiskers indicate the data range among thermokarst lakes located in AS (n = 5), AM (n = 13) and SM (n = 12), respectively. The notches are the medians with 95% confidence intervals. Observed values are shown as black dots. Significant differences are denoted by different letters (one-way ANOVAs with two-sided Tukey’s HSD multiple comparisons, p = 0.049).
Fig. 3
Fig. 3. Contribution of CH4 to total carbon emissions from the investigated thermokarst lakes.
Panels (a, b) represent the density of carbon fluxes and CO2-equivalent emmissions, respectively. The lines indicate the fluxes from four thermokarst lakes at each cluster during the measurement period. The pie charts show the contribution of CH4 fluxes to total carbon emissions and CO2-equivalent emissions. Mean CH4 flux during the ice-free season and its CO2-equivalent emissions are shown outside parentheses, and the corresponding contribution to total carbon emissions and CO2-equivalent emissions are presented in parentheses, respectively.
Fig. 4
Fig. 4. CH4 ebullition and diffusion fluxes, radiocarbon age and production pathway in alpine thermokarst lakes on the Tibetan Plateau.
In (a), the corresponding values of light green and dark green lines represent the ebullition and diffusion CH4 fluxes across 30 clusters, respectively. Line shows the mean CH4 flux for the four thermokarst lakes at each cluster. In (b), line indicates the radiocarbon age of surface permafrost below the active layer at each sampling site (n = 24). In (c), the light blue and light orange lines are the apparent carbon fractionation factor (αC) values of 1.04 and 1.055. The αC values indicate the pathway of CH4 production, with αC > 1.055 suggesting that CH4 is mainly produced by CO2 reduction (hydrogenotrophic methanogenesis, HM), and αC < 1.055 suggesting that CH4 is produced increasingly by acetate fermentation (acetoclastic methanogenesis, AM). 14C and δ13C isotopic signatures were measured in the bubble gas from only 24 and 29 lakes respectively, due to the limited volume of gas samples that could be collected in the field.
Fig. 5
Fig. 5. Methanogenic micoorganisms of thermokarst lakes on the Tibetan Plateau.
Panel (a) respresents the differences in the key functional gene of mcrA among thermokarst lakes located in alpine steppe (AS), alpine meadow (AM), and swamp meadow (SM). The relative abundance of mcrA gene was predicted by contigs with length ≥ 1000 bp. Box plots present the 25th and the 75th quartile (interquartile range), and whiskers indicate the data range among thermokarst lakes located in AS (n = 5), AM (n = 13) and SM (n = 12), respectively. The notches are the medians with 95% confidence intervals. Observed values are shown as black dots. Significant differences are denoted by different letters (one-way ANOVAs with two-sided Tukey’s HSD multiple comparisons, p = 0.038). Panel (b) shows methanogenic taxonomic infromation. The colors in the inner ring represent the different taxa. The triangles in the first ring indicate relative abundance with ≥ 5 per 10,000 (upper triangle) or <5 per 10,000 (lower triangle). The mean relative abundances for all samples are shown in the second ring and pillars, where color depth and height are proportional to the cubic root of relative abundance.

References

    1. Gruber S. Derivation and analysis of a high-resolution estimate of global permafrost zonation. Cryosphere. 2012;6:221–233. doi: 10.5194/tc-6-221-2012. - DOI
    1. Hugelius G, et al. Estimated stocks of circumpolar permafrost carbon with quantified uncertainty ranges and identified data gaps. Biogeosciences. 2014;11:6573–6593. doi: 10.5194/bg-11-6573-2014. - DOI
    1. Biskaborn BK, et al. Permafrost is warming at a global scale. Nat. Commun. 2019;10:264. doi: 10.1038/s41467-018-08240-4. - DOI - PMC - PubMed
    1. Brown J, Romanovsky VE. Report from the international permafrost association: state of permafrost in the first decade of the 21st century. Permafr. Periglac. 2008;19:255–260. doi: 10.1002/ppp.618. - DOI
    1. Schuur EAG, et al. Vulnerability of permafrost carbon to climate change: implications for the global carbon cycle. Bioscience. 2008;58:701–714. doi: 10.1641/B580807. - DOI