. 2023 May 30;14(1):3120.
doi: 10.1038/s41467-023-38710-3.

Newborn metabolomic signatures of maternal per- and polyfluoroalkyl substance exposure and reduced length of gestation

Affiliations

Newborn metabolomic signatures of maternal per- and polyfluoroalkyl substance exposure and reduced length of gestation

Kaitlin R Taibl et al. Nat Commun. .

Abstract

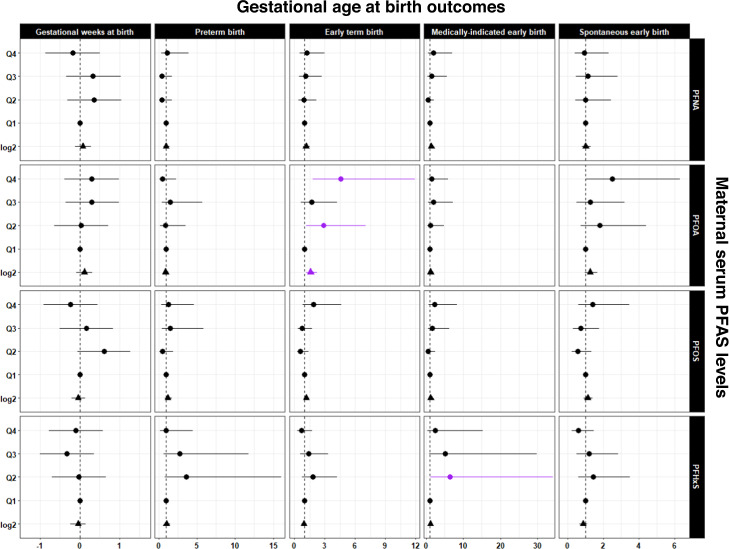
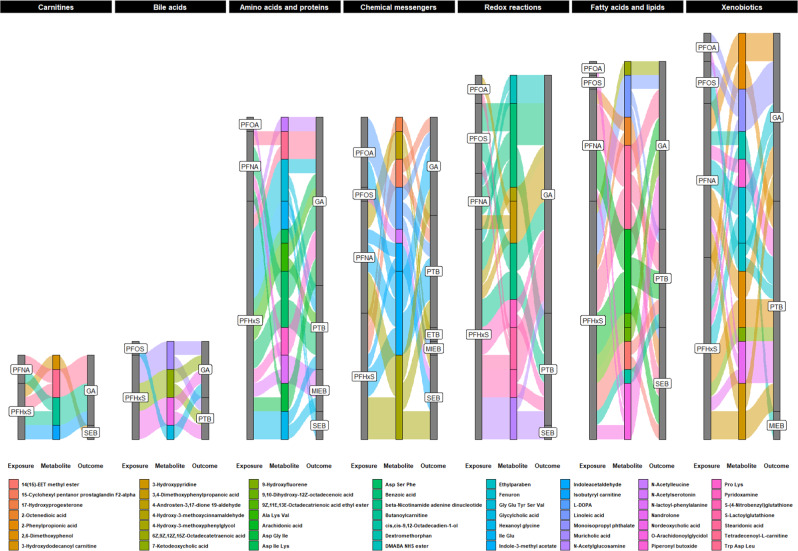
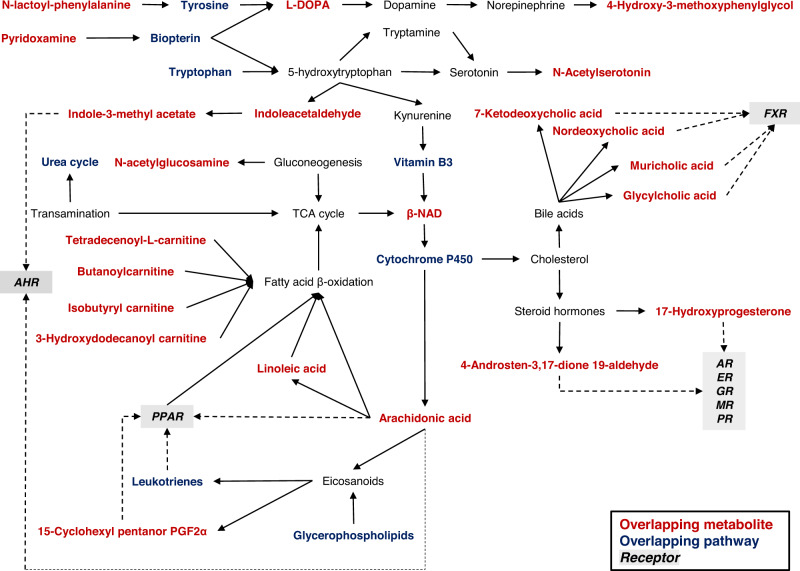
Marginalized populations experience disproportionate rates of preterm birth and early term birth. Exposure to per- and polyfluoroalkyl substances (PFAS) has been reported to reduce length of gestation, but the underlying mechanisms are unknown. In the present study, we characterized the molecular signatures of prenatal PFAS exposure and gestational age at birth outcomes in the newborn dried blood spot metabolome among 267 African American dyads in Atlanta, Georgia between 2016 and 2020. Pregnant people with higher serum perfluorooctanoic acid and perfluorohexane sulfonic acid concentrations had increased odds of an early birth. After false discovery rate correction, the effect of prenatal PFAS exposure on reduced length of gestation was associated with 8 metabolomic pathways and 52 metabolites in newborn dried blood spots, which suggested perturbed tissue neogenesis, neuroendocrine function, and redox homeostasis. These mechanisms explain how prenatal PFAS exposure gives rise to the leading cause of infant death in the United States.


Conflict of interest statement

The authors declare no competing interests.

Figures

Fig. 1
Fig. 1. Dot-and-whisker plots showing the associations between prenatal serum PFAS levels and gestational age at birth outcomes among African American mother-newborn dyads in Atlanta, 2016–2020.
Statistical tests were performed with two-sided multivariable linear or logistic regression with a significance level of p-value < 0.05. The sample size of independent dyads was as follows: N = 267 for gestational age at birth, N = 200 for early term birth and spontaneous early birth, N = 149 for preterm birth and medically indicated early birth. Data are presented as coefficient estimates (β) ±95% confidence intervals (CI) or odds ratios (ORs) ±95% confidence intervals (CI). The coefficient estimates (β) for gestational age and ORs for preterm birth, early term birth, medically indicated early birth (preterm birth or early term birth), and spontaneous early birth (preterm birth or early term birth) are on the X-axis. For the binary birth outcomes, the reference group was healthy full-term births. The vertical gray dashed line is the null value. Exposure to PFAS for every log2-unit increase and categorized by quartiles are on the Y-axis. Dots represent quartile exposures and triangles represent continuous exposures. Dots or triangles and whiskers color coded as purple are statistically significant at p-value < 0.05. The quartile cutoffs for PFOA (ng/mL) were as follows: Q1: <LOD – 0.42, Q2: 0.42 – 0.63, Q3: 0.63 – 0.96, Q4: 0.96 – 3.42. The quartile cutoffs for PFNA (ng/mL) were as follows: Q1: <LOD – 0.16, Q2: 0.16 – 0.28, Q3: 0.28 – 0.46, Q4: 0.46 – 1.51. The quartile cutoffs for PFOS (ng/mL) were as follows: Q1: <LOD – 1.04, Q2: 1.04 – 1.64, Q3: 1.64 – 2.46, Q4: 2.46 – 9.59. The quartile cutoffs for PFHxS (ng/mL) were as follows: Q1: <LOD – 0.66, Q2: 0.66 – 1.07, Q3: 1.07 – 1.93, Q4: 1.93 – 6.17. Note: Exact p-values are provided in Supplemental Table 3. PFAS, perfluoroalkyl substances; PFHxS, perfluorohexane sulfonic acid; PFOS, perfluorooctane sulfonic acid; PFOA, perfluorooctanoic acid; PFNA, perfluorononanoic acid; Q, quartile. Source data are provided as a Source Data file.
Fig. 2
Fig. 2. Volcano plots of identified metabolites associated with prenatal serum PFAS levels and gestational age at birth outcomes in Atlanta, 2016 – 2020.
Blue dots represent metabolites with negative associations, red dots represent metabolites with positive associations, and gray dots represent metabolites with non-significant associations among those confirmed and annotated. The coefficient estimate (β) from the MWAS is on the X-axis. The significance threshold is on the Y-axis. The vertical gray dashed line represents the null value. Select metabolites are annotated on the plots. A Volcano plot of metabolites associated with PFOA. Statistical tests were performed with two-sided multivariable linear regression. There were N = 267 independent dyads in the analytic sample. No adjustments were made for multiple comparisons. The horizontal gray dashed line represents the log10 p-value = 0.05. B Volcano plot of metabolites associated with PFOS. Statistical tests were performed with two-sided multivariable linear regression. There were N = 267 independent dyads in the analytic sample. No adjustments were made for multiple comparisons. The horizontal gray dashed line represents the log10 p-value = 0.05. C Volcano plot of metabolites associated with PFNA. Statistical tests were performed with two-sided multivariable linear regression. There were N = 267 independent dyads in the analytic sample. FDR from multiple comparisons was corrected with the Benjamini–Hochberg procedure. The horizontal gray dashed line represents the log10 FDR q-value = 0.05. D Volcano plot of metabolites associated with PFHxS. Statistical tests were performed with two-sided multivariable linear regression. There were N = 267 independent dyads in the analytic sample. FDR from multiple comparisons was corrected with the Benjamini–Hochberg procedure. The horizontal gray dashed line represents the log10 FDR q-value = 0.05. E Volcano plot of metabolites associated with gestational weeks at birth. Statistical tests were performed with two-sided multivariable linear regression. The reference group was healthy full-term births. There were N = 267 independent dyads in the analytic sample. FDR from multiple comparisons was corrected with the Benjamini-Hochberg procedure. The horizontal gray dashed line represents the log10 FDR q-value = 0.05. F Volcano plot of metabolites associated with preterm birth. Statistical tests were performed with two-sided multivariable logistic regression. The reference group was healthy full-term births. There were N = 149 independent dyads in the analytic sample. FDR from multiple comparisons was corrected with the Benjamini–Hochberg procedure. The horizontal gray dashed line represents the log10 FDR q-value = 0.05. G Volcano plot of metabolites associated with early term birth. Statistical tests were performed with two-sided multivariable logistic regression. The reference group was healthy full-term births. There were N = 200 independent dyads in the analytic sample. FDR from multiple comparisons was corrected with the Benjamini-Hochberg procedure. The horizontal gray dashed line represents the log10 FDR q-value = 0.05. H Volcano plot of metabolites associated with spontaneous early birth. Statistical tests were performed with two-sided multivariable logistic regression. The reference group was healthy full-term births. There were N = 200 independent dyads in the analytic sample. FDR from multiple comparisons was corrected with the Benjamini-Hochberg procedure. The horizontal gray dashed line represents the log10 FDR q-value = 0.05. I Volcano plot of metabolites associated with medically indicated early birth. Statistical tests were performed with two-sided multivariable logistic regression. The reference group was healthy full-term births. There were N = 149 independent dyads in the analytic sample. FDR from multiple comparisons was corrected with the Benjamini-Hochberg procedure. The horizontal gray dashed line represents the log10 FDR q-value = 0.05. MWAS, metabolome-wide association study; PFAS, per- and polyfluoroalkyl substances; PFHxS, perfluorohexane sulfonic acid; PFOS, perfluorooctane sulfonic acid; PFOA, perfluorooctanoic acid; PFNA, perfluorononanoic acid; FDR, false discovery rate. Source data are provided as a Source Data file.
Fig. 3
Fig. 3. Alluvial plots of identified metabolites that relate the association of prenatal serum PFAS levels with gestational age at birth outcomes in Atlanta, 2016–2020.
The sample size of independent dyads was as follows: N = 267 for gestational age at birth, N = 200 for early term birth and spontaneous early birth, N = 149 for preterm birth and medically indicated early birth. The gray stacked bars indicate the frequency and relative proportion of PFAS exposure or gestational age at birth outcomes associated with the metabolite. The colored stacked bars indicate the frequency and relative proportion of metabolites associated with PFAS exposure and gestational age at birth outcomes. The legend shows which color corresponds to one of the 56 metabolites. Abbreviations: PFAS, perfluoroalkyl substances; PFHxS, perfluorohexane sulfonic acid; PFOS, perfluorooctane sulfonic acid; PFOA, perfluorooctanoic acid; PFNA, perfluorononanoic acid; PTB, preterm birth; ETB, early term birth; MIEB, medically indicated early birth; SEB, spontaneous early birth; GA, gestational weeks at birth. Source data are provided as a Source Data file.
Fig. 4
Fig. 4. Enriched pathways that relate the association of prenatal serum PFAS levels with gestational age at birth outcomes in Atlanta, 2016–2020.
The sample size of independent dyads was as follows: N = 200 for early term birth and spontaneous early birth, N = 149 for preterm birth and medically indicated early birth. A Heat map of the γ-adjusted p-values. A γ p-value is calculated based on permutations that randomly resamples the list of total features for a number of features equal to the significant set many times to create a γ null distribution. Cell color corresponds to the p-value for a metabolic pathway that overlaps in at least one PFAS metabolome-wide association study (MWAS) and gestational age at birth outcome MWAS. The reference group was healthy full-term births for the following MWAS: preterm birth, early term birth, medically indicated early birth (PTB or ETB), and spontaneous early birth (PTB or ETB). The significant signals are the average numbers of significant putative metabolites enriched in the overlapping pathways and associated an exposure or outcome. The pathway size is the average number of significant putative metabolites in the overlapping metabolic pathways. Overlap % is the relative proportion of significant signals to the pathway size. The metabolic pathways are grouped by amino acids, enzymes, coenzymes, and cofactors, and bioactive lipids. B Sunburst charts showing the frequency of overlap for the serum PFAS levels (green), overlapping pathways (gold), and gestational age at birth outcomes (blue). The largest sections indicate the greatest amount of overlap and the smallest sections indicate the least amount of overlap. Abbreviations: PFAS, per- and polyfluoroalkyl substances; PFHxS, perfluorohexane sulfonic acid; PFOS, perfluorooctane sulfonic acid; PFOA, perfluorooctanoic acid; PFNA, perfluorononanoic acid; PTB, preterm birth; ETB, early term birth; MIEB, medically indicated early birth; SEB, spontaneous early birth; GA, gestational weeks at birth. Source data are provided as a Source Data file.
Fig. 5
Fig. 5. Proposed molecular network of mechanisms and biomarkers in the newborn dried blood spot metabolome underlying the association of prenatal serum PFAS levels with gestational age at birth outcomes in Atlanta, 2016–2020.
Abbreviations: PFAS, per- and polyfluoroalkyl substances; AHR, aryl hydrocarbon receptor; PPAR, peroxisome proliferator-activated receptor; AR, androgen receptor; ER, estrogen receptor; GR, glucocorticoid receptor; MR, mineralocorticoid receptor; PR, progestin receptor; FXR, farnesoid X receptor; TCA cycle, tricarboxylic acid; L-DOPA, levodopa; β-NAD, β-nicotinamide adenine dinucleotide; 15-cyclohexyl pentanor PGF2α, 15-cyclohexyl pentanor prostaglandin F2α. Source data are provided as a Source Data file.

References

    1. Osterman M, Hamilton B, Martin JA, Driscoll AK, Valenzuela CP. Births: final data for 2020. Natl Vital Stat Rep. 2021;70:1–50. - PubMed
    1. Crump C, Sundquist K, Winkleby MA, Sundquist J. Early-term birth (37-38 weeks) and mortality in young adulthood. Epidemiology. 2013;24:270–276. doi: 10.1097/EDE.0b013e318280da0f. - DOI - PubMed
    1. Moster D, Lie RT, Markestad T. Long-term medical and social consequences of preterm birth. N. Engl. J. Med. 2008;359:262–273. doi: 10.1056/NEJMoa0706475. - DOI - PubMed
    1. Group E, et al. One-year survival of extremely preterm infants after active perinatal care in Sweden. JAMA. 2009;301:2225–2233. doi: 10.1001/jama.2009.771. - DOI - PubMed
    1. McCormick MC, Litt JS, Smith VC, Zupancic JA. Prematurity: an overview and public health implications. Annu. Rev. Public Health. 2011;32:367–379. doi: 10.1146/annurev-publhealth-090810-182459. - DOI - PubMed

Publication types