. 2023 May 30;14(1):3106.
doi: 10.1038/s41467-023-38703-2.

Antigen recognition detains CD8+ T cells at the blood-brain barrier and contributes to its breakdown

Affiliations

Antigen recognition detains CD8+ T cells at the blood-brain barrier and contributes to its breakdown

Sidar Aydin et al. Nat Commun. .

Abstract

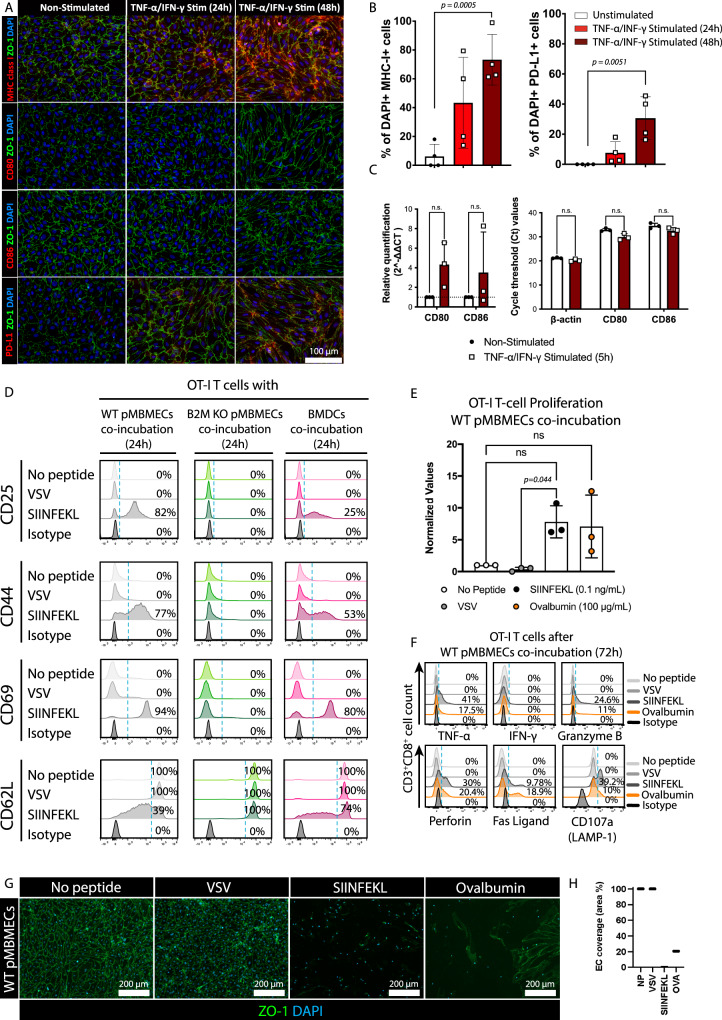
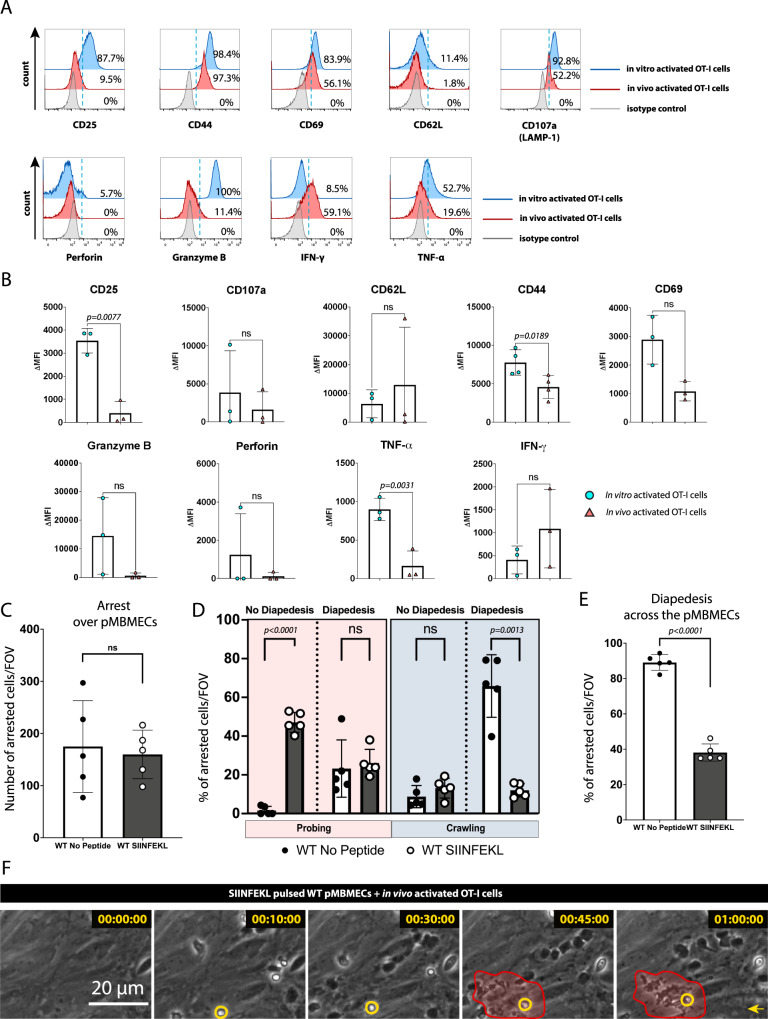
Blood-brain barrier (BBB) breakdown and immune cell infiltration into the central nervous system (CNS) are early hallmarks of multiple sclerosis (MS). High numbers of CD8+ T cells are found in MS lesions, and antigen (Ag) presentation at the BBB has been proposed to promote CD8+ T cell entry into the CNS. Here, we show that brain endothelial cells process and cross-present Ag, leading to effector CD8+ T cell differentiation. Under physiological flow in vitro, endothelial Ag presentation prevented CD8+ T cell crawling and diapedesis resulting in brain endothelial cell apoptosis and BBB breakdown. Brain endothelial Ag presentation in vivo was limited due to Ag uptake by CNS-resident macrophages but still reduced motility of Ag-specific CD8+ T cells within CNS microvessels. MHC class I-restricted Ag presentation at the BBB during neuroinflammation thus prohibits CD8+ T cell entry into the CNS and triggers CD8+ T cell-mediated focal BBB breakdown.


Conflict of interest statement

The authors declare no competing interests.

Figures

Fig. 1
Fig. 1. pMBMECs present Ag to naïve CD8+ T cells inducing their activation and proliferation and CD8+ T cell mediated disruption of the barrier in vitro.
A Immunofluorescence staining of pMBMECs for MHC class I, CD80, CD86 and PD-L1, ZO-1, nuclei (DAPI). pMBMECs were stimulated or not with TNF-α/IFN-γ for 24 and 48 h. Staining representative of 5 individual experiments. B Quantification of (A) from 4 individual experiments shown as mean ± SD of the percentage of MHC-I+ and PD-L1+ cells over the total number of DAPI+ cells per field of view. Data were analyzed using two-sided unpaired parametric T-Welch’s test. C Relative gene expression of CD80 and CD86 from unstimulated and TNF-α/IFN-γ -stimulated (5 h) pMBMECs, assessed by qRT-PCR. Technical replicates from 3 individual experiments were measured. Relative quantification represented by the mean ± SD of the 2−ΔΔCt value. Data were analyzed using two-sided non-parametric Mann–Whitney U test. D TNF-α/IFN-γ stimulated pMBMECs from WT or B2M-KO mice or BMDCs were pulsed with SIINFEKL (0.1 ng/mL, 30 min) and co-cultured for 24 h with naïve OT-I T cells. Flow cytometry analysis of OT-I cells after co-culture in the absence or presence of VSV- or SIINFEKL peptides is shown. Histograms depict CD25, CD44, CD69 and CD62L stainings on CD3+CD8+ OT-I cells. Percentage of events above the dashed blue threshold is indicated. Data represents 3 individual experiments. E BrdU-incorporation in OT-I cells after 72 h of co-culture with TNF-α/IFN-γ -stimulated WT pMBMECs in the absence or presence of VSV- or SIINFEKL peptides or full-length ovalbumin (OVA) is shown. Data are pooled from 3 individual experiments with technical replicates, analyzed using one-way ANOVA and shown as mean ± SD normalized to the condition without peptide pulsation. F Flow cytometry analysis of OT-I cells after 72 h of co-culture with WT pMBMECs in the absence or presence of VSV- or SIINFEKL peptides or OVA. Histograms show staining of CD3+CD8+ OT-I cells from the co-culture for TNF-α, IFN-γ, granzyme B, perforin, Fas ligand and CD107a (LAMP-1). Percentage of events above the dashed blue threshold is shown. Data represents 3 individual experiments. G TNF-α/IFN-γ stimulated WT pMBMECs were pulsed with SIINFEKL or OVA. pMBMECs were co-cultured for 72 h with naïve OT-I cells. Immunofluorescence staining for cell junctions (ZO-1), nuclei (DAPI) is shown. Data represents 3 individual experiments. H Quantification of the endothelial cell coverage in (G) measured as percentage of the FOV area covered by endothelial cells. Source data from (B, C, E, F and H) are provided as a Source Data file.
Fig. 2
Fig. 2. Naïve OT-I cells display impaired crawling on inflamed pMBMECs upon recognition of cognate Ag on MHC class I under physiological flow in vitro.
A Graphs show the number of arrested naïve OT-I cells per FOV (872 × 654 μm) on TNF-α/IFN-γ stimulated WT pMBMECs without peptide (white bar), VSV peptide- (gray bar) and SIINFEKL (black bar) and on B2M-KO pMBMECs without peptide (light green bar), with VSV peptide- (green bar) and SIINFEKL peptide pulsing (teal color bar). Data were pooled from 3 independent experiments, analyzed using ordinary one-way ANOVA with Tukey’s multiple comparisons test, and shown as mean ± SD. See also Supplementary Movie 2. B Quantification of post-arrest behavior of naïve OT-I cells on WT and B2M-KO pMBMECs during 30 min recording. The number of arrested naïve OT-I T cells for each condition was set to 100% and the behavioral categories are shown as fraction thereof. Data is shown as mean ± SD from 3 experiments. See also Supplementary Movie 2. Violin plots of the crawling distance in μm (C) and speed in μm/min (D) of naïve OT-I cells on TNF-α/IFN-γ -stimulated WT and B2M-KO pMBMECs are shown. Values are pooled from three individual expeirments and shown as mean ± SD. For each condition 4–18 cells were tracked. Data were analyzed using ordinary one-way ANOVA with Tukey’s multiple comparisons test. Source data from (A, B, C and D) are provided as a Source Data file.
Fig. 3
Fig. 3. pMBMECs cross-present abluminal Ags to naïve OT-I cells on their luminal side and induce their differentiation into effector cells in vitro.
A Flow cytometry analysis of naïve OT-I cells for activation markers after 24 h of co-culture with TNF-α/IFN-γ-stimulated WT pMBMECs grown on 0.4 μm pore size Transwell filter inserts with abluminal presence of VSV-peptide, SIINFEKL or OVA (SIINFEKL: 0.1 ng/mL, 10 ng/mL, 100 ng/mL; OVA: 100 µg/mL, 200 µg/mL). Histogram plots show staining of CD3+CD8+ naïve OT-I cells after co-incubation for CD25, CD44, CD69 and CD62L. Isotype control for each marker in each condition is shown at the top of each plot. Percentage of events above the dashed blue threshold is indicated. The data is representative of 3 individual experiments. B Quantification of (A) represented as percentage of CD8+ cells with high expression of CD25, CD44, CD69 and CD62L. Data were quantified from 2 individual experiments with technical replicates, for CD25, CD44 and CD69 and from 3 individual experiments for CD62L, and shown as mean ± SD. C The assessment of naïve OT-I cell-proliferation by BrdU assay after 72 h of co-culture with TNF-α/IFN-γ-stimulated WT pMBMECs on the Transwell filters in the absence of Ag or presence of abluminal SIINFEKL or OVA with increasing concentrations (SIINFEKL: 0.1 ng/mL, 10 ng/mL, 100 ng/mL; OVA: 100 µg/mL, 200 µg/mL). Data were pooled from 3 individual experiments with technical replicates, analyzed using one-way ANOVA and shown as mean ± SD normalized to the condition without peptide. D Immunofluorescence staining of cytokine-stimulated WT pMBMECs for JAM-A (green), nuclei (DAPI, blue) after 72 h of co-culture with naïve OT-I cells on Transwell filters in the absence of Ag or presence of abluminal SIINFEKL or OVA (SIINFEKL: 0.1 ng/mL, 10 ng/mL, 100 ng/mL; OVA: 100 µg/mL, 200 µg/mL). Scale bar = 20 μm. The data is representative of 3 individual experiments. E Quantification of the endothelial cell coverage in (D) measured as percentage of the FOV area covered by endothelial cells. Source data from (B, C and E) are provided as a Source Data file.
Fig. 4
Fig. 4. Ag presentation by pMBMECs arrests effector OT-I cells and initiates barrier breakdown under physiological flow in vitro.
A Number of arrested in vitro activated OT-I cells per FOV (872 × 654 μm) on TNF-α/IFN-γ stimulated WT or B2M-KO pMBMECs without peptide, with VSV or SIINFEKL peptide pulsing. Data were pooled from 3 independent experiments, analyzed using ordinary one-way ANOVA with Tukey’s multiple comparisons test, and shown as mean ± SD. See Supplementary Movie 3. B Post-arrest behavior of effector OT-I cells on WT and B2M-KO pMBMECs over 30 min. The behavioral categories are shown as percentage of arrested OT-I cells on pMBMECs. Data were pooled from 3 independent experiments, analyzed using ordinary one-way ANOVA with Tukey’s multiple comparisons test, and shown as mean ± SD. See Supplementary Movie 3. Violin plots for crawling distance (C) and crawling speed (D) of effector OT-I cells on TNF-α/IFN-γ stimulated WT and B2M-KO pMBMECs. 44-60 cells per condition were tracked. Values were pooled from three individual experiments and are shown as mean ± SD. Data were analyzed using ordinary one-way ANOVA with Tukey’s multiple comparisons test. E Representative image of effector OT-I T cells superfused over a SIINFEKL-pulsed pMBMEC monolayer composed of Ag presentation competent Life-Act-GFP+ pMBMECs and Ag presentation deficient B2M–/– pMBMECs. Data is representative of 4 individual experiments. See Supplementary Movie 6. F Post-arrest behavior of effector OT-I cells on mixed Life-Act-GFP+ and B2M-KO pMBMEC monolayers over 30 min. The behavioral categories are shown as percentage of arrested OT-I T cells normalized to the surface area of the respective endothelial cell type in the FOV. Data is shown as mean ± SD from 4 independent experiments for the SIINFEKL condition and 2 independent experiments for the No Peptide condition. Data were analyzed using ordinary one-way ANOVA with Tukey’s multiple comparisons test. See Supplementary Movie 6. G Violin plots for crawling speed of effector OT-I cells on TNF-α/IFN-γ stimulated mixed pMBMEC monolayers. 80-100 OT-I cells per condition were tracked. Data were pooled from 4 independent experiments and analyzed using two-sided paired parametric t test. H Representative image sequence of effector OT-I cell induced killing of SIINFEKL-pulsed pMBEMCs under physiological flow during 60 min. The area of endothelial cell killing is circled in yellow. Orange arrow indicates the direction of the flow. Data is representative of 3 individual experiments. See Supplementary Movie 4. I Live staining of pMBMECs with Image-iT™ LIVE Red Poly Caspases Detection Kit following 60 min of interactions with activated OT-I cells under physiological flow. Unpulsed pMBMECs served as negative control, staurosporin-induced apoptosis as positive control. Gray: phase constrast imaging visualizes the pMBMEC monolayer; Red: Caspase-3/−7 staining for apopotosis, Green: Sytox Green shows cell membrane damage, Blue: HOECHST viusalizes cell nuclei. Areas within dashed yellow boxes are shown magnified in the merged image. Data is representative of 3 individual experiments. Source data from (A, B, C, D, F and G) are provided as a Source Data file.
Fig. 5
Fig. 5. Interaction of in vivo activated OT-I cells with pMBMECs resembles that of in vitro activated OT-I cells.
Naïve tdTomato+ OT-I cells were injected into WT C57BL/6 J mice 24 h prior to LCMV-OVA infection. Spleens of the recipient mice were collected at day 8 post-infection and activated OT-I cells were purified by magnetic bead selection and fluorescence-activated cell sorting. A Side-by-side comparison of in vitro and in vivo activated OT-I cells. Histograms depict flow cytometry staining for CD25, CD44, CD69, CD62L, TNF-α, IFN-γ, GrB, Perforin and CD107a (LAMP-1) of CD3+CD8+ single-cell gated in vitro and in vivo activated OT-I cells. Percentage of events above the dashed blue threshold is indicated. Data is representative of 3 individual experiments. B Quantification of (A) represented as mean ± SD of the mean fluorescence intensity for the respective antigens normalized to their respective isotype controls. Data were pooled from 3 independent experiments and analyzed using two-sided unpaired parametric T-Welch’s test. C, D, E Dynamic interaction of in vivo activated OT-I cells with TNF-α/IFN-γ-stimulated pMBMECs under physiological flow in vitro during 30 min of recording is shown. C Number of arrested in vivo activated OT-I cells on unpulsed or SIINFEKL-pulsed pMBMECs. D Post-arrest behavior of arrested in vivo activated OT-I cells on TNF-α/IFN-γ stimulated pMBMECs under physiological flow in vitro. The behavioral categories are shown as percentage of categorized in vivo activated OT-I cells for each condition on pMBMECs. E Bar graph shows the percentage of arrested in vivo activated OT-I cells undergoing diapedesis across the pMBMECs for each condition. Data are representative of three individual experiments and it is shown as mean ± SD. Data were analyzed using two-sided unpaired parametric T-Welch’s test. F Representative image sequence of in vivo activated- effector OT-I cell induced killing of SIINFEKL-pulsed pMBEMCs under physiological flow during 60 min of imaging. One OT-I CD8+ T cell is highlighted by a yellow circle, while the area of pMBMEC killing is marked with red. The yellow arrow indicates the direction of the flow. Data represent 3 individual experiments. Source data from (B, C, D and E) are provided as a Source Data file.
Fig. 6
Fig. 6. Inflamed brain microvascular endothelial cells express MHC class I and co-stimulatory molecules.
Brains from ODC-OVA, VE-Cadherin-GFP ODC-OVA, VE-Cadherin-GFP or WT C57BL/6 J mice were harvested on day 7 after induction of autoimmune neuroinflammation and double immunofluorescence stainings were performed on 20 μm cryosections: (A) MHC class I (gray), and podocalyxin-positive vasculature (red). Immunostainings for the gray matter (left) and white matter (right) are depicted. Double immunofluorescence staining for CD80 (B), CD86 (C), CD40 (D) and VCAM-1 (E) and podocalyxin-positive vasculature (red) is shown. F Immunofluorescence staining of VE-Cadherin-GFP and VE-Cadherin-GFP ODC-OVA mouse brains for ICAM-1 (gray). White arrows show co-localization of immunostaining for MHC class I with podocalyxin-positive vessels. Yellow asterisks highlight CNS parenchymal cells staining positive for MHC class I or CD86 or ICAM-1. Scale bar = 50 μm. The data in (A) is representative of 5 different immunostainings on tissues from 3 different mice derived from 3 individual experiments. The data from (BF) are representative of 3 different immunostainings on tissue from 3 different mice derived from 3 individual experiments. G Quantification of (AF) represented as mean fluorescence intensity of MHC-I, CD80, CD86, CD40, VCAM-1 and ICAM-1 on the podocalyxin+ or VE-cadherin-GFP+ vessels. Data were analyzed from 3 independent experiments using two-sided unpaired parametric T-Welch’s test, and shown as mean ± SD. Source data from (G) are provided as a Source Data file.
Fig. 7
Fig. 7. CD8+ T cells show an increased arrest coefficient as well as lower general motility on the inflamed BBB in vivo.
A Experimental setup for the induction of CD8+ T cell driven neuroinflammation in the ODC-OVA mouse and its imaging. B Representative images of epifluorescence-IVM imaging of CMFDA-labeled-naïve and -effector OT-I cells adhering in inflamed cervical spinal cord microvessels of WT and ODC-OVA mice 60 min post-infusion. White arrows show arrested OT-I cells in cervical spinal cord microvasculature. Number of naïve (C) and effector (D) OT-I cells adhered in inflamed cervical spinal cord microvessels of WT and ODC-OVA mice with neuroinflammation at 10, 30 and 60 min after infusion of OT-I cells. Data were pooled from 3 mice/genotype for naïve- and 4 mice/genotype for effector OT-I cells, analyzed using two-tailed non-parametric Mann-Whitney U test, and shown as ± SEM. E Representative images over time of two-photon imaging of tdTomato+ in vivo activated (red) and CMFDA-labeled in vitro activated OT-I cells (green) adhered in inflamed cervical spinal cord microvessels (white) of WT or ODC-OVA mice 60 min post-infusion on day 7 after viral infection. Pictures are depicted as maximum intensity projection of 100 μm thick Z-stacks. See Supplementary Movie 7. F Violin plots for crawling speeds (μm/min) of CMFDA-labeled effector CD8+ T cells generated from either OT-I, P14 or CL4 TCR-transgenic mice as observed in WT C57BL/6 J or ODC-OVA mice at day 7 after induction of autoimmune neuroinflammation or during EAE. Prior to the intravital imaging, in vitro activated CD8+ T cells were injected into the circulation. Data were pooled from 3 mice/condition and each dot represent one CD8+ T cell track. Data were analyzed using two-sided unpaired parametric t test. G Crawling speed of recirculating in vivo activated tdTomato+ OT-I cells injected 24 h prior to LCMV-OVA infection in WT C57BL/6 J and ODC-OVA mice at day 7 after LCMV-OVA infection. Violin plots summarize data from 196 OT-I cells in WT mice and 991 OT-I cells in ODC-OVA mice. Data were analyzed using two-sided un-paired parametric t test. H Violin plots for crawling speed (μm/min) of in vitro activated CMFDA-labeled OT-I cells in the cervical spinal cord microvasculature lacking expression of TAP1 (TAP1 BBB-KO) or not (TAP1-BBB-Control). TAP1- BBB KO mice (green): BBB-specific deletion of TAP1 in ODC-OVA// TAP1floxed/floxed mice by injection of the AAV-BR1-CAG-Cre viral vector two weeks prior to induction of autoimmune neuroinflammation. TAP1-BBB-Control (red): ODC-OVA//TAP1WT/WT mice injected with AAV-BR1-CAG-Cre and ODC-OVA//TAP1floxed/floxed mice injected with AAV-BR1-CAG-GFP. OT I cells were injected prior to intravital imaging. Data are pooled from imaging of 3 TAP1 BBB-KO mice and 6 TAP1-BBB-Control mice and analyzed using two-sided unpaired parametric t test. I Brains from VE-Cadherin-GFP ODC-OVA or VE-Cadherin-GFP control mice were harvested on day 7 after LCMV-OVA infection. Immunofluorescence staining for IgG and nuclei (DAPI). The endogenous GFP signal marks vascular adherens junctions. Data are representative of 5 individual stainings from 3 different mice derived from 3 individual experiments. Source data from (C, D, F, G and H) are provided as a Source Data file.
Fig. 8
Fig. 8. Leptomeningeal and perivascular border-associated macrophages efficiently take up CSF ovalbumin in vivo.
2P-IVM imaging of the cervical spinal cord leptomeninges of naïve WT C57BL/6 J mice (A) or ODC-OVA mice on day 7 after induction of autoimmune neuroinflammation (B) 2 h after injection of 2 μg of OVA-AF488 into the cisterna magna (rate 1 μL/min) is shown. Images show OVA-AF488 (green) and second harmonic generation (blue) generated by collagen type I in the dura mater and the extracellular matrix in the subpial space. Scale bar = 100 μm. C Immunofluorescence staining for laminin (gray) on 20 μm thick cryosection from brains isolated from healthy WT C57BL/6 J mice 4 h after cisterna magna injection of 2 μg OVA-AF488 (rate 1 μL/min) (green) is shown. Left panel shows cellular uptake of OVA-AF488 in the leptomeninges and the right panel in perivascular spaces. Representative data from 2 mice/genotype.

References

    1. Gold R, Linington C, Lassmann H. Understanding pathogenesis and therapy of multiple sclerosis via animal models: 70 years of merits and culprits in experimental autoimmune encephalomyelitis research. Brain. 2006;129:1953–1971. doi: 10.1093/brain/awl075. - DOI - PubMed
    1. Fugger L, Friese MA, Bell JI. From genes to function: the next challenge to understanding multiple sclerosis. Nat. Rev. Immunol. 2009;9:408–417. doi: 10.1038/nri2554. - DOI - PubMed
    1. Lassmann H. Pathogenic mechanisms associated with different clinical courses of multiple sclerosis. Front. Immunol. 2018;9:3116. doi: 10.3389/fimmu.2018.03116. - DOI - PMC - PubMed
    1. Huseby ES, Huseby PG, Shah S, Smith R, Stadinski BD. Pathogenic CD8 T cells in multiple sclerosis and its experimental models. Front. Immunol. 2012;3:64. doi: 10.3389/fimmu.2012.00064. - DOI - PMC - PubMed
    1. Saxena A, Martin-Blondel G, Mars LT, Liblau RS. Role of CD8 T cell subsets in the pathogenesis of multiple sclerosis. FEBS Lett. 2011;585:3758–3763. doi: 10.1016/j.febslet.2011.08.047. - DOI - PubMed

Publication types

MeSH terms

Substances