. 2023 May 30;14(1):3109.
doi: 10.1038/s41467-023-38563-w.

Antibody blockade of Jagged1 attenuates choroidal neovascularization

Affiliations

Antibody blockade of Jagged1 attenuates choroidal neovascularization

Torleif Tollefsrud Gjølberg et al. Nat Commun. .

Abstract

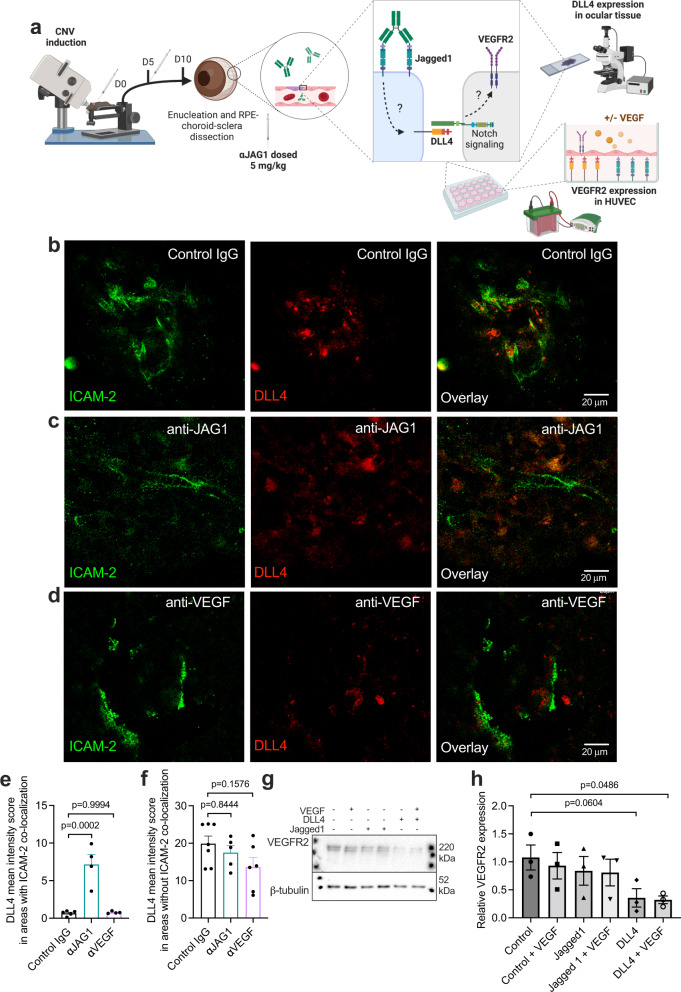
Antibody-based blocking of vascular endothelial growth factor (VEGF) reduces choroidal neovascularization (CNV) and retinal edema, rescuing vision in patients with neovascular age-related macular degeneration (nAMD). However, poor response and resistance to anti-VEGF treatment occurs. We report that targeting the Notch ligand Jagged1 by a monoclonal antibody reduces neovascular lesion size, number of activated phagocytes and inflammatory markers and vascular leakage in an experimental CNV mouse model. Additionally, we demonstrate that Jagged1 is expressed in mouse and human eyes, and that Jagged1 expression is independent of VEGF signaling in human endothelial cells. When anti-Jagged1 was combined with anti-VEGF in mice, the decrease in lesion size exceeded that of either antibody alone. The therapeutic effect was solely dependent on blocking, as engineering antibodies to abolish effector functions did not impair the therapeutic effect. Targeting of Jagged1 alone or in combination with anti-VEGF may thus be an attractive strategy to attenuate CNV-bearing diseases.


Conflict of interest statement

E.S. has received lecture fees from Allergan and consultancy fees from Sanofy Genzyme. M.C.M. has been a member of advisory boards at Bayer, Novartis, Roche and Allergan and has received lecture fees from Bayer and Roche. T.T.G. and J.T.A. have ownership interests in Authera AS. The remaining authors declare no competing interests.

Figures

Fig. 1
Fig. 1. Jagged1 is expressed in ocular blood vessels, pericytes and monocytes, and is unaffected by VEGF stimuli in HUVECs.
a Illustration of methodology. CNV was induced at day 0 by laser treatment of C57BL/6 J mice. At day 10, eyes were enucleated and dissected into RPE/choroidal-sclera flat mounts. Separately, HUVECs were stimulated with VEGF in culture. The illustration was created with Biorender.com. bd Immunostaining of RPE/choroidal-sclera flat mounts following CNV induction in C57BL/6 J mice, showing colocalization of Jagged1 (red) with green ICAM-2 (b), NG2 (c), and IBA-1 (d). Images in bd were taken with a confocal microscope using the appropriate excitation and emission filters for each fluorophore. e Immunostaining of ocular tissue with dry age-related maculopathy and pigment changes. Immunoreactivity is observed in endothelial cells of choroidal arteries (arrow) and in smooth muscle cells lining the vessel (arrowhead). f Immunostaining of ocular tissue from a normal human eye. As in e, both endothelial cells of choroidal arteries (arrow) and surrounding smooth muscle cells (arrowhead) display immunoreactivity. Immunostaining procedures yielding representative images shown in bf were performed twice in individual experiments. gj HUVECs cultured for 48 hours and starved for 24 hours after seeding, before treatment with g, h increasing concentrations of human VEGF and/or i, j bevacizumab or control IgG for 24 hours. Images in g, i show representative western blots showing Jagged1, DLL4, and β-tubulin in HUVECs under the specified conditions. Graphs in h, j show the quantification of bands exemplified in g, i, displaying relative intensity of Jagged1 and DLL4 when normalized against β-tubulin. Data are means ± SEM representing measurements from three individual experiments. Source data are provided as a Source Data file.
Fig. 2
Fig. 2. Antibody targeting of Jagged1 reduces laser-induced choroidal neovascularization and vascular leakage.
a Illustration of methodology. Antibodies were administered as indicated; after laser injury and at day 5. Vascular leakage was measured by fluorescein angiography performed at days 5 and 10 after CNV induction while laser scars visualized by immunofluorescence 10 days after photocoagulation in RPE-choroid-sclera flat mounts. Endothelial cells were labeled with rat anti-mouse ICAM-2. The illustration was created with Biorender.com. be Representative late phase (13 min) fluorescein angiograms of b, d control IgG-treated or c, e anti-JAG1 treated mice (5 mg/kg) 5 days (b, c) or 10 days (d, e) after CNV induction. f Mean leakage areas measured 5 or 10 days after CNV induction. Anti-JAG1 reduced vascular leakage at day 10 (n = 6 eyes from six individual mice per bar (two-tailed, unpaired Student’s t test). g Illustration of methodology. Antibodies were administered as indicated, after laser injury, and at day 5, and day 10, eyes were enucleated and lesion size quantified by microscopy analysis on RPE/choroidal-sclera flat mounts. The illustration was created with Biorender.com. hj Representative images of CNV in h control-, i anti-JAG1.b70 treated mice or j anti-JAG1 HMJ1-29-treated mice. k Quantification of lesion size following treatment with 5 mg/kg of either control antibody, anti-JAG1 or anti-JAG1 HMJ1-29 (n = 10 eyes from 6 individual mice for the control IgG group, 11 eyes from 6 individual mice for the anti-JAG1.b70 group, and 12 eyes from 6 individual mice for the anti-JAG1 HMJ1-29 group. (one-way ANOVA, Dunnett’s multiple comparison test). Jagged1 targeting significantly reduced CNV area. l Significant reduction in lesion size following treatment with 5 mg/kg anti-VEGF (n = 10 eyes from 6 individual mice for the control IgG group, and 12 eyes from 6 individual mice in the anti-VEGF group). Bar graphs in f, k, and l show mean values and SEM (two-tailed, unpaired Student’s t test). Source data are provided as a Source Data file.
Fig. 3
Fig. 3. Antibody targeting of Jagged1 ameliorates microgliosis and reduces inflammatory traits in an angiogenic inflammation model.
a Illustration of methodology. Antibodies were administered as indicated after laser injury and at day 5. At day 10, eyes were enucleated, dissected, and immunostained for phagocyte characterization in RPE/choroidal-scleral flat mounts. Eyes used for cyto- and chemokine quantification assays were enucleated at day 4. The illustration was created with Biorender.com. b, e Representative IBA-1 staining of RPE/choroidal flat mounts detecting microglia/macrophages in laser spots 10 days after laser coagulation in control mice (b) or anti-JAG1 treated animals (e). IBA-1 is shown in red. Circular selection diameter: 200 µm. c, d Representative images of ramified (c) and ameboid (d) microglia/macrophages in lesions such as shown in b and e. fh Quantification of total (f), ramified- (g) or ameboid-shaped (h) mononuclear phagocytes in laser spots. Values show mean ± SEM (n = 4 eyes from 4 individual mice per column; calculated from a total of 12 and 13 CNV lesions for control IgG and anti-JAG1, respectively (two-tailed, unpaired Student’s t-test). i IBA-1 positive area in images used for cell counting quantified in ImageJ (two-tailed, unpaired Student’s t test). jl Concentrations of cyto- and chemokines in the retina of mice treated with either control IgG or anti-JAG1 were determined with a multiplex assay 4 days after CNV induction. Retinal concentrations of the pro-inflammatory CX3CL1 (j), CXCL16 (k), and TNFa (l) in the presence of anti-JAG1. Data are means ± SEM of duplicate determinations for two pooled samples (three retinas were pooled as one sample) and are the same as those shown in Supplementary Fig. 3a, b (two-tailed, unpaired Student’s t test). Source data are provided as a Source Data file.
Fig. 4
Fig. 4. Antibody targeting of Jagged1 does not reduce light-induced retinal degeneration (LIRD).
a Illustration of methodology. At day 0, mice were injected with fluorescein (at time (T) = 0) 3 minutes prior to a 4-minute exposure to blue light (54,000 Lux) in the right eye (starting at T = 3 minutes), followed by a repositioning and light exposure in the left eye (starting at T = 10 minutes). After light exposure, antibodies were administered as indicated. At day 7, eyes were enucleated and either dissected into retinal or choroid-sclera flat mounts for either monocyte characterization (right eyes), or used for apoptotic measurements by TUNEL assay (left eyes). The illustration was created with Biorender.com. b, c IB4-staining in RPE/choroidal-sclera flat mounts centered on the optic nerve head (ONH) in control mice (b) or anti-JAG1 treated animals (c). d Quantification of IB4-positive area in flat-mounts exemplified in b, c. Data are means ± SEM and represents 4 eyes from 4 individual mice treated with anti-JAG1 and 7 eyes from 7 individual mice treated with control IgG (two-tailed, unpaired Student’s t test). e, f IB4-staining in retinal flat-mounts in control mice (e) or anti-JAG1 treated animals (f). g Quantification of IB4-positive area in flat-mounts exemplified in e and f. Data are means ± SEM and represents 3 eyes from 3 individual mice treated with anti-JAG1 and 5 eyes from 5 individual mice treated with control IgG (two-tailed, unpaired Student’s t test). hj Representative images from control animals after LIRD, showing h; hematoxylin and eosin (H&E) stained) whole eye, the neuroretina with nuclei stained in blue using hematoxylin (i) showing the ganglion cell layer (GCL), inner nuclear layer (INL), and the outer nuclear layer (ONL), and the neuroretina stained with TUNEL assay (j). Arrowheads indicate TUNEL positive/apoptotic cells. km Representative images from animals treated with anti-JAG1. np Quantification of (n) ONL thickness and (o) ratio of ONL/INL thickness in retinas exemplified in i and l and (p) TUNEL-positive cells exemplimfied in j, m. Data are means ± SEM of triplicate analysis of three eyes from three individual mice per column (two-tailed, unpaired Student’s t test). Source data are provided as a Source Data file.
Fig. 5
Fig. 5. Antibody targeting of Jagged1 does not alter target expression.
a Illustration of methodology. Antibodies were administered as indicated at days 0 and 5. Eyes were enucleated at day 10 and Jagged1 expression analyzed by confocal microscopy in RPE/choroidal-sclera flat mounts. The illustration was created with Biorender.com. bd Immunostaining of RPE/choroidal-sclera flat mounts following CNV induction, showing ICAM-2 (green) and Jagged1 (red) in mice treated with b control IgG, c anti-JAG1 or d anti-VEGF. e Quantification of ICAM-2 – Jagged1 mean intensity score in sections exemplified in bd. f Jagged1 mean intensity score in areas without ICAM-2 colocalization in images exemplified in bd. Data represents means ± SEM of three eyes in total from three individual mice per treatment. Data in e, f were compared by one-way ANOVA with Šídák’s multiple comparisons test. Source data are provided as a Source Data file.
Fig. 6
Fig. 6. Antibody targeting of Jagged1 results in upregulation of DLL4 in vivo.
a Illustration of methodology. Antibodies were administered as indicated at days 5 and 10, before enucleation and analysis of DLL4 expression in RPE/choroidal-sclera flat mounts by confocal microscopy. Separately, HUVECs were cultivated in wells coated with directionally captured DLL4 or Jagged1. Following stimulation with VEGF, the cellular expression of VEGFR2 was analyzed by Western blot. The illustration was created with Biorender.com. bd Immunostaining of RPE/choroidal-sclera flat mounts following CNV induction, showing ICAM-2 (green) and Dll4 (red) in mice treated with b control IgG, c anti-JAG1 or d anti-VEGF. e Quantification of ICAM-2 – Dll4 mean intensity score in sections exemplified in bd. Data represents means ± SEM of from 3 individual mice per treatment. f DLL4 mean intensity score in exclusively non-ICAM-2 co-localizing areas in images exemplified in bd. g Western blot analysis of VEGFR2 expression and β-tubulin in HUVECs grown on either DLL4 or Jagged1, in the absence or presence of VEGF stimuli. h Quantification in ImageLab 4.1 of VEGFR2 bands exemplified in f, normalized against β-tubulin. Data represent means ± SEM of three individual experiments per column. Data in e, f, h were compared by one-way ANOVA with Šídák’s multiple comparisons test. Source data are provided as a Source Data file.
Fig. 7
Fig. 7. Circulatory properties of antibodies targeting Jagged1 and VEGF.
a Illustration of methodology. Antibodies were administered as indicated, at day 0, either in non-laser-treated mice or after CNV induction. Antibody concentrations were determined in blood samples obtained at the indicated timepoints. The illustration was created with Biorender.com. b Log-linear decrease in plasma levels (signified by the solid lines, calculated by regression; R2 < 0.8 in all shown cases) of anti-JAG1 and anti-VEGF dosed at 5 mg/kg (HI) with or without (non-CNV) laser treatment and 0.5 mg/kg (MID) with laser treatment. c Bar graph showing averaged molar amounts and standard deviation of anti-JAG1 and following dosage of 5 mg/kg in mice with no laser treatment, and 5 and 0.5 mg/kg in laser-treated mice 24 hours after injection. d Table of calculated plasma half-life values, with the number of individual mice in each group (n) indicated. Graphs b and c show ± SEM, and values in the table (d) show mean values ± SD (two-tailed, unpaired Student’s t test). Source data are provided as a Source Data file.
Fig. 8
Fig. 8. Therapeutic effect of antibody targeting of Jagged1 is additive to anti-VEGF and independent of antibody effector functions.
a Illustration of methodology. Antibodies were administered following CNV induction as indicated, at days 0 and 5. Effector-negative antibodies were generated as PGLALA variants. At day 10, eyes were enucleated and lesion size in RPE/choroidal-sclera flat mounts was quantified. The illustration was created with Biorender.com. b Lesion size quantification following treatment with either 0.5 mg/kg anti-VEGF, 5 mg/kg anti-JAG1 or both antibodies combined compared to 5 mg/kg control antibody (n = 10 individual mice per group (one-way ANOVA with Šídák’s multiple comparisons test). c Quantification of lesion size following treatment with 5 mg/kg of WT and effector-negative PGLALA-engineered anti-VEGF and anti-JAG1 mIgG2a antibodies (n = 8 individual mice per group (two-tailed, unpaired Student’s t test). Values from lesion size quantification (b, c) show mean ± SEM. Source data are provided as a Source Data file.

References

    1. Ambati J, Fowler BJ. Mechanisms of age-related macular degeneration. Neuron. 2012;75:26–39. doi: 10.1016/j.neuron.2012.06.018. - DOI - PMC - PubMed
    1. Wong WL, et al. Global prevalence of age-related macular degeneration and disease burden projection for 2020 and 2040: a systematic review and meta-analysis. Lancet Glob. Health. 2014;2:e106–e116. doi: 10.1016/S2214-109X(13)70145-1. - DOI - PubMed
    1. Chen M, Xu H. Parainflammation, chronic inflammation, and age-related macular degeneration. J. Leukoc. Biol. 2015;98:713–725. doi: 10.1189/jlb.3RI0615-239R. - DOI - PMC - PubMed
    1. Ambati J, Atkinson JP, Gelfand BD. Immunology of age-related macular degeneration. Nat. Rev. Immunol. 2013;13:438–451. doi: 10.1038/nri3459. - DOI - PMC - PubMed
    1. Lopez PF, et al. Pathologic features of surgically excised subretinal neovascular membranes in age-related macular degeneration. Am. J. Ophthalmol. 1991;112:647–656. doi: 10.1016/S0002-9394(14)77270-8. - DOI - PubMed

Publication types

MeSH terms

Substances