. 2023 May 30;8(1):27.
doi: 10.1038/s41536-023-00301-7.

Cerebral organoids transplantation repairs infarcted cortex and restores impaired function after stroke

Affiliations

Cerebral organoids transplantation repairs infarcted cortex and restores impaired function after stroke

Shi-Ying Cao et al. NPJ Regen Med. .

Abstract

Stroke usually causes prolonged or lifelong disability, owing to the permanent loss of infarcted tissue. Although a variety of stem cell transplantation has been explored to improve neuronal defect behavior by enhancing neuroplasticity, it remains unknown whether the infarcted tissue can be reconstructed. We here cultured human cerebral organoids derived from human pluripotent stem cells (hPSCs) and transplanted them into the junction of the infarct core and the peri-infarct zone of NOD-SCID mice subjected to stroke. Months later, we found that the grafted organoids survived well in the infarcted core, differentiated into target neurons, repaired infarcted tissue, sent axons to distant brain targets, and integrated into the host neural circuit and thereby eliminated sensorimotor defect behaviors of stroke mice, whereas transplantation of dissociated single cells from organoids failed to repair the infarcted tissue. Our study offers a new strategy for reconstructing infarcted tissue via organoids transplantation thereby reversing stroke-induced disability.


Conflict of interest statement

The authors declare no competing interests.

Figures

Fig. 1
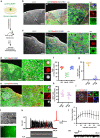
Fig. 1. Grafted human cerebral organoids recapitulate characteristics of the cerebral cortex in stroke mice.
a Representative image showing the cerebral cortex of mice stained with GFAP on d 3 after stroke. The area outlined by the white dotted line indicates the infarct core. Scale bar, 200 μm. b Diagram showing human cerebral organoids transduced with LV-EF1a-EGFP and their transplantation, timeline of immunostaining. c Diagram showing the site of the organoids transplant. d Schematic showing corticogenesis of developing human cerebral cortex. eh Images showing GFP+ grafts expressing VZ markers PAX6 and SOX2 and subplate marker TBR2 at 45 d after transplantation. im Images showing GFP+ grafts expressing deeper layers markers TBR1, FOXP2 and CTIP2 and upper layers markers SATB2 and BRN2 at 60 d after transplantation. Images showing GFP+ grafts expressing NeuN (n), CaMKII (o), STEM123 (p) GABA (q) and Ki67 (r) at 60 d after transplantation. Images showing GFP+ grafts expressing STEM121 (s) Syn (t) at 80 d after transplantation. Scale bars, en and r, 50 μm, oq and s, 20 μm, t, 20 μm. HO Hoechst 33258 dye.
Fig. 2
Fig. 2. Survival and differentiation and functions of grafted human cerebral organoids in the infarct core of stroke mice.
a Design of the experiments for bm. Representative images showing the coronal section stained with STEM123 and GFAP in animal A (b) or with NeuN and GFAP in animal B (c) on d 180 after organoids transplantation, in which, b1 and c1 showing infarct area (scale bar, 200 μm), b2 and c2 showing the survival of organoids (scale bar, 200 μm), the boxed area in b2 and c2 was shown in high magnification in b3 and c3 respectively (scale bar, 50 μm), the boxed area in b3 and c3 was shown in high magnification in b4 and c4 respectively (scale bar, 5 μm). Representative images showing HN+ graft cells co-labeled with NeuN (d) or GFAP (e) (left, scale bar, 200 μm) on d 180 after transplantation. The boxed area in leftward image was shown in high magnification on the middle image (scale bar, 50 μm), and the boxed area in middle image was shown in high magnification on the right three panels (scale bar, 5 μm). fh Bar graphs show cerebral organoids’ cellular composition at 180 d after transplantation. n = 6 animals. More than 4,500 cells from random fields were manually counted in each condition. i Representative image showing organoids neurons (GFP+) and astrocytes (GFAP+) (upper, scale bar, 50 μm) and high magnification images from a selected area in the upper image (lower, scale bar, 20 μm) at 180 d after transplantation. j Images showing whole-cell patch-clamp recordings from organoids neurons (GFP+). Black dotted lines indicate electrode. Scale bar, 40 μm. k Voltage traces showing APs from GFP+ neuron in response to current-step, in which, red traces showing the first AP induced by 0 pA injected current. l Number of APs evoked by various current steps from GFP+ neurons. n = 13 neurons from 5 mice. m Representative traces of sPSCs from the organoids neurons. n = 34 neurons from 7 mice. In be, the area outlined by the yellow dotted line indicates the infarct core. In fh and l, data were presented as mean ± standard deviation. HO Hoechst 33258 dye, HN Human Nuclei.
Fig. 3
Fig. 3. Grafted cerebral organoids extend long-distance projections to specific brain areas in stroke mice 180 days after transplantation.
a Schematic showing the GFP+ grafts in the infarct core and peri-infarct area on the coronal sections of brain (middle), and images showing graft-derived projections in the contralateral and ipsilateral corpus callosum (CC), hippocampus (Hip) (upper) and striatum (Str), ipsilateral S2 and internal capsule (IP). Scale bar, 50 μm. b Schematic showing the GFP+ grafts in the infarct core and peri-infarct area on the sagittal sections of brain (middle), and images showing graft-derived projections in the CC, and striatum, IC, cerebral peduncle (CP), ventral posterior thalamic nucleus (VP), spinal trigeminal nucleus (Sp5) and brainstem. Scale bar, 20 μm.
Fig. 4
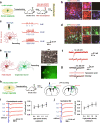
Fig. 4. The grafted organoid neurons receive synaptic input from host cells and synaptic efferent from the organoid neurons to distant host neurons.
a Design of the experiments for bg. b A representative image showing that mCherry+ cells were not co-labeled with HN (left, scale bar, 20 μm) and high magnification images from a selected area in the leftward image (right, scale bar, 5 μm). c Diagram (left) showing the strategy to evoke APs in the host neuron and APs traces evoked by blue photo stimuli pulses (470 nm, 10 mW/mm2, 5 ms duration) of various frequencies on the ChR2-mCherry-expressing host neuron (right). d A representative image showing mCherry+ fibers extending to GFP+/HN+ human organoids neurons (left, scale bar, 20 μm) and high magnification images from a selected area in the leftward image (right, scale bar, 5 μm). e Diagram (left) showing the strategy to test whether organoids neurons receive synaptic input from host neurons and images (right) showing whole-cell patch-clamp recordings from grafted organoids neurons (GFP+). Black dotted lines indicate the placement of patch-clamp electrode. Scale bar, 20 μm. f Representative traces of PSCs evoked by 1 or 3 blue photo stimuli pulses at a holding potential −65 mV. g Representative traces of PSCs evoked by 1 blue photo stimuli pulse with or without kynurenic acid (α-amino-3-hydroxy-5-methyl-4-isoxazole propionate (AMPA) and N-methyl-D-aspartate (NMDA) receptors blocker). h Design of the experiments for i and j. i, j Cerebral organoids expressing ChR2 were grafted into the junction area between infarct core and peri-infarct zone of stroke mice and blue light-induced LFPs were recorded in the contralateral motor cortex and ipsilateral striatum. i Representative LFP traces recorded in the contralateral motor cortex (left, average of 20 responses) and input-output curves of peak amplitude for LFPs (right) (n = 7 slices from 3 animals). j Representative LFP traces recorded in the ipsilateral striatum (left, average of 20 responses) and input-output curves of peak amplitude for LFPs (right) (n = 6 slices from 3 animals). In f and g, n = 13 neurons from 5 mice, 6 recorded neurons were responsive to photostimulation. In i and j, data were presented as mean ± standard deviation. HO Hoechst 33258 dye, HN Human Nuclei.
Fig. 5
Fig. 5. The transplantation of human cerebral organoids promotes functional recovery from stroke in mice.
a Asymmetry index of forelimbs in the cylinder test (F2,32 = 50.952, ***P < 0.001. ***P < 0.001, NIM/stroke vs sham or NIM/stroke vs organoids/stroke). b Left-foot faults relative to total steps taken in the grid-walking test (F2,32 = 317.196, ***P < 0.001. ***P < 0.001, NIM/stroke vs sham or NIM/stroke vs organoids/stroke). c Latency to touch the sticky dot on left paw in the adhesive-removal test (F2,32 = 27.875, ***P < 0.001. ***P < 0.001, sham vs NIM/stroke; **P = 0.002, NIM/stroke vs organoids/stroke). d Latency to remove the sticky dot on left paw in the adhesive-removal test (F2,32 = 47.683, ***P < 0.001. ***P < 0.001, NIM/stroke vs sham or NIM/stroke vs organoids/stroke). e Design of the experiments for fk. f Image showing mCherry-positive cells in the infarct core (left, scale bar, 50 μm), high magnification images from a selected area in the leftward image (middle, scale bar, 5 μm) and bar graph showing ratio of mCherry+/HN+ cells to HN+ cells (right). n = 6 animals. g In the neurons expressing hM4Di-mCherry, bath application of CNO completely abolished cell discharge of action potentials and this effect was reversed after CNO washout. h Asymmetry index of forelimbs in the cylinder test (F3,45 = 15.679, ***P < 0.001. *P = 0.014, ***P < 0.001). i Left-foot faults relative to total steps taken in the grid-walking test (F3,45 = 189.858, ***P < 0.001. ***P < 0.001). j Touch latency (F3,45 = 0.062, P = 0.062. P > 0.05, between groups) in the adhesive-removal test. k Remove latency (F3,45 = 9.790, ***P < 0.001. *P = 0.033, ***P < 0.001) in the adhesive-removal test. NIM neural induction medium, HN Human Nuclei. In ad, f and hk, data were presented as mean ± standard deviation.

References

    1. George PM, Steinberg GK. Novel stroke therapeutics: unraveling stroke pathophysiology and its impact on clinical treatments. Neuron. 2015;87:297–309. doi: 10.1016/j.neuron.2015.05.041. - DOI - PMC - PubMed
    1. Dhamoon MS, Longstreth WT, Jr., Bartz TM, Kaplan RC, Elkind MSV. Disability Trajectories Before and After Stroke and Myocardial Infarction: The Cardiovascular Health Study. JAMA Neurol. 2017;74:1439–1445. doi: 10.1001/jamaneurol.2017.2802. - DOI - PMC - PubMed
    1. Emberson J, et al. Effect of treatment delay, age, and stroke severity on the effects of intravenous thrombolysis with alteplase for acute ischaemic stroke: a meta-analysis of individual patient data from randomised trials. Lancet. 2014;384:1929–1935. doi: 10.1016/S0140-6736(14)60584-5. - DOI - PMC - PubMed
    1. Goyal M, et al. Endovascular thrombectomy after large-vessel ischaemic stroke: a meta-analysis of individual patient data from five randomised trials. Lancet. 2016;387:1723–1731. doi: 10.1016/S0140-6736(16)00163-X. - DOI - PubMed
    1. Ni HY, et al. Dissociating nNOS (Neuronal NO Synthase)-CAPON (Carboxy-Terminal Postsynaptic Density-95/Discs Large/Zona Occludens-1 Ligand of nNOS) Interaction Promotes Functional Recovery After Stroke via Enhanced Structural Neuroplasticity. Stroke. 2019;50:728–737. doi: 10.1161/STROKEAHA.118.022647. - DOI - PubMed