. 2023 May 30;13(1):8771.
doi: 10.1038/s41598-023-35399-8.

Contribution of local and surrounding anthropogenic emissions to a particulate matter pollution episode in Zhengzhou, Henan, China

Affiliations

Contribution of local and surrounding anthropogenic emissions to a particulate matter pollution episode in Zhengzhou, Henan, China

Yaobin Wang et al. Sci Rep. .

Abstract

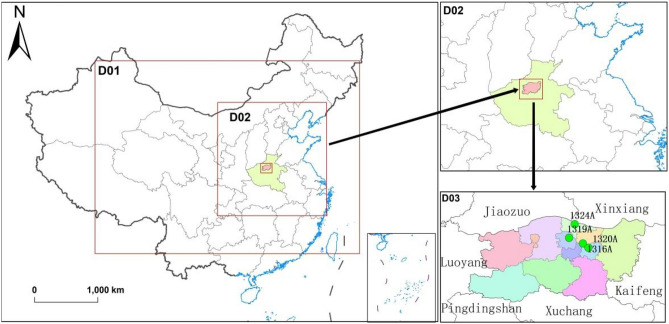
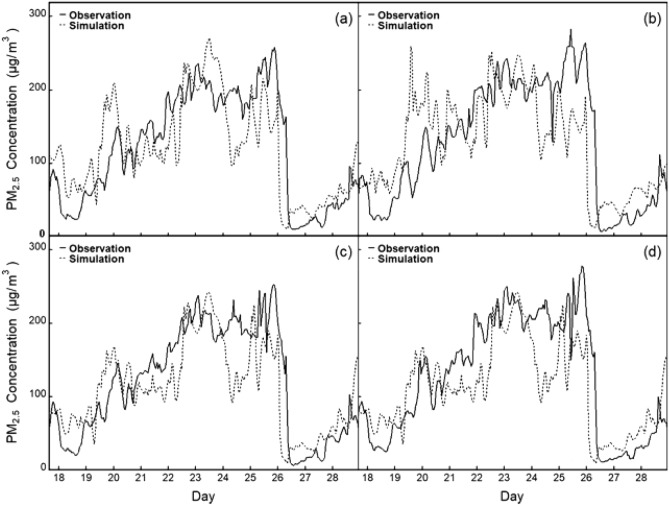
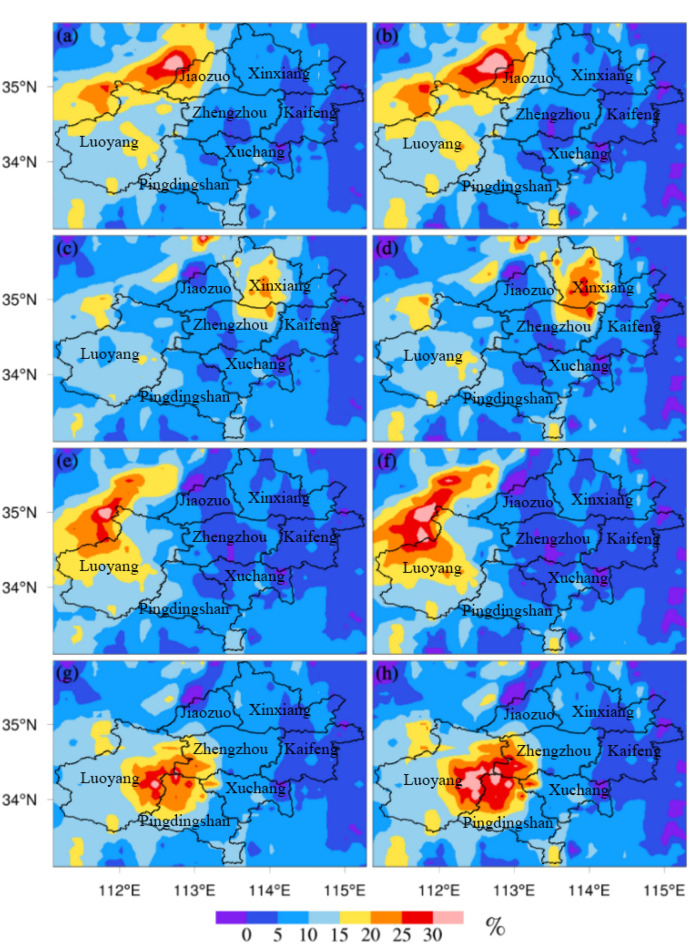
In this study, we simulated the spatial and temporal processes of a particulate matter (PM) pollution episode from December 10-29, 2019, in Zhengzhou, the provincial capital of Henan, China, which has a large population and severe PM pollution. As winter is the high incidence period of particulate pollution, winter statistical data were selected from the pollutant observation stations in the study area. During this period, the highest concentrations of PM2.5 (atmospheric PM with a diameter of less than 2.5 µm) and PM10 (atmospheric PM with a diameter of less than 10 µm) peaked at 283 μg m-3 and 316 μg m-3, respectively. The contribution rates of local and surrounding regional emissions within Henan (emissions from the regions to the south, northwest, and northeast of Zhengzhou) to PM concentrations in Zhengzhou were quantitatively analyzed based on the regional Weather Research and Forecasting model coupled with Chemistry (WRF/Chem). Model evaluation showed that the WRF/Chem can accurately simulate the spatial and temporal variations in the PM concentrations in Zhengzhou. We found that the anthropogenic emissions south of Zhengzhou were the main causes of high PM concentrations during the studied episode, with contribution rates of 14.39% and 16.34% to PM2.5 and PM10, respectively. The contributions of anthropogenic emissions from Zhengzhou to the PM2.5 and PM10 concentrations in Zhengzhou were 7.94% and 7.29%, respectively. The contributions of anthropogenic emissions from the area northeast of Zhengzhou to the PM2.5 and PM10 concentrations in Zhengzhou were 7.42% and 7.18%, respectively. These two areas had similar contributions to PM pollution in Zhengzhou. The area northeast of Zhengzhou had the lowest contributions to the PM2.5 and PM10 concentrations in Zhengzhou (5.96% and 5.40%, respectively).


Conflict of interest statement

The authors declare no competing interests.

Figures

Figure 1
Figure 1
Simulation domain configuration of the WRF/Chem model.
Figure 2
Figure 2
Hourly variations in observed (solid lines) and simulated (dashed lines) PM2.5 concentrations at four monitoring sites in Zhengzhou during December 18–29, 2020. (a is the verification of observed and simulated values at 1316A station; b is the verification of observed and simulated values at 1319A station; c is the verification of observed and simulated values at 1320A station; d is the verification of observed and simulated values at 1324A station).
Figure 3
Figure 3
Hourly variations in observed (solid lines) and simulated (dashed lines) PM10 concentrations at four monitoring sites in Zhengzhou during the study period. (a is the verification of observed and simulated values at 1316A station; b is the verification of observed and simulated values at 1319A station; c is the verification of observed and simulated values at 1320A station; d is the verification of observed and simulated values at 1324A station).
Figure 4
Figure 4
Spatial distributions of PM2.5 (a) and PM10 (b) monthly mean concentrations in Zhengzhou.
Figure 5
Figure 5
Spatial and temporal process of PM2.5 concentrations in this pollution episode.
Figure 6
Figure 6
Spatial and temporal process of PM10 concentrations in this pollution episode.
Figure 7
Figure 7
Backward trajectory from December 19 to 27, 2019 (ai represent December 19, December 20, December 21, December 22, December 23, December 24, December 25, December 26 and December 27; the light blue track, green track, dark blue track, and red track indicate the air mass track arriving at 00:00, 06:00, 12:00 and 18:00, respectively).
Figure 8
Figure 8
Spatial distributions of PM monthly mean concentrations under different scenarios (PM2.5: a,c,e,g correspond to scenarios S2, S3, S4, and S5, respectively; PM10: b,d,f,h correspond to scenarios S2, S3, S4, S5, respectively).
Figure 9
Figure 9
Spatial differences in PM concentrations between control scenarios (PM2.5: a,c,e,g denote scenarios S2, S3, S4, and S5, respectively; PM10: b,d,f,h denote scenarios S2, S3, S4, and S5, respectively).
Figure 10
Figure 10
Spatial distributions of the contribution rates of different control scenarios to the PM concentrations in Zhengzhou (PM2.5: a,c,e,g denote scenarios S2, S3, S4, and S5, respectively; PM10: b,d,f,h denote scenarios S2, S3, S4, and S5, respectively).
Figure 11
Figure 11
Contribution rate of anthropogenic emissions over surrounding areas to PM concentration in Zhengzhou.

Similar articles

Cited by

References

    1. Zhang YJ, Cai J, Wang SX, He KB, Zheng M. Review of receptor-based source apportionment research of fine particulate matter and its challenges in China. Sci. Total. Environ. 2017;586:917–929. doi: 10.1016/j.scitotenv.2017.02.071. - DOI - PubMed
    1. Sahu SK, Sharma S, Zhang HL, Chejarla V, Guo H, Hu JL, Ying Q, Xing J, Kota SH. Estimating ground level PM2.5 concentrations and associated health risk in India using satellite based AOD and WRF predicted meteorological parameters. Chemosphere. 2020;255:126969. doi: 10.1016/j.chemosphere.2020.126969. - DOI - PubMed
    1. Liu XM, Song HQ, Lei TJ, Liu PF, Xu CD, Wang D, Yang ZL, Xia HM, Wang TH, Zhao HP. Effects of natural and anthropogenic factors and their interactions on dust events in Northern China. CATENA. 2021;196:104919. doi: 10.1016/j.catena.2020.104919. - DOI
    1. Sharma S, Sharma R, Sahu SK, Kota SH. Transboundary sources dominated PM2.5 in Thimphu, Bhutan. Int. J. Environ. Sci. 2022;19:649–5658. - PMC - PubMed
    1. Li XY, Song HQ, Zhai SY, Lu SQ, Kong YF, Xia HM, Zhao HP. Particulate matter pollution in Chinese cities: Areal-temporal variations and their relationships with meteorological conditions (2015–2017) Environ. Pollut. 2019;246:11–18. doi: 10.1016/j.envpol.2018.11.103. - DOI - PubMed