. 2023 May 30;9(1):52.
doi: 10.1038/s41421-023-00542-2.

TGF-β controls development of TCRγδ+CD8αα+ intestinal intraepithelial lymphocytes

Affiliations

TGF-β controls development of TCRγδ+CD8αα+ intestinal intraepithelial lymphocytes

Jiajia Han et al. Cell Discov. .

Abstract

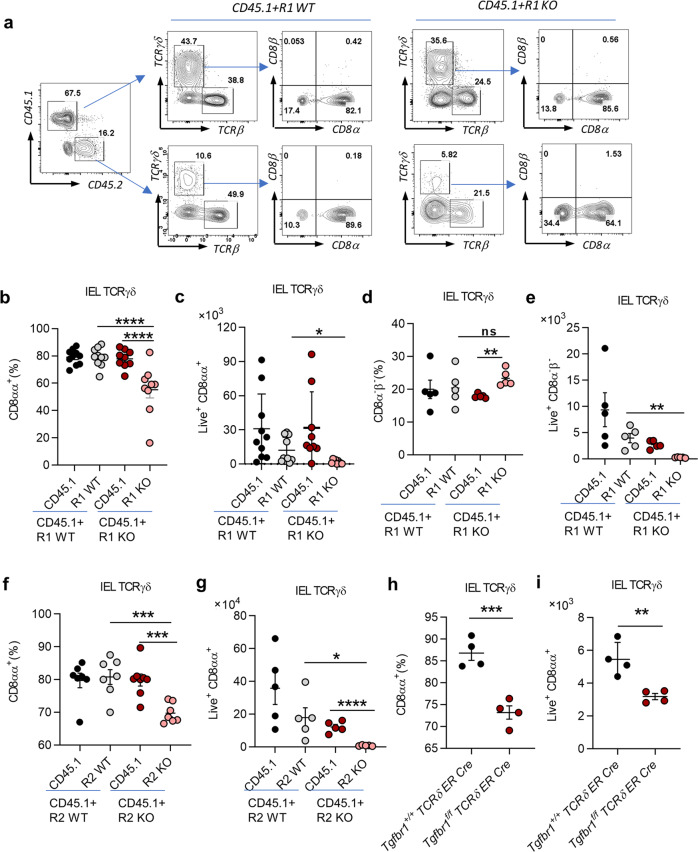
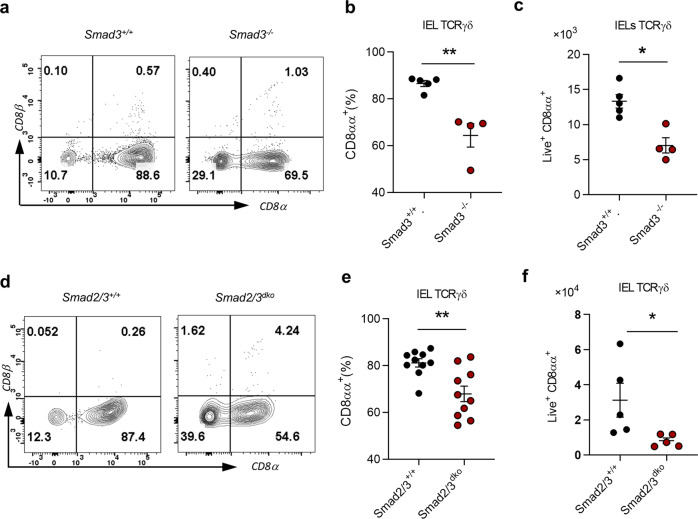
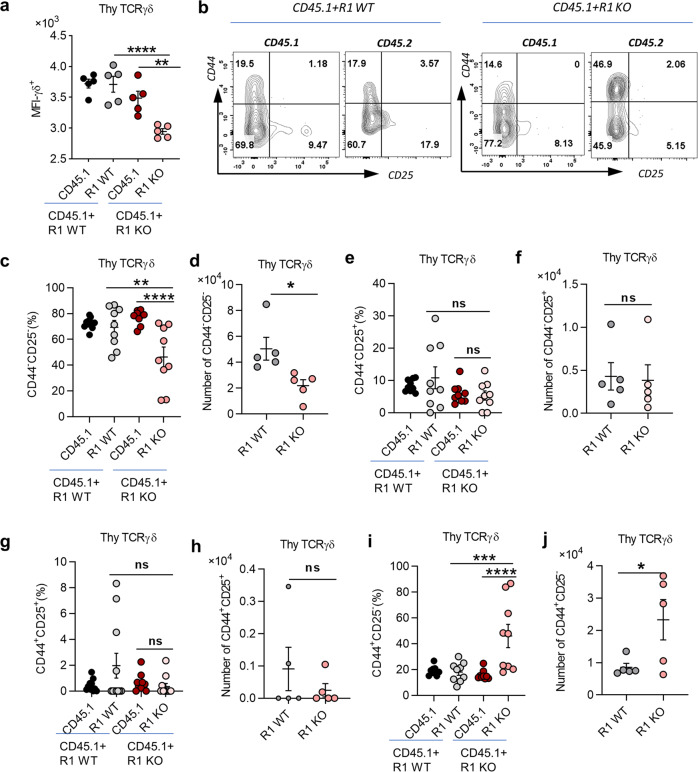
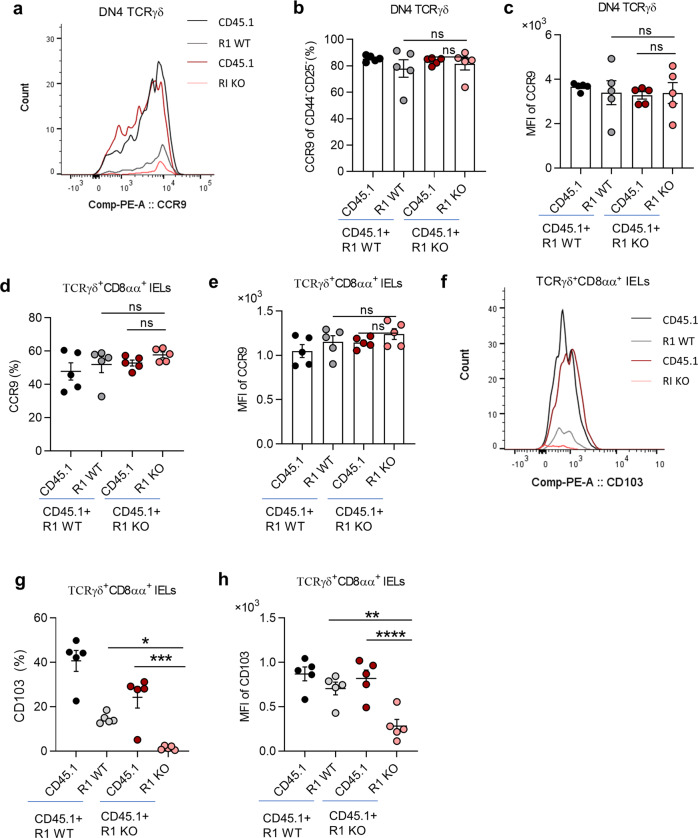
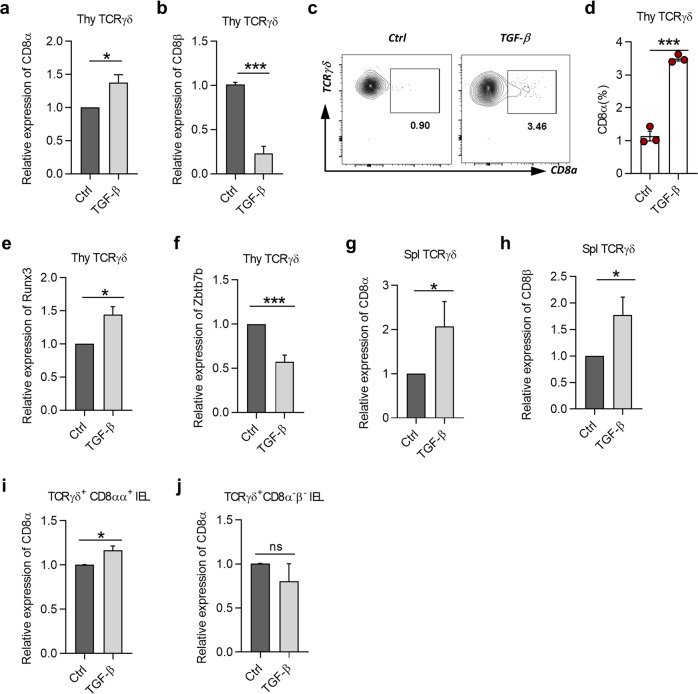
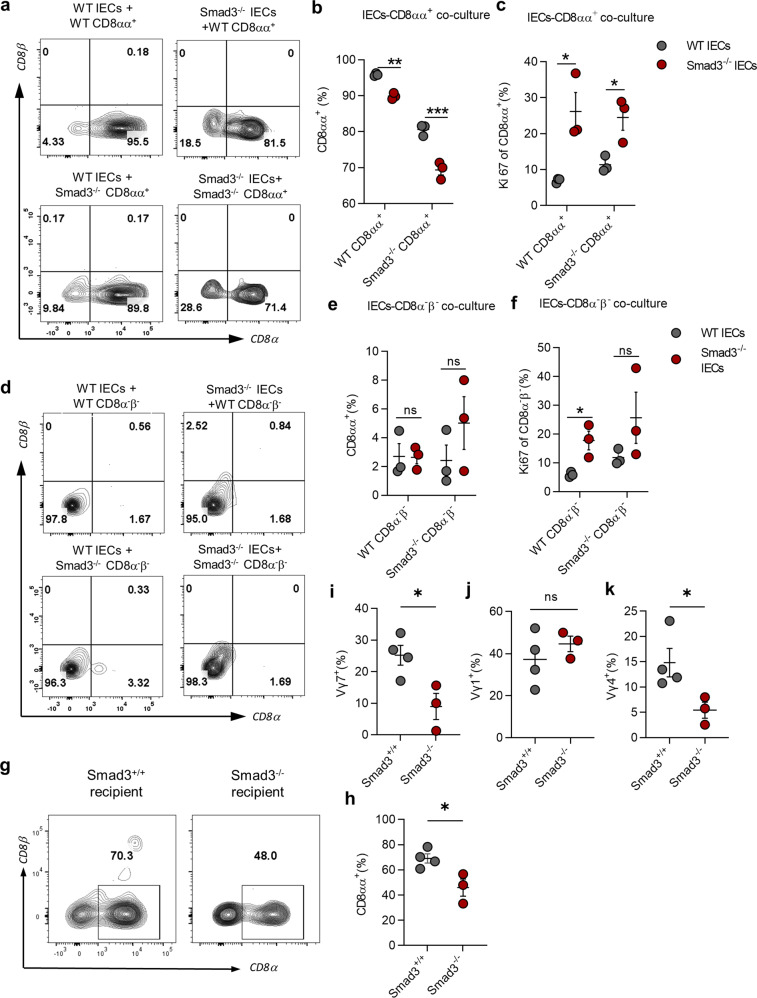
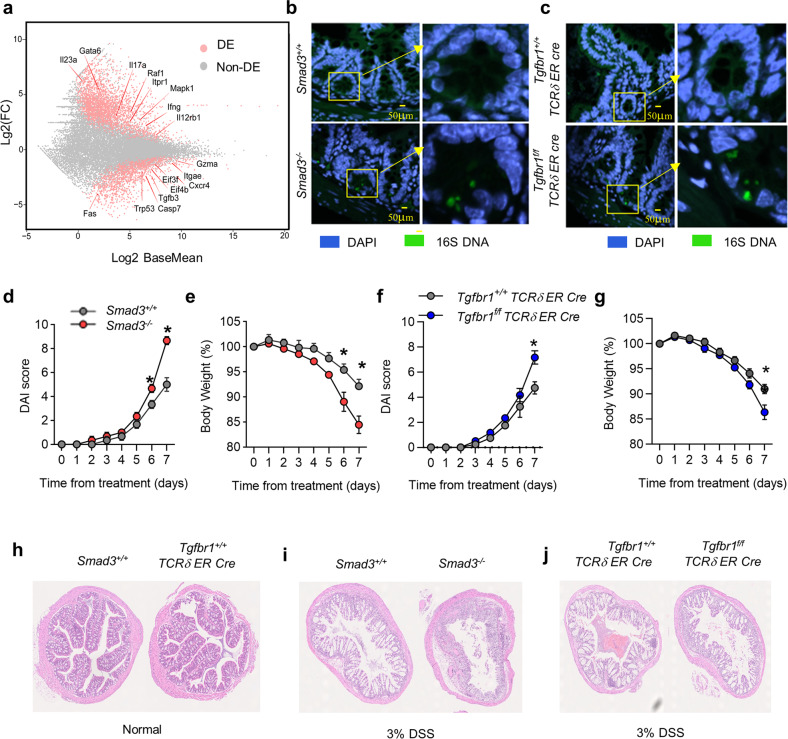
γδ intestinal intraepithelial lymphocytes (IELs) constitute the majority of IELs with unique CD8αα+ homodimers that are distinct from γδT cells in other tissues. However, it remains largely unclear how those cells develop. Here we show that transforming growth factor beta (TGF-β) signaling controls the development of TCRγδ+CD8αα+ IELs. Deletion of TGF-β receptors or Smad3 and Smad2 in bone marrow stem cells caused a deficiency of TCRγδ+CD8αα+ IELs in mixed bone marrow chimeric mice. Mechanistically, TGF-β is required for the development of TCRγδ+CD8αα+ IELs thymic precursors (CD44-CD25- γδ thymocytes). In addition, TGF-β signaling induced CD8α in thymic γδT cells and maintained CD8α expression and survival in TCRγδ+CD8αα+ IELs. Moreover, TGF-β also indirectly controls TCRγδ+CD8αα+ IELs by modulating the function of intestinal epithelial cells (IECs). Importantly, TGF-β signaling in TCRγδ+CD8αα+ IELs safeguarded the integrity of the intestinal barrier in dextran sulfate sodium (DSS)-induced colitis.


Conflict of interest statement

The authors declare no competing interests.

Figures

Fig. 1
Fig. 1. Fewer TCRγδ+CD8αα+ IELs in TGF-β signaling-deficient mice.
a Representative FACS plot of IEL staining from 4–5-week-old CD45.1 + R1 WT and CD45.1 + R1 KO mixed BM chimeric mice. BM cells were from R1 KO (5 days tamoxifen-treated Tgfbr1f/f Esr1-cre) and R1 WT mice (5 days tamoxifen-treated Tgfbr1+/+ Esr1-cre or oil-treated Tgfbr1f/f Esr1-cre) mixed with BM cells from CD45.1 mice. b, c Frequency (b) and absolute number (c) of TCRγδ+CD8αα+ IELs. d, e Frequency (d) and absolute number (e) of TCRγδ+CD8αβ IELs. f, g Frequency (f) and absolute number (g) of TCRγδ+CD8αα+ IELs from R2 KO (5 days tamoxifen-treated Tgfbr2f/f Esr1-cre) and R2 WT (tamoxifen-treated Tgfbr2+/+ Esr1-cre or oil-treated Tgfbr2f/f Esr1-cre) BM chimeric mice. h, i Frequency (h) and absolute number (i) of TCRγδ+CD8αα+ IELs from 5-day-tamoxifen-treated Tgfbr1f/f TCRδ ER Cre mice and age-matched Tgfbr1+/+ TCRδ ER Cre control littermates.*P < 0.05; **P < 0.01; ***P < 0.001; and ****P < 0.0001; ns no significant difference (unpaired two-tailed Student’s t-test or ANOVA). Data were representative of at least four independent experiments (means ± SEM).
Fig. 2
Fig. 2. TGF-β controls TCRγδ+CD8αα+ IELs development in a Smad2/3-dependent way.
a Representative FACS plot of γδ IELs with CD8α and CD8β staining in Smad3−/− and age-matched control littermates (Smad3+/+). b, c Frequency (b) and absolute number (c) of TCRγδ+CD8αα+ IELs. d Representative FACS plot of γδ IELs with CD8α and CD8β staining from mice transferred with BM cells from Smad2/3dko mice (Smad2 and Smad3 double KO, with 5 days of tamoxifen treatment) or Smad2/3+/+ littermates (with 5 days of tamoxifen treatment). e, f Frequency (e) and absolute number (f) of TCRγδ+CD8αα+ IELs from mice in d. *P < 0.05 and **P < 0.01 (unpaired two-tailed Student’s t-test). Data were representative of at least three independent experiments (means ± SEM).
Fig. 3
Fig. 3. Fewer thymic γδ IEL precursors in TGF-β receptor I-deficient mice.
a MFI of thymic γδT cells in the same CD45.1 + R1 WT and CD45.1 + R1 KO BM chimeric model as in Fig. 1a–e. b Representative FACS plot of thymic γδT cells with CD44 and CD25 staining. c, d Statistical results of frequency (c) and absolute number (d) of CD44CD25 population in b. e, f Frequency (e) and absolute number (f) of CD44CD25+ population. g, h Frequency (g) and absolute number (h) of CD44+CD25+ population. i, j Frequency (i) and absolute number (j) of CD44+CD25 population. *P < 0.05; **P < 0.01; ***P < 0.001; and ****P < 0.0001; ns no significant difference (unpaired two-tailed Student’s t-test or ANOVA). Data were representative of at least three independent experiments (means ± SEM).
Fig. 4
Fig. 4. TGF-β regulates CD103 expression in thymic γδT cells and γδ IELs.
a Representative histogram of CCR9 on thymic γδT cells from the same CD45.1 + R1 WT and CD45.1 + R1 KO BM chimeric mice as in Fig. 1a–e. b, c Frequency (b) and MFI (c) of CCR9 on thymic CD44CD25 γδT cells. d, e Frequency (d) and MFI (e) of CCR9 on TCRγδ+CD8αα+ IELs. f–h Representative histogram (f), frequency (g), and MFI (h) of CD103 on TCRγδ+CD8αα+ IELs. *P < 0.05; **P < 0.01; ***P < 0.001; and ****P < 0.0001; ns no significant difference (ANOVA). Data were representative of at least three independent experiments (means ± SEM).
Fig. 5
Fig. 5. TGF-β induces CD8α, but not CD8β expression in γδT cells.
a, b Relative expression of CD8α (a) and CD8β (b) to Hprt in overnight-cultured thymic γδT cells from C57BL/6 J mice in culture conditions of 1 μg/mL anti-CD3 combined with medium only (Ctrl), or in the presence of 2 ng/mL TGF-β1 (TGF-β) or 5 μM SB431542 (SB, TGF-β inhibitor), and detected by quantitative PCR. c Representative plot of 2-day-cultured thymic γδT cells from C57BL/6 J mice with CD8α staining in the presence of IL-2 (100 U/mL) based on culture condition of a to keep cells survive well in long-term culture. d Frequency of CD8α on thymic γδT cells from the same cells as in c. e, f Relative expression of Runx3 (e) and Zbtb7b (Th-Pok) (f) to Hprt in cells with the same culture condition as in a and detected by quantitative PCR. g, h Relative expression of CD8α (g) and CD8β (h) to Hprt on overnight-cultured splenic γδT cells from C57BL/6 J mice in the same culture condition as in a and detected by quantitative PCR. i, j Relative expression of CD8α to Hprt in overnight-cultured TCRγδ+CD8αα+ IELs (i) or TCRγδ+CD8αβ IELs (j) from C57BL/6 J mice detected by quantitative PCR. *P < 0.05 and ***P < 0.001; ns no significant difference (unpaired two-tailed Student’s t-test). Data were representative of at least three independent experiments (means ± SEM).
Fig. 6
Fig. 6. TGF-β indirectly regulates TCRγδ+CD8αα+ IELs by affecting the function of IECs.
a Representative FACS plot of CD8α and CD8β expression on TCRγδ+CD8αα+ IELs co-cultured with IECs in different settings. b, c Frequency of TCRγδ+CD8αα+ IELs population (b) and Ki67 expression on TCRγδ+CD8αα+ IELs (c). d Representative FACS plot of CD8α and CD8β expression on TCRγδ+CD8αβ IELs. e, f Frequency of TCRγδ+CD8αα+ IELs population after co-culture (e) and Ki67 expression on TCRγδ+CD8αβ IELs (f). g Representative FACS plot of CD8α and CD8β expression on γδ IELs of Smad3+/+ or Smad3−/− recipient mice transferred with BM cells from C56BL/6 J mice for a month. h Frequency of CD8αα+ population of γδ IELs from Smad3+/+ and Smad3−/− recipient mice. i–k Frequency of Vγ7 (i), Vγ1 (j), and Vγ4 (k) subsets of γδ IELs from Smad3+/+ and Smad3−/− recipient mice. *P < 0.05 and **P < 0.01; ns no significant difference (unpaired two-tailed Student’s t-test). Data were representative of three independent experiments (means ± SEM).
Fig. 7
Fig. 7. Lack of TGF-β signaling in γδ IELs exacerbates DSS-induced colitis.
a The volcano plot shows the differential expression profile of genes in TCRγδ+CD8αα+ IELs from R1 WT and R1 KO mice and examined by RNA-seq. The gray dots represent non-differentially expressed genes between the two groups, while the upregulated genes in R1 KO mice are pink dots towards the upper end (with log2 fold change value above 0 on the y-axis), and the downregulated genes in R1 KO mice are pink dots towards the lower end (with log2 fold change value below 0 on the y-axis). b FISH visualizes the location of bacteria around the intestinal epithelia in the small intestine of Smad3−/− mice and age-matched littermate controls (Smad3+/+). c FISH visualizes the location of bacteria in the small intestine from 5-day-tamoxifen-treated Tgfbr1f/f TCRδ ER Cre and age-matched Tgfbr1+/+ TCRδ ER Cre littermates. d, e DAI (d) and loss of body weight (e) of Smad3−/− and Smad3+/+ mice treated with 3% DSS drinking water for 7 days. f, g DAI (f) and loss of body weight (g) of Tgfbr1f/f TCRδ ER Cre and Tgfbr1+/+ TCRδ ER Cre control mice treated with DSS for 7 days. h–j Hematoxylin and eosin (H&E) staining for colon from normal Smad3−/− and 5-day-tamoxifen-treated Tgfbr1+/+f TCRδ ER Cre mice (h), and from 3% DSS-treated Smad3−/− vs Smad3+/+ mice in d and e (i), or 3% DSS-treated Tgfbr1f/f TCRδ ER Cre versus Tgfbr1+/+ TCRδ ER Cre mice in f and g (j). *P < 0.05 (unpaired two-tailed Student’s t-test or DEseq2 statistical test). Data were representative of at least two independent experiments (means ± SEM). RNA-seq samples were collected from three or four independent experiments.

References

    1. Olivares-Villagómez D, Van Kaer L. Intestinal intraepithelial lymphocytes: sentinels of the mucosal barrier. Trends Immunol. 2018;39:264–275. doi: 10.1016/j.it.2017.11.003. - DOI - PMC - PubMed
    1. Cheroutre H, Lambolez F, Mucida D. The light and dark sides of intestinal intraepithelial lymphocytes. Nat. Rev. Immunol. 2011;11:445–456. doi: 10.1038/nri3007. - DOI - PMC - PubMed
    1. Edelblum KL, et al. γδ Intraepithelial lymphocyte migration limits transepithelial pathogen invasion and systemic disease in mice. Gastroenterology. 2015;148:1417–1426. doi: 10.1053/j.gastro.2015.02.053. - DOI - PMC - PubMed
    1. Hoytema van Konijnenburg DP, et al. Intestinal epithelial and intraepithelial T cell crosstalk mediates a dynamic response to infection. Cell. 2017;171:783–794.e713. doi: 10.1016/j.cell.2017.08.046. - DOI - PMC - PubMed
    1. Swamy M, et al. Intestinal intraepithelial lymphocyte activation promotes innate antiviral resistance. Nat. Commun. 2015;6:7090. doi: 10.1038/ncomms8090. - DOI - PMC - PubMed