. 2023 May 30;13(1):8720.
doi: 10.1038/s41598-023-36018-2.

Acidified biochar improves lead tolerance and enhances morphological and biochemical attributes of mint in saline soil

Affiliations

Acidified biochar improves lead tolerance and enhances morphological and biochemical attributes of mint in saline soil

Azhar Sohail Shahzad et al. Sci Rep. .

Abstract

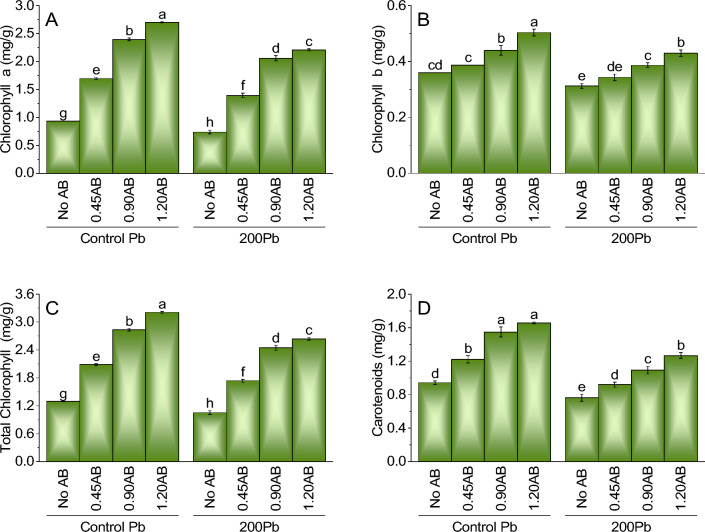
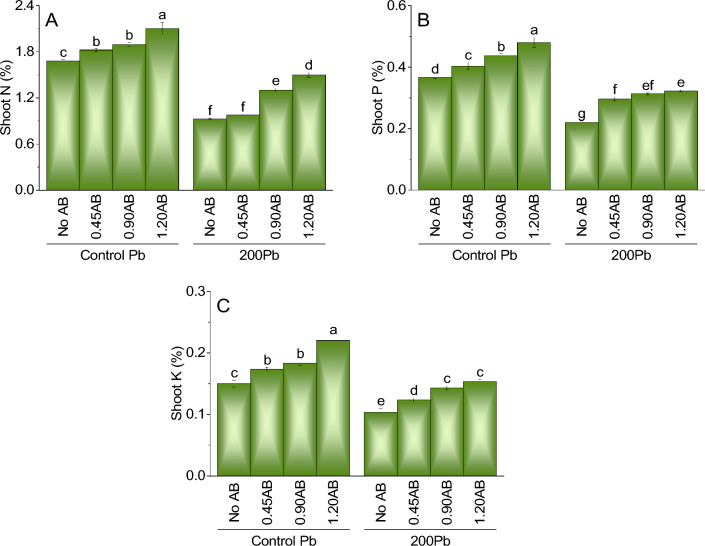
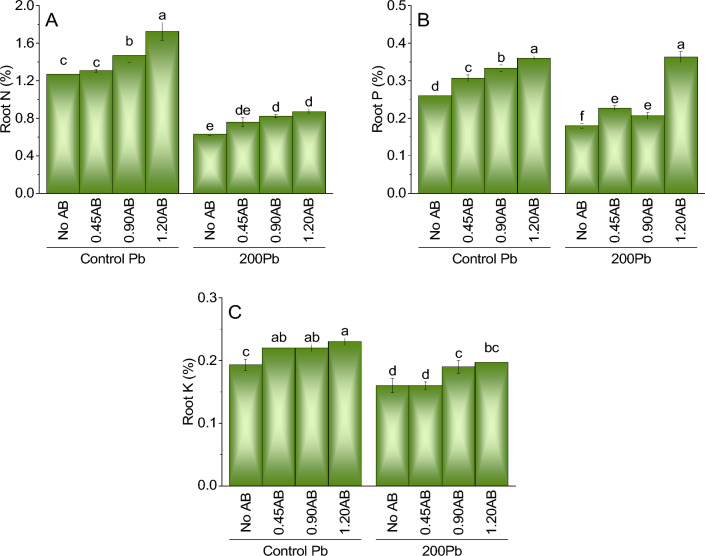
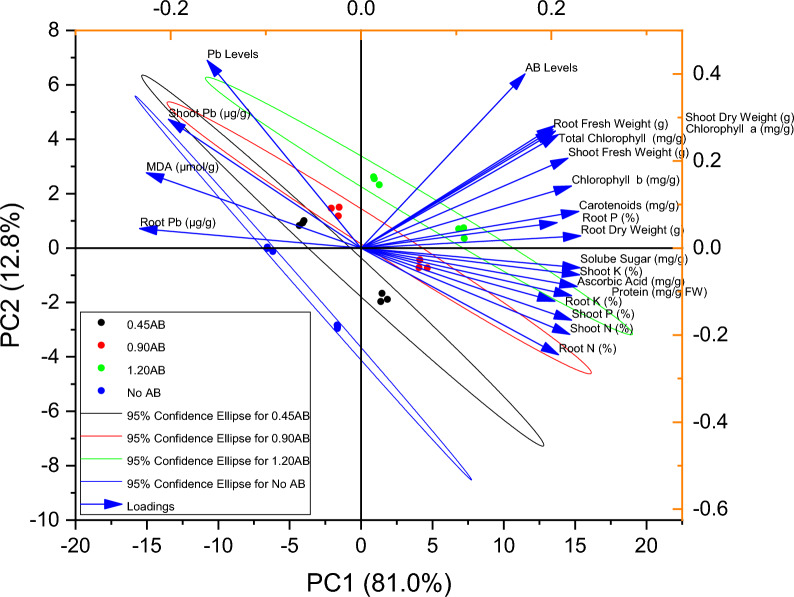
Lead (Pb) toxicity is a significant environmental issue, especially in areas with a past of industrial activities and mining. The existence of Pb in the soil can have negative impacts on plant growth and development, and it can also pose a risk to human health through the food chain. Acidified carbon has shown promise as an effective management technology for mitigating Pb toxicity. This study provides important insights into the potential of acidified biochar as a low-cost and eco-friendly method for managing Pb-contaminated soils. The current study explores the effectiveness of acidified biochar (AB) in alleviating Pb stress in mint. The study involved two levels of Pb (0 = control and 200 mg/kg Pb) and four levels of AB as treatments (0, 0.45, 0.90, and 1.20%). Results indicate that 1.20% AB was the most effective treatment, significantly decreasing root and shoot Pb concentration while enhancing shoot and root fresh and dry weight, shoot and root length, and shoot and root N, P, and K concentration. Moreover, a significant decrease in MDA (0.45AB, 0.90AB, and 1.20AB caused a decline in MDA content by 14.3%, 27.8%, and 40.2%, respectively) and an increase in ascorbic acid (0.45AB, 0.90AB, and 1.20AB led to an increase in ascorbic acid content of 1.9%, 24.8%, and 28.4%, respectively) validated the effectiveness of 1.20% AB compared to the control. Adding 0.45AB, 0.90AB, and 1.20AB led to an increase in soluble sugar content of 15.6%, 27.5%, and 32.1%, respectively, compared to the treatment without AB. Further investigations at the field level are suggested to confirm the efficacy of 1.20% AB as the best treatment against Pb toxicity in saline soil conditions.


Conflict of interest statement

The authors declare no competing interests.

Figures

Figure 1
Figure 1
The impact of various levels of acidified biochar (0%, 0.45%, 0.90%, 1.20%) on the growth of mint plants in both saline and lead-contaminated saline soil. The plant growth parameters assessed were the fresh weight of shoots (A), roots (B), dry weight of shoots (C) and roots (D).To determine the significance of the differences between the various acidified biochar application levels, Fisher’s LSD analysis was employed, and the bars on the graphs show the letters that correspond to statistically significant differences (p ≤ 0.05).
Figure 2
Figure 2
The impact of various levels of acidified biochar (0%, 0.45%, 0.90%, 1.20%) on the growth of mint plants in both saline and lead-contaminated saline soil. The plant growth parameters assessed were the chlorophyll a (A),chlorophyll b (B), total chlorophyll (C) and carotenoids (D). To determine the significance of the differences between the various acidified biochar application levels, Fisher’s LSD analysis was employed, and the bars on the graphs show the letters that correspond to statistically significant differences (p ≤ 0.05).
Figure 3
Figure 3
The impact of various levels of acidified biochar (0%, 0.45%, 0.90%, 1.20%) on the growth of mint plants in both saline and lead-contaminated saline soil. The plant growth parameters assessed were the soluble sugar (A), and protein (B). To determine the significance of the differences between the various acidified biochar application levels, Fisher’s LSD analysis was employed, and the bars on the graphs show the letters that correspond to statistically significant differences (p ≤ 0.05).
Figure 4
Figure 4
The impact of various levels of acidified biochar (0%, 0.45%, 0.90%, 1.20%) on the growth of mint plants in both saline and lead-contaminated saline soil. The plant growth parameters assessed were the ascorbic acid (A) and MDA (B). To determine the significance of the differences between the various acidified biochar application levels, Fisher’s LSD analysis was employed, and the bars on the graphs show the letters that correspond to statistically significant differences (p ≤ 0.05).
Figure 5
Figure 5
The impact of various levels of acidified biochar (0%, 0.45%, 0.90%, 1.20%) on the growth of mint plants in both saline and lead-contaminated saline soil. The plant growth parameters assessed were the shoot N (A) shoot P (B) and shoot K (C). To determine the significance of the differences between the various acidified biochar application levels, Fisher’s LSD analysis was employed, and the bars on the graphs show the letters that correspond to statistically significant differences (p ≤ 0.05).
Figure 6
Figure 6
The impact of various levels of acidified biochar (0%, 0.45%, 0.90%, 1.20%) on the growth of mint plants in both saline and lead-contaminated saline soil. The plant growth parameters assessed were the root N (A) shoot P (B) and shoot K (C). To determine the significance of the differences between the various acidified biochar application levels, Fisher’s LSD analysis was employed, and the bars on the graphs show the letters that correspond to statistically significant differences (p ≤ 0.05).
Figure 7
Figure 7
The impact of various levels of acidified biochar (0%, 0.45%, 0.90%, 1.20%) on the growth of mint plants in both saline and lead-contaminated saline soil. The plant growth parameters assessed were the shoot Pb (A) and root Pb (B). To determine the significance of the differences between the various acidified biochar application levels, Fisher’s LSD analysis was employed, and the bars on the graphs show the letters that correspond to statistically significant differences (p ≤ 0.05).
Figure 8
Figure 8
Pearson correlation for various levels of acidified biochar (0%, 0.45%, 0.90%, 1.20%) on studied attributes of mint in Pb contaminated soil.
Figure 9
Figure 9
Principal component analysis for various levels of acidified biochar (0%, 0.45%, 0.90%, 1.20%) on studied attributes of mint in Pb contaminated soil.
Figure 10
Figure 10
FTIR spectra of Acidified Biochar in functional group, fingerprint and aromatic region.

References

    1. Dinu C, Gheorghe S, Tenea AG, Stoica C, Vasile GG, Popescu RL, Serban EA, Pascu LF. Toxic metals (As, Cd, Ni, Pb) impact in the most common medicinal plant (Mentha piperita) Int. J. Environ. Res. Public Health. 2021 doi: 10.3390/ijerph18083904. - DOI - PMC - PubMed
    1. Maffei M, Scannerini S. UV-B effect on photomorphogenesis and essential oil composition in peppermint (Mentha piwperita L.) J. Essent. Oil Res. 2000;12:523–529. doi: 10.1080/10412905.2000.9712150. - DOI
    1. Yazdani D, Jamshidi H, Mojab F. Compare of essential oil yield and menthol existent in peppermint (Mentha piperita L.) planted in different origin of Iran. J. Med. Plant Med. Plant Inst. Jahadda Neshgahi. 2002;3:73–78.
    1. Aziz EE, Hendawy SF. Effect of Soil Type and Irrigation Intervals on Plant Growth, Essential Oil Yield and Constituents of Thymus vulgaris Plant. American-EurasianJ. Agric. Environ. Sci. 2008;4:443–450.
    1. Chen L, Zhou M, Wang J, Zhang Z, Duan C, Wang X, Zhao S, Bai X, Li Z, Li Z, et al. A global meta-analysis of heavy metal(loid)s pollution in soils near copper mines: Evaluation of pollution level and probabilistic health risks. Sci. Total Environ. 2022;835:155441. doi: 10.1016/j.scitotenv.2022.155441. - DOI - PubMed

Publication types