. 2023 May 30;20(1):132.
doi: 10.1186/s12974-023-02809-7.

Analysis of the microglia transcriptome across the human lifespan using single cell RNA sequencing

Affiliations

Analysis of the microglia transcriptome across the human lifespan using single cell RNA sequencing

Moein Yaqubi et al. J Neuroinflammation. .

Abstract

Background: Microglia are tissue resident macrophages with a wide range of critically important functions in central nervous system development and homeostasis.

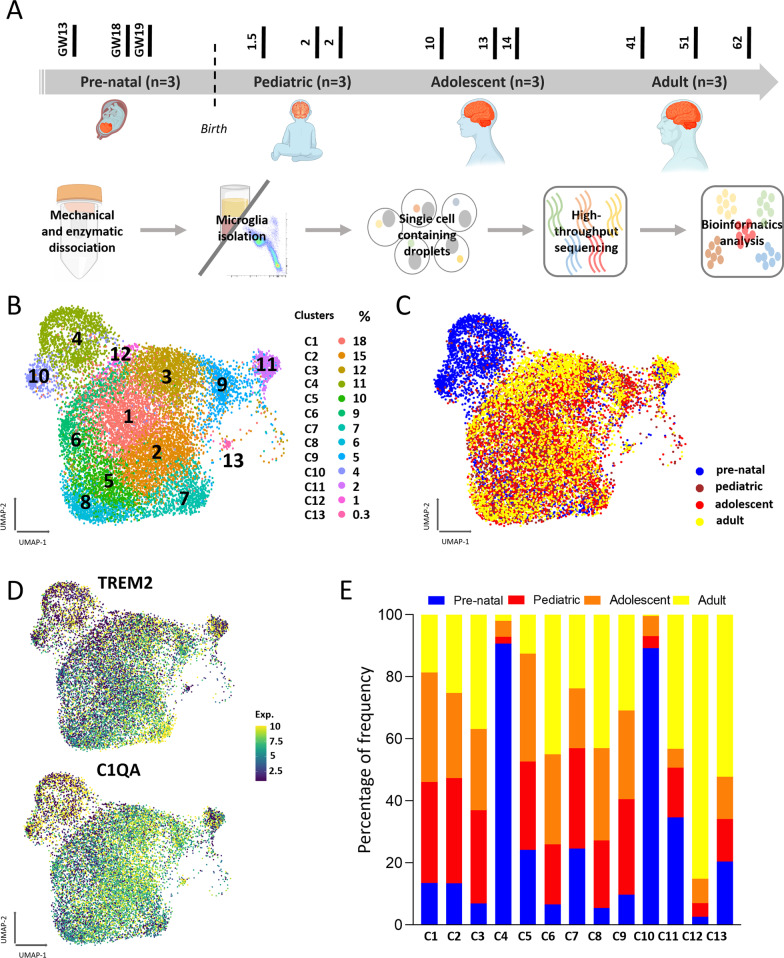
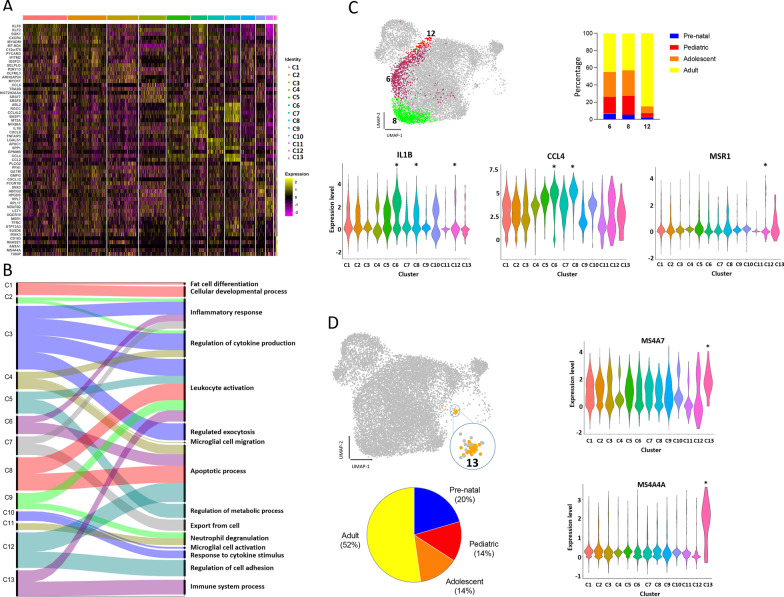
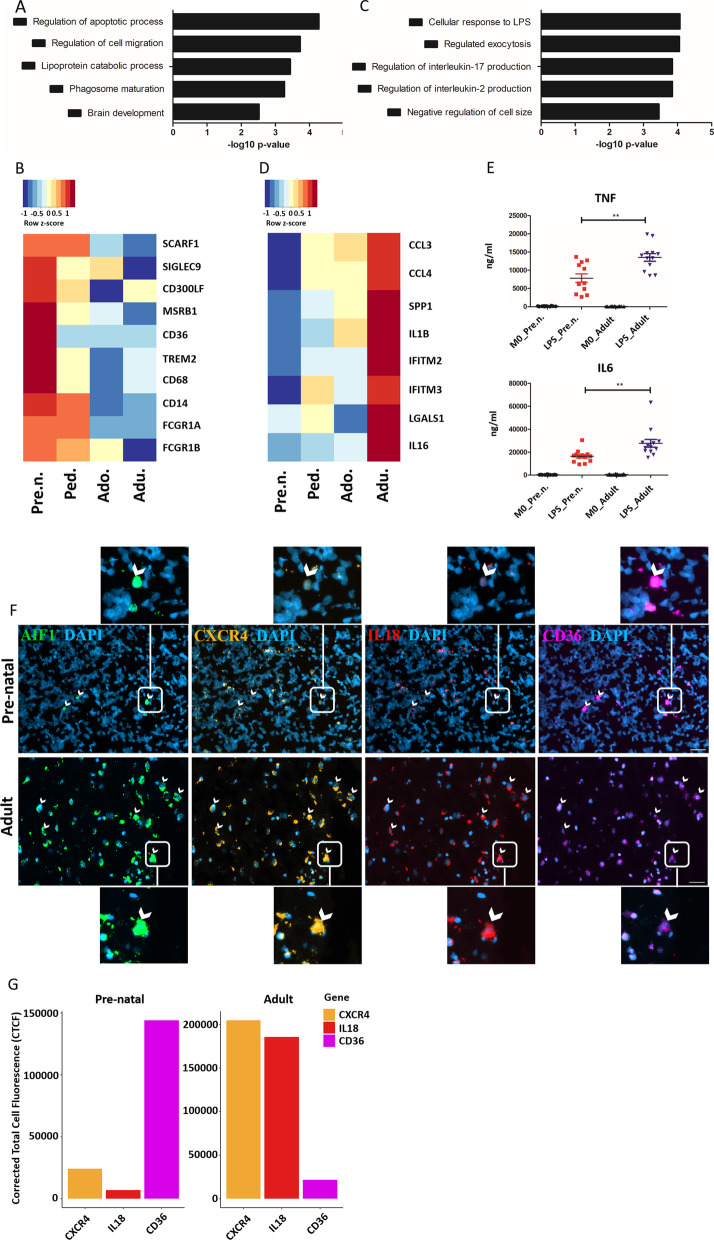
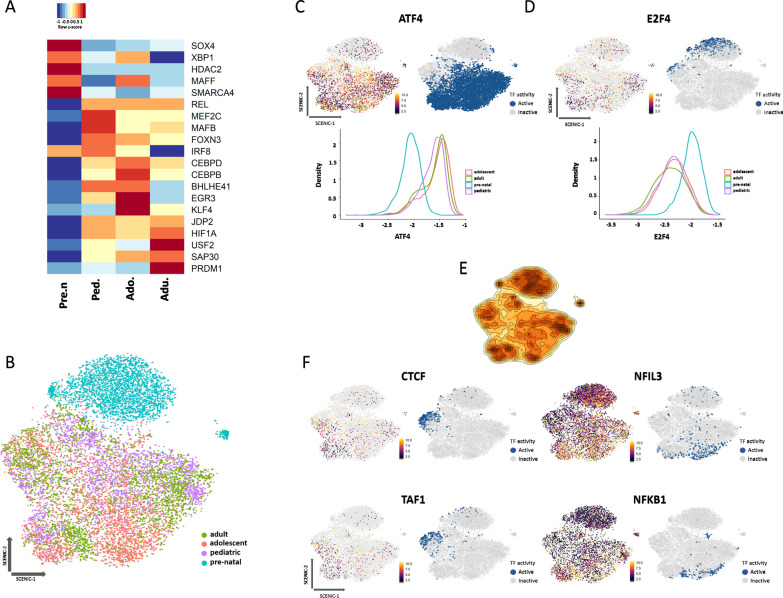
Method: In this study, we aimed to characterize the transcriptional landscape of ex vivo human microglia across different developmental ages using cells derived from pre-natal, pediatric, adolescent, and adult brain samples. We further confirmed our transcriptional observations using ELISA and RNAscope.

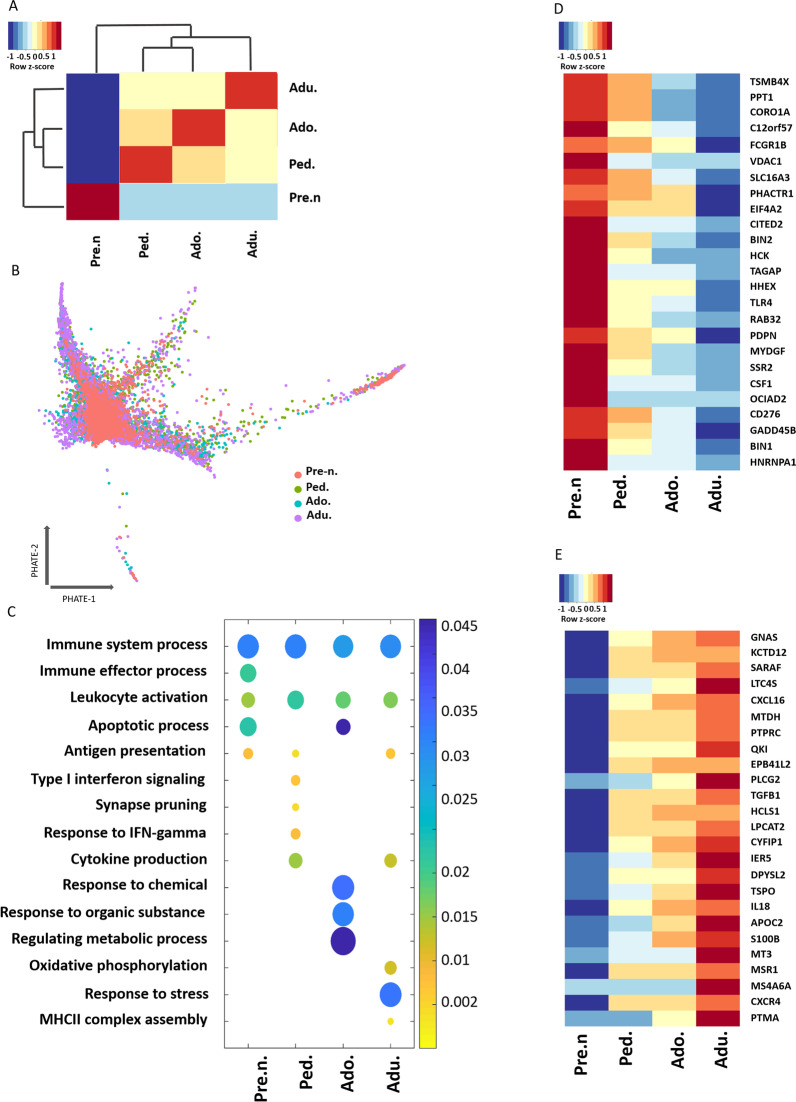
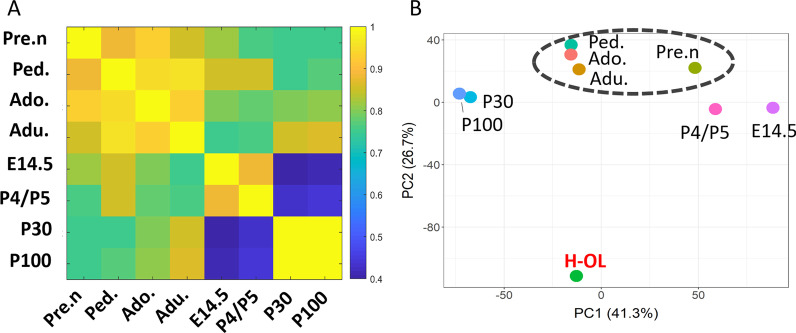
Results: We showed that pre-natal microglia have a distinct transcriptional and regulatory signature relative to their post-natal counterparts that includes an upregulation of phagocytic pathways. We confirmed upregulation of CD36, a positive regulator of phagocytosis, in pre-natal samples compared to adult samples in situ. Moreover, we showed adult microglia have more pro-inflammatory signature compared to microglia from other developmental ages. We indicated that adult microglia are more immune responsive by secreting increased levels of pro-inflammatory cytokines in response to LPS treatment compared to the pre-natal microglia. We further validated in situ up-regulation of IL18 and CXCR4 in human adult brain section compared to the pre-natal brain section. Finally, trajectory analysis indicated that the transcriptional signatures adopted by microglia throughout development are in response to a changing brain microenvironment and do not reflect predetermined developmental states.

Conclusion: In all, this study provides unique insight into the development of human microglia and a useful reference for understanding microglial contribution to developmental and age-related human disease.

Keywords: Ex vivo human microglia; Gene regulatory network; Transcriptional heterogeneity; scRNA-seq.


Conflict of interest statement

The authors have no competing interests to declare funding.

Figures

Fig. 1
Fig. 1
Isolation and characterization of human microglia. A Microglia were isolated from brain tissues at different ages, followed by tissue processing, single cell RNA sequencing and bioinformatics analysis. Three biological replicates per developmental stage (n = 12 in total) were used for downstream analysis. B UMAP plot of 13 clusters of 13,583 isolated microglia and relative size of each cluster. C UMAP plot representing the distinct expression profile of pre- compared to post-natal cells. Each age is represented by a separate color. D UMAP plot showing normalized expression of canonical microglia genes in all cells. E Stack bar plot showing the contribution of microglia from each age in each cluster. Different ages are represented by a distinct color
Fig. 2
Fig. 2
Microglia transcriptional clusters link to specific functions. A Heatmap of top 10 DEGs per cluster. Gene expression is represented by a color-coded z-score. Up and down regulated genes are shown by yellow and violet colors respectively. B Alluvial plot representing the most affected biological processes by upregulated genes of each cluster. Ribbon thickness indicates the number of genes per biological process. C UMAP plot highlighting three microglia clusters associated with inflammatory phenotypes. Stack bar plot showing contribution of each age group to these three clusters. Each age group is represented by a distinct color. Violin plot depicting expression of significantly upregulated gene in these three clusters *adjusted p-value < 0.05 (Wilcox test). D UMAP plot highlighting microglia originating from the second wave of microglia development. Pie chart showing the contribution of microglia of each age to cluster 13. Each age is represented by a distinct color. Violin plots showing expression of MS4A4A and MS4A7 genes * adjusted p-value < 0.05 (Wilcox test)
Fig. 3
Fig. 3
Transcriptional landscape of microglia at distinct developmental ages. A Hierarchal clustering of microglia at each age according to Jaccard similarity coefficient score which is represented by a color gradient, yellow (highest similarity) and dark blue (lowest similarity). B PHATE visualization for ex vivo human microglia by age. C Dot plot depicting the most affected biological processes of the top 100 highly variable genes for each age. The circle size indicates the number of genes present in each biological process. Statistical significance of terms is represented by color gradient, p-value of all terms is < 0.05. D, E Heatmap showing expression of top 25 highly variable genes whose expression incrementally decreased D or increased E with age. Red and blue color indicate up and down regulation of genes, respectively
Fig. 4
Fig. 4
Age-associated gene expression signatures of human microglia. A Gene ontology analysis of top 100 highly variable genes whose expression incrementally decreased with age. B Heatmap depicting expression of phagocytosis related genes. Red and blue color indicate up and down regulation of genes, respectively. C Gene ontology analysis of top 100 highly variable genes whose expression incrementally increased with age. D Heatmap depicting expression of pro-inflammatory molecules. Red and blue color indicate up and down regulation of genes, respectively. E Human pre-natal and adult microglia were treated with LPS 100 ng/ml for 24 h. Release of TNF and IL-6 was measured by ELISA. Wilcoxon–Mann–Whitney t test was used to check significance of the result. F Representative RNAscope images of AIF1 (green), CXCR4 (orange), IL18 (red), and CD36 (magenta) expression in fresh-frozen pre-natal and adult human brain tissue (n = 1 pre-natal; n = 1 adult). The absolute number of microglia is vastly reduced in pre-natal brain tissue compared to adult brain tissue, as visualized by AIF1 expression. A selection of microglia is denoted by white arrowheads for ease of interpretation. Scale bar = 40 μM Enlarged images of individual cells expressing markers of interest are included and their position indicated by white boxes. G Bar plot of corrected total cell fluorescence (CTCF; a standardized intensity measurement) values for CXCR4, IL18 and CD36 for AIF1 + cells. CXCR4 and IL18 expression are increased in adult microglia compared to pre-natal microglia. Conversely, CD36 expression in pre-natal microglia far exceeds that of adult microglia
Fig. 5
Fig. 5
Pre-natal microglia have a distinct transcription factor activity profile compared to post-natal microglia. A Heatmap depicting top 5 microglia transcription factor signatures for each age group. Red and blue colors indicate up and down regulation of genes, respectively. B SCENIC plot depicting unbiased microglia clustering according to inferred TF activity separated by age. Each age group is represented by a distinct color. C, D SCENIC plot representing mRNA expression, binary regulon activity, and kernel density AUC histogram for ATF4 and E2F4 TF. Expression of genes is represented by a color gradient. TF activity is represented by a binary index in which blue denotes active and grey denotes inactive. E Density plot showing global activity map of TFs. Highly active and less active spots are represented by dark and light orange color respectively. F SCENIC plot representing mRNA expression and binary regulon activity of selected TFs. Expression of genes is represented by a color gradient. TF activity is represented by a binary index in which blue denotes active and grey denotes inactive
Fig. 6
Fig. 6
Transcriptional comparison of human and mouse microglia across developmental ages. A Heatmap showing Pearson correlation coefficient score of human and mouse microglia at different ages. The score is represented by a color gradient in which yellow is the highest score (100%) and blue is lowest (40%). B PCA plot of human and mouse microglia at different ages of development. Pre n Pre-natal, Ped Pediatric, Ado Adolescent, Adu Adolescent, H-OL Human Oligodendrocyte. The average of three adult human oligodendrocyte samples sequenced at the same time as the microglia (Additional file 1: Fig. S1A, Additional file 5: Table S6) was used to verify the absence of batch effects between samples

References

    1. Ginhoux F, Greter M, Leboeuf M, Nandi S, See P, Gokhan S, et al. Fate mapping analysis reveals that adult microglia derive from primitive macrophages. Science. 2010;330:841–5. doi: 10.1126/science.1194637. - DOI - PMC - PubMed
    1. Menassa DA, Gomez-Nicola D. Microglial dynamics during human brain development. Front Immunol. 2018 doi: 10.3389/fimmu.2018.01014. - DOI - PMC - PubMed
    1. Butovsky O, Weiner HL. Microglial signatures and their role in health and disease. Nat Rev Neurosci. 2018 doi: 10.1038/s41583-018-0057-5. - DOI - PMC - PubMed
    1. Cunningham CL, Martinez-Cerdeno V, Noctor SC. Microglia regulate the number of neural precursor cells in the developing cerebral cortex. J Neurosci. 2013;33:4216–33. doi: 10.1523/JNEUROSCI.3441-12.2013. - DOI - PMC - PubMed
    1. Rosin JM, Sinha S, Biernaskie J, Kurrasch DM. A subpopulation of embryonic microglia respond to maternal stress and influence nearby neural progenitors. Dev Cell. 2021;56:1326–1345.e6. doi: 10.1016/j.devcel.2021.03.018. - DOI - PubMed