. 2023 May 30;21(1):130.
doi: 10.1186/s12915-023-01592-4.

Omission responses in local field potentials in rat auditory cortex

Affiliations

Omission responses in local field potentials in rat auditory cortex

Ryszard Auksztulewicz et al. BMC Biol. .

Abstract

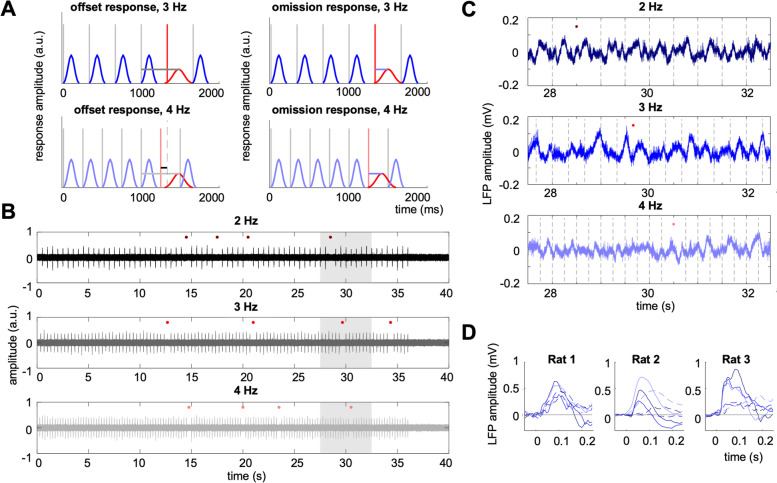
Background: Non-invasive recordings of gross neural activity in humans often show responses to omitted stimuli in steady trains of identical stimuli. This has been taken as evidence for the neural coding of prediction or prediction error. However, evidence for such omission responses from invasive recordings of cellular-scale responses in animal models is scarce. Here, we sought to characterise omission responses using extracellular recordings in the auditory cortex of anaesthetised rats. We profiled omission responses across local field potentials (LFP), analogue multiunit activity (AMUA), and single/multi-unit spiking activity, using stimuli that were fixed-rate trains of acoustic noise bursts where 5% of bursts were randomly omitted.

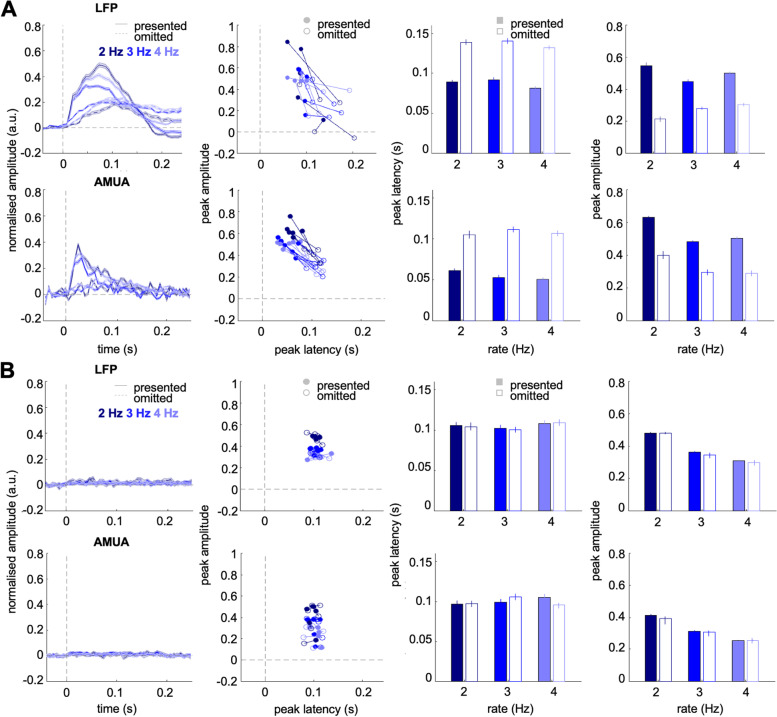
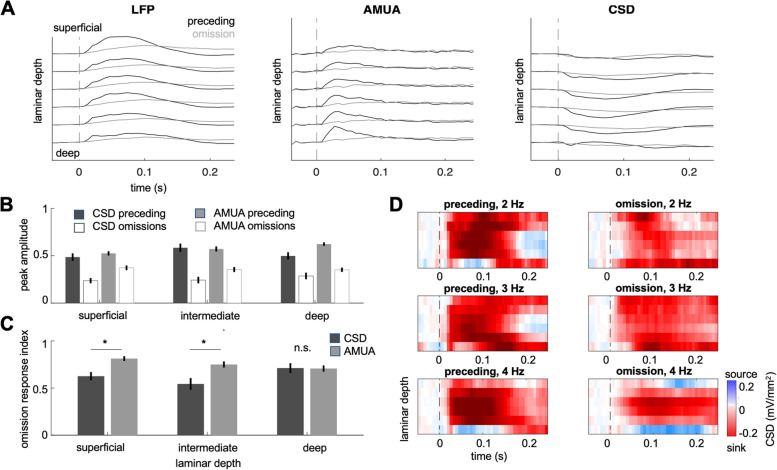
Results: Significant omission responses were observed in LFP and AMUA signals, but not in spiking activity. These omission responses had a lower amplitude and longer latency than burst-evoked sensory responses, and omission response amplitude increased as a function of the number of preceding bursts.

Conclusions: Together, our findings show that omission responses are most robustly observed in LFP and AMUA signals (relative to spiking activity). This has implications for models of cortical processing that require many neurons to encode prediction errors in their spike output.

Keywords: Auditory cortex; Auditory processing; Electrophysiology; Omission responses; Predictive processing.


Conflict of interest statement

The authors declare that they have no competing interests.

Figures

Fig. 1
Fig. 1
A Schematic representing two possible types of neural responses that could occur to omissions of rhythmically presented stimuli. Vertical lines represent stimuli presented at 3 Hz (dark grey lines, upper plots), 4 Hz (light grey lines, lower plots), or omitted (red lines). Hypothetical responses to noise bursts are plotted in blue. Left: offset response, whose latency is locked (as marked by the grey horizontal line) to the preceding stimulus rather than to the omitted stimulus. Right: true omission response, whose latency should be locked (as marked by the grey horizontal line) to the omitted stimulus rather than to the preceding stimulus. When analysing response latencies relative to the omitted stimulus, true omission responses should show the same latency relative to the expected time of the omitted response for both 3 and 4 Hz, while offset responses should show a latency shift between 3 and 4 Hz (lower left plot, difference between solid red vertical line, showing expected 4 Hz offset, and dashed grey vertical line, showing expected 3 Hz offset; the difference is marked by the upper horizontal line). B Example stimulus waveforms for 2 Hz (upper plot), 3 Hz (middle plot), and 4 Hz (lower plot) sequences. Red dots denote omitted stimuli. Shaded area denotes the time segment for which raw local field potentials are plotted in C. C Example local field potentials from a representative electrode. Dashed vertical lines denote presented stimuli. Red dots denote omitted stimuli. D Examples of LFP responses averaged over either bursts or omissions, plotted for a representative channel for each rat. Solid lines: average stimulus-evoked responses; dashed lines: average omission responses; colours as above
Fig. 2
Fig. 2
AD Local field potential (LFP) responses to presented vs. omitted stimuli, normalised to pre-stimulus baseline (n = 6 penetrations). EH Analogue multiunit activity (AMUA) responses to presented vs. omitted stimuli, normalised to pre-stimulus baseline (n = 6 penetrations). A, E Time courses of responses (normalised to pre-stimulus baseline) evoked by presented stimuli (solid lines) relative to stimulus presentation (noise bursts immediately preceding omissions), and by stimulus omissions (dashed lines) relative to the expected but omitted stimulus onset. Dark blue, blue, and light blue lines correspond to stimulus presentation rates of 2, 3, and 4 Hz. Shaded areas represent standard error of the mean (SEM) across channels. B, F Peak amplitudes (Y-axis) and latencies (X-axis) of each penetration, averaged across analysed channels. Filled circles: stimulus-evoked responses; empty circles: omission responses; colours as above. C, G Peak amplitude comparison of stimulus-evoked (filled bars) and omission responses (empty bars) across the three stimulus presentation rates. Error bars represent SEM across channels. Please note that single channels are presented in B and F. D, H Peak amplitude comparison of stimulus-evoked vs. omission responses across the three stimulus presentation rates (filled/empty bars as above). Error bars represent SEM across channels. I Baseline-corrected peristimulus time histograms (PSTHs), quantifying single-unit spiking activity responses to noise bursts (left panel) and omitted stimuli (right panel). Colours as in A and E. Shaded areas represent SEM across units. J Multiunit PSTHs. Legend as in I
Fig. 3
Fig. 3
A LFP (upper panels) and AMUA (lower panels) activity analysed for all channels, with no channel selection criteria (n = 6 penetrations). Figure legend as in Fig. 2A–H. B LFP (upper panels) and AMUA (lower panels) activity analysed for time-shuffled data. Figure legend as in Fig. 2A–H
Fig. 4
Fig. 4
A Scatterplot and marginal histograms of peak LFP amplitude relationship between stimulus-evoked (X-axis) and omission responses (Y-axis) for each presentation rate (dark blue: 2 Hz, blue: 3 Hz, light blue: 4 Hz). Solid lines denote regression slopes. B Scatterplot and marginal histograms of peak AMUA amplitudes; legend as above. C Peak LFP amplitudes of omission responses as a function of the number of preceding noise bursts (dark blue: 2 Hz, blue: 3 Hz, light blue: 4 Hz). Solid lines denote significant regression slopes. D Peak AMUA amplitudes of omission responses as a function of the number of preceding noise bursts. Legend as above
Fig. 5
Fig. 5
A LFP, AMUA, and CSD time courses across channel depth (n = 6 penetrations). The six pairs of lines show preceding burst and omission responses at the 2nd to the 7th electrode going down, the spacing of the electrodes was 200 μm. B Cortical depth profile of omission responses: peak CSD and AMUA amplitudes plotted for stimulus-evoked (solid bars) and omission responses (empty bars) for CSD (dark grey) and AMUA (light grey). Error bars represent SEM across channels. C Cortical depth of the omission response index (see the ‘ Methods’ section) for CSD (dark grey) and AMUA (light grey). Asterisk marks a significant difference between CSD and AMUA (p < 0.05, Bonferroni corrected across cortical depth). Error bars represent SEM across channels. D CSD maps per burst rate, plotted separately for stimulus-evoked and omission responses. Cortical depth as in A

References

    1. von Helmholtz H. Handbuch der physiologischen Optik. 1867.
    1. Rao RP, Ballard DH. Predictive coding in the visual cortex: a functional interpretation of some extra-classical receptive-field effects. Nat Neurosci. 1999;2:79–87. doi: 10.1038/4580. - DOI - PubMed
    1. Olshausen BA, Field DJ. Emergence of simple-cell receptive field properties by learning a sparse code for natural images. Nature. 1996;381:607–609. doi: 10.1038/381607a0. - DOI - PubMed
    1. Chalk M, Marre O, Tkačik G. Toward a unified theory of efficient, predictive, and sparse coding. Proc Natl Acad Sci. 2018;115:186–191. doi: 10.1073/pnas.1711114115. - DOI - PMC - PubMed
    1. Friston K. Learning and inference in the brain. Neural Netw. 2003;16:1325–1352. doi: 10.1016/j.neunet.2003.06.005. - DOI - PubMed

Publication types

LinkOut - more resources