. 2023 May 30;11(1):121.
doi: 10.1186/s40168-023-01542-w.

The gut microbiome modifies the associations of short- and long-term physical activity with body weight changes

Affiliations

The gut microbiome modifies the associations of short- and long-term physical activity with body weight changes

Kai Wang et al. Microbiome. .

Abstract

Background: The gut microbiome regulates host energy balance and adiposity-related metabolic consequences, but it remains unknown how the gut microbiome modulates body weight response to physical activity (PA).

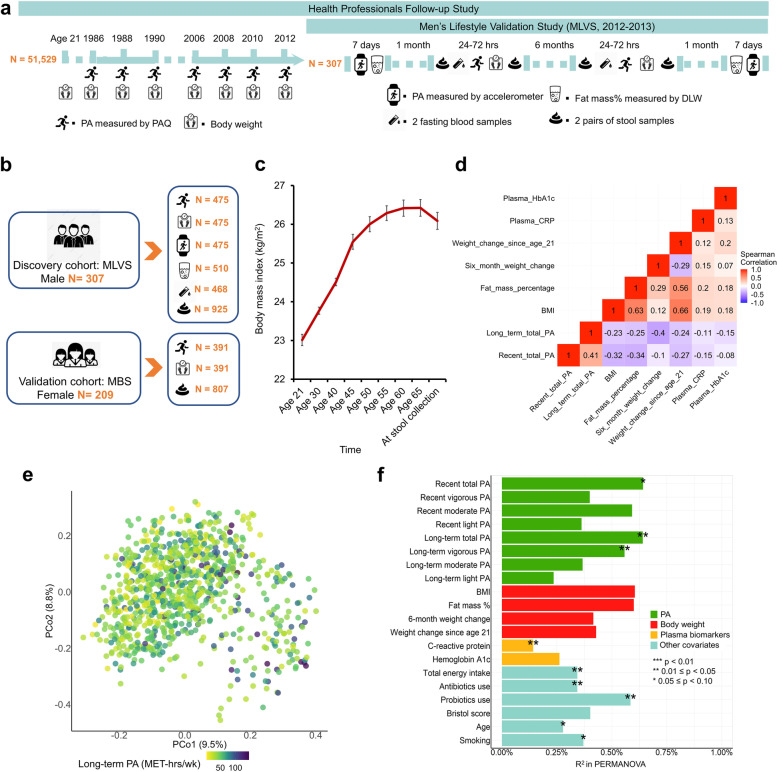
Methods: Nested in the Health Professionals Follow-up Study, a subcohort of 307 healthy men (mean[SD] age, 70[4] years) provided stool and blood samples in 2012-2013. Data from cohort long-term follow-ups and from the accelerometer, doubly labeled water, and plasma biomarker measurements during the time of stool collection were used to assess long-term and short-term associations of PA with adiposity. The gut microbiome was profiled by shotgun metagenomics and metatranscriptomics. A subcohort of 209 healthy women from the Nurses' Health Study II was used for validation.

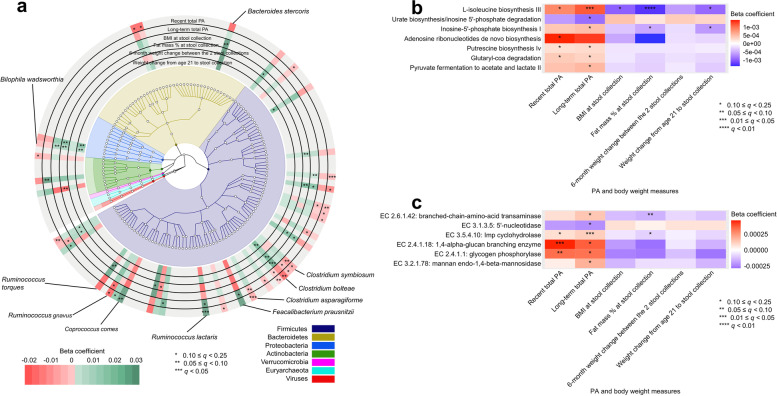
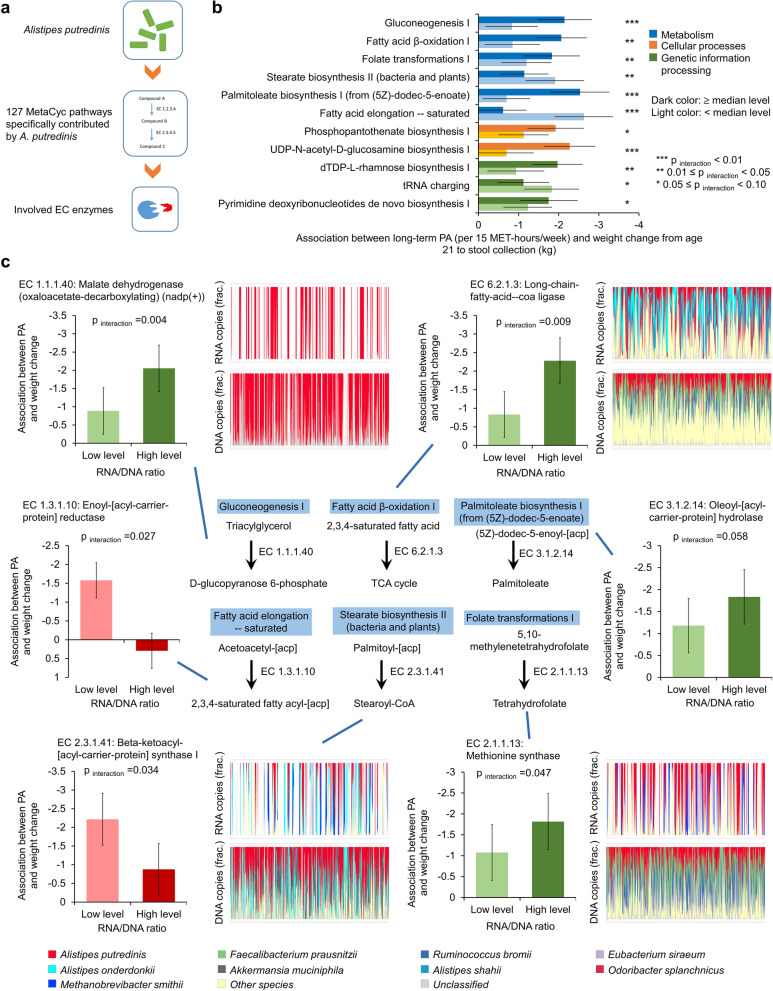
Results: The microbial species Alistipes putredinis was found to modify the association between PA and body weight. Specifically, in individuals with higher abundance of A. putredinis, each 15-MET-hour/week increment in long-term PA was associated with 2.26 kg (95% CI, 1.53-2.98 kg) less weight gain from age 21 to the time of stool collection, whereas those with lower abundance of A. putredinis only had 1.01 kg (95% CI, 0.41-1.61 kg) less weight gain (pinteraction = 0.019). Consistent modification associated with A. putredinis was observed for short-term PA in relation to BMI, fat mass%, plasma HbA1c, and 6-month weight change. This modification effect might be partly attributable to four metabolic pathways encoded by A. putredinis, including folate transformation, fatty acid β-oxidation, gluconeogenesis, and stearate biosynthesis.

Conclusions: A greater abundance of A. putredinis may strengthen the beneficial association of PA with body weight change, suggesting the potential of gut microbial intervention to improve the efficacy of PA in body weight management. Video Abstract.


Conflict of interest statement

The authors declare no competing interests.

Figures

Fig. 1
Fig. 1
Study design for linking physical activity (PA), body weight measures, plasma biomarkers, and the gut microbiome in the Men’s Lifestyle Validation Study (MLVS) and associations with overall gut microbiome configuration. a To associate the gut microbiome with PA and body weight measures, we profiled stool metagenomes, metatranscriptomes, and blood biomarkers from the MLVS. The MLVS is a sub-study of the Health Professionals Follow-up Study (HPFS), an ongoing prospective cohort of 51,529 men. The HPFS has repeatedly collected PA and body weight information using validated questionnaires and health-related information since 1986. In the period 2012–2013, the MLVS collected stool samples at up to four time points per individual, blood samples at up to two time points, and additional PA information using accelerometer and body weight information using doubly labeled water from 307 participants. We applied MetaPhlAn 2 and HUMAnN 2 to perform taxonomic and functional profiling from stool shotgun metagenomes and metatranscriptomes. Plasma biomarkers of inflammation (high-sensitivity C-reactive protein, CRP) and glucose homeostasis (hemoglobin A1c, HbA1c) were measured using standard methods. We employed generalized linear mixed-effects regression models to account for within-subject correlation due to repeated sampling and occasional missing data. b Discovery cohort, validation cohort, and main exposure and outcome variables used in this study. c Mean BMI at different ages and the time of stool collection. The error bars represent standard deviations. d Spearman correlation between main exposure and outcome variables. e Principal coordinate analysis of all samples using species-level Bray–Curtis dissimilarity. f Proportion of variation in taxonomy explained by PA measures, body weight measures, plasma biomarkers, and covariables as quantified by two-sided permutational multivariate analysis of variance (based on species-level Bray–Curtis dissimilarity)
Fig. 2
Fig. 2
Associations of physical activity (PA) and body weight measures with individual gut microbial species and pathway abundances in the Men’s Lifestyle Validation Study (MLVS). a Significant associations of recent and long-term total PA and body weight measure with microbial species (q ≤ 0.25). The q values (false discovery rate adjusted p value) were calculated using the Benjamini–Hochberg method with a target rate of 0.25. This plot shows associations of the factors with specific microbial species overlaid onto their taxonomy. The red-to-green gradient in the outer rings represents the magnitude and direction of the associations between the factors and species’ abundances. The colors of the innermost ring and phylogenetic trees differentiate major phyla. All models included each participant’s identifier as random effects and simultaneously adjusted for age, smoking, Alternative Healthy Eating Index (AHEI), total energy intake, probiotic use, antibiotic use, and Bristol stool scale. b, c Associations of recent and long-term total PA and body weight measures with microbial functions (as MetaCyc pathways and EC enzymes). Beta coefficients were derived from multivariable-adjusted generalized linear mixed-effects regression models as above, with multiple comparison adjustment also as above. All the analyses in these panels were conducted based on all 925 metagenomes collected from 307 participants. All the statistical tests were two-sided
Fig. 3
Fig. 3
Alistipes putredinis abundance modifies the associations of physical activity (PA) measures with body weight measures and plasma biomarkers. Median abundance of A. putredinis was used as cutoff for low and high level. A high abundance of A. putredinis significantly strengthened the associations of PA with weight loss/less weight gain from age 21 to stool collection (ac), lower body mass index (BMI) at stool collection, lower fat mass percentage at stool collection, weight loss/less weight gain in 6 months, and lower plasma hemoglobin A1c (HbA1c) at stool collection, but not with plasma high-sensitivity C-reactive protein (CRP) at stool collection (d). a The interaction between long-term PA and A. putredinis abundance in relation to body weight change from age 21 to stool collection. b Long-term PA in relation to weight change from age 21 to stool collection among participants with low and high A. putredinis abundance separately. Box plot centers show the median with boxes indicating their inter-quartile ranges (IQRs) of each quintile range of long-term PA. c Association between long-term PA and body weight change from age 21 to stool collection according to A. putredinis abundance. The dots in the plot indicate beta coefficients in the multivariable-adjusted generalized linear mixed-effects regression models, with error bars indicating upper and lower limits of their 95% confidence intervals. Beta coefficients and pinteraction were calculated from multivariable-adjusted generalized linear mixed-effects regression models while adjusting for age, smoking, Alternative Healthy Eating Index (AHEI), total energy intake, probiotic use, antibiotic use, and Bristol stool scale. d Associations between PA measures with other body weight measures, including BMI at stool collection, fat mass percentage at stool collection, short-term body weight change in 6 months (using data of the first pair of stool collections only), plasma HbA1c and CRP at stool collection
Fig. 4
Fig. 4
MetaCyc pathways and involved EC enzymes driving the modifying role of Alistipes putredinis in body weight response to physical activity (PA). The role of A. putredinis in increasing body weight response to PA was mainly driven by the MetaCyc pathways related to gluconeogenesis, fatty acid β-oxidation, palmitoleate biosynthesis, folate transformation, stearate biosynthesis, and fatty acid elongation. a Diagram showing that a total of 127 MetaCyc pathways contributed by A. putredinis and involved EC enzymes were examined for their modifying roles in the association between PA level and weight change since age 21 years. b The 11 MetaCyc pathways modifying the association between PA and weight change since age 21 years. Among the 11 pathways, 6 were of metabolism, 2 were of cellular processes, and 3 were of genetic information processing. The pathways of gluconeogenesis I, fatty acid β-oxidation I, palmitoleate biosynthesis (from (5Z)-dodec-5-enoate), and folate transformations I might positively drive the response in body weight to PA, whereas the pathways of stearate biosynthesis II (bacteria and plant) and fatty acid elongation—saturated might negatively drive the response. The bars indicate beta coefficients in the multivariable-adjusted generalized linear mixed-effects regression models, with error bars indicating upper and lower limits of their 95% confidence intervals. Beta coefficients and pinteraction were calculated from multivariable-adjusted generalized linear mixed-effects regression models while adjusting for age, smoking, Alternative Healthy Eating Index (AHEI), total energy intake, probiotic use, antibiotic use, and Bristol stool scale. c Representative EC enzymes involved in the 6 pathways of metabolism in panel b showing modifying role in the association between PA and body weight change since age 21 years, and the contributions of A. putredinis to the enzymes. The bar plots in c show the microbial species with the greatest contributions to each EC enzyme, with metagenomic or metatranscriptomic samples along the x-axes ordered by PA level (from the lowest to the highest). Direction of the modifications of the pathways and detected enzymes were consistent, with the bar chart showing the positive modifications colored in green and negative modifications colored in red. All statistical tests were two-sided
Fig. 5
Fig. 5
Validation of the modifying role of Alistipes putredinis in body weight response to physical activity (PA) in the Mind–Body Study (MBS) cohort. a Study design of MBS. To associate the gut microbiome with PA and body weight measures, we profiled stool metagenomes from the MBS. The MBS is a sub-study of the NHSII, an ongoing prospective cohort totaling 116,429 women. The NHSII has repeatedly collected PA and body weight information using validated questionnaires and health-related information since 1989. In the period 2013–2014, the MBS collected stool samples at up to four time points per individual and body weight information at up to two time points 209 participants. We applied MetaPhlAn 2 and HUMAnN 2 to perform taxonomic and functional profiling from stool shotgun metagenomes and metatranscriptomes. b Mean value of BMI at different ages and the time of stool collection. The error bars represent standard deviations. c Associations between PA level at stool collection and BMI at stool collection (left), and between long-term PA level and body weight change from age 18 to stool collection (right) in those with a higher and lower abundance of A. putredinis separately. d Body weight change in the subsequent 4 years since stool collection according to PA level at the time of stool collection in those with a higher and lower abundance of A. putrdinis separately. e Association between PA level at the time of stool collection and body weight change in the subsequent 4 years since stool collection in those with a higher and lower abundance of A. putrdinis separately

Similar articles

Cited by

References

    1. Ogden CL, Fryar CD, Martin CB, Freedman DS, Carroll MD, Gu Q, Hales CM. Trends in obesity prevalence by race and Hispanic origin-1999-2000 to 2017–2018. JAMA. 2020;324:1208–1210. doi: 10.1001/jama.2020.14590. - DOI - PMC - PubMed
    1. Malik VS, Willet WC, Hu FB. Nearly a decade on - trends, risk factors and policy implications in global obesity. Nat Rev Endocrinol. 2020;16:615–616. doi: 10.1038/s41574-020-00411-y. - DOI - PMC - PubMed
    1. Zheng Y, Manson JE, Yuan C, Liang MH, Grodstein F, Stampfer MJ, Willett WC, Hu FB. Associations of weight gain from early to middle adulthood with major health outcomes later in life. JAMA. 2017;318:255–269. doi: 10.1001/jama.2017.7092. - DOI - PMC - PubMed
    1. Sonnenburg JL, Bäckhed F. Diet-microbiota interactions as moderators of human metabolism. Nature. 2016;535:56–64. doi: 10.1038/nature18846. - DOI - PMC - PubMed
    1. Maruvada P, Leone V, Kaplan LM, Chang EB. The human microbiome and obesity: moving beyond associations. Cell Host Microbe. 2017;22:589–599. doi: 10.1016/j.chom.2017.10.005. - DOI - PubMed

Publication types

LinkOut - more resources