

RNA sequencing and bioinformatics analysis of differentially expressed genes in the peripheral serum of ankylosing spondylitis patients
- PMID: 37254181
- PMCID: PMC10228101
- DOI: 10.1186/s13018-023-03871-w
RNA sequencing and bioinformatics analysis of differentially expressed genes in the peripheral serum of ankylosing spondylitis patients
Abstract
Background: Ankylosing spondylitis (AS) is a chronic progressive autoimmune disease characterized by spinal and sacroiliac arthritis, but its pathogenesis and genetic basis are largely unclear.
Methods: We randomly selected three serum samples each from an AS and a normal control (NC) group for high-throughput sequencing followed by using edgeR to find differentially expressed genes (DEGs). Gene Ontology (GO), Kyoto Encyclopedia of Genes and Genomes, Reactome pathway analyses, and Gene Set Enrichment Analysis were used to comprehensively analyze the possible functions and pathways involved with these DEGs. Protein-protein interaction (PPI) networks were constructed using the STRING database and Cytoscape. The modules and hub genes of these DEGs were identified using MCODE and CytoHubba plugins. Reverse transcription-quantitative polymerase chain reaction (RT-qPCR) was used to validate the expression levels of candidate genes in serum samples from AS patients and healthy controls.
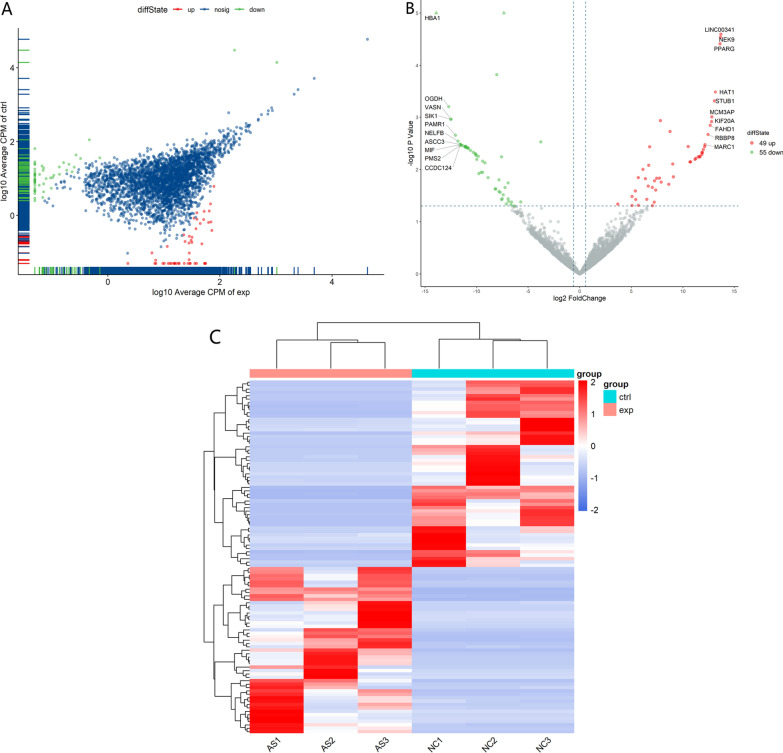
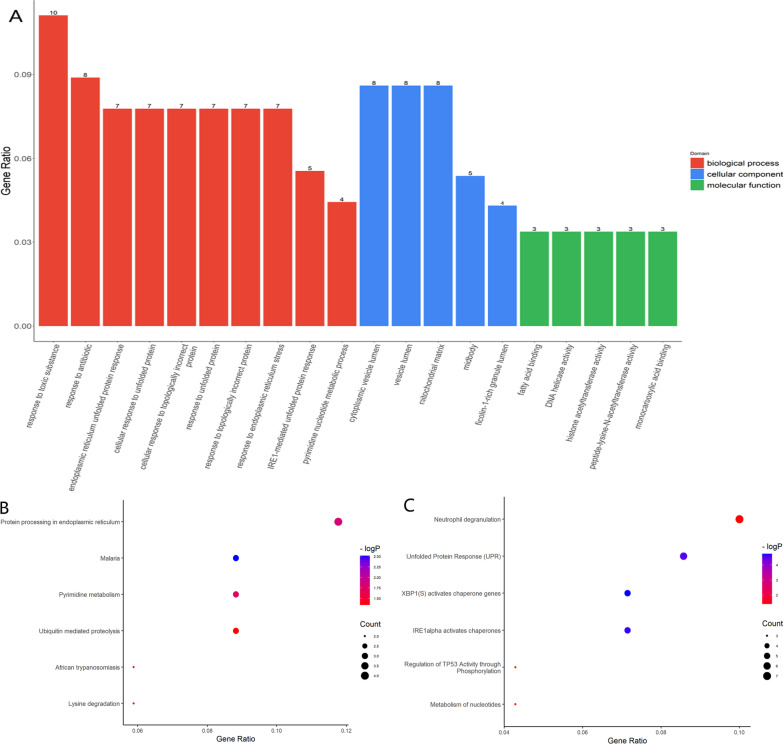
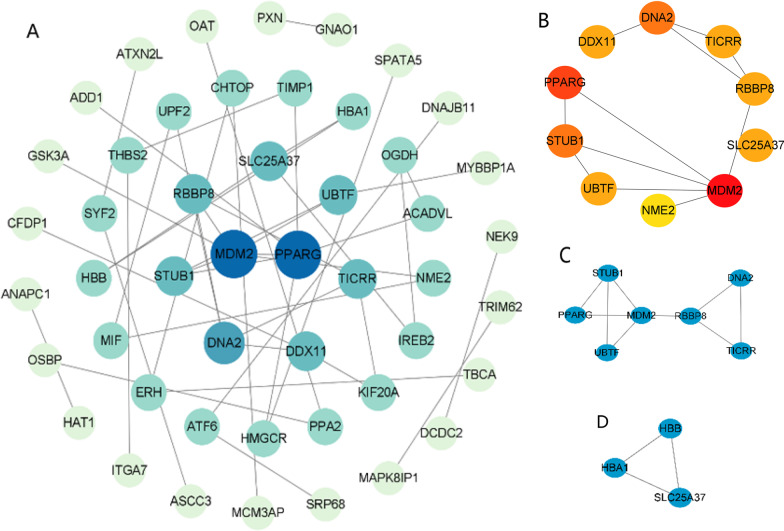
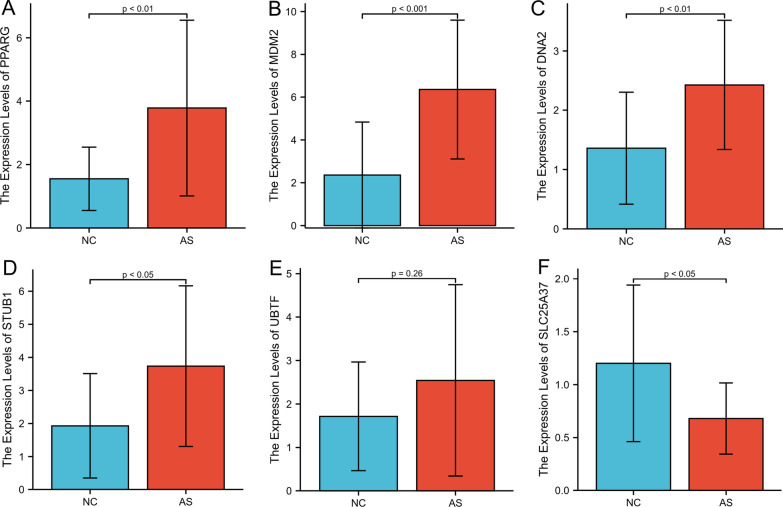
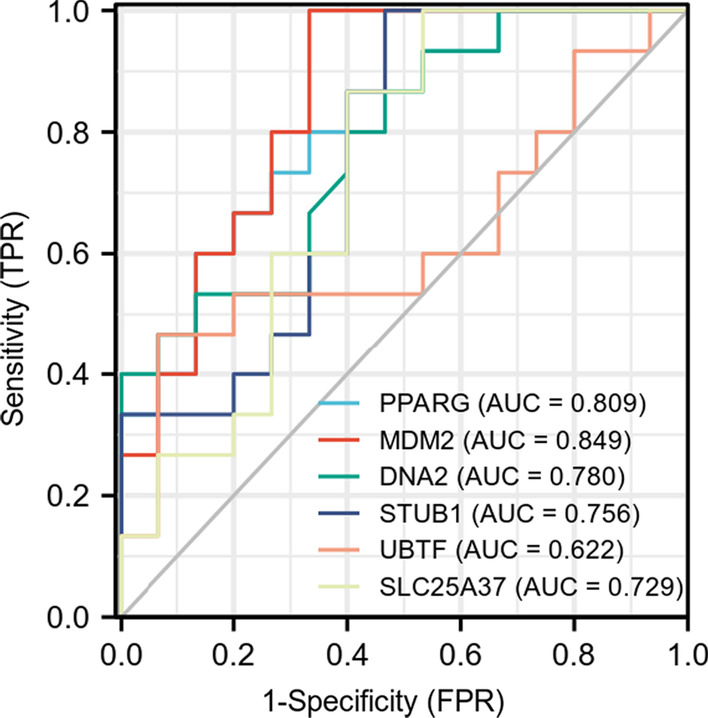
Results: We successfully identified 100 significant DEGs in serum. When we compared them with the NC group, 49 of these genes were upregulated in AS patients and 51 were downregulated. GO function and pathway enrichment analysis indicated that these DEGs were mainly enriched in several signaling pathways associated with endoplasmic reticulum stress, including protein processing in the endoplasmic reticulum, unfolded protein response, and ubiquitin-mediated proteolysis. We also constructed a PPI network and identified the highly connected top 10 hub genes. The expression levels of the candidate hub genes PPARG, MDM2, DNA2, STUB1, UBTF, and SLC25A37 were then validated by RT-qPCR analysis. Finally, receiver operating characteristic curve analysis suggested that PPARG and MDM2 may be the potential biomarkers of AS.
Conclusions: These findings may help to further elucidate the pathogenesis of AS and provide valuable potential gene biomarkers or targets for the diagnosis and treatment of AS.
Keywords: Ankylosing spondylitis; Biomarker; Differentially expressed genes; RNA sequencing; Serum.
© 2023. The Author(s).
Conflict of interest statement
The authors have no conflicts of interest to declare.
Figures

Similar articles
-
Identification and bioinformatics analysis of lncRNAs in serum of patients with ankylosing spondylitis.BMC Musculoskelet Disord. 2024 Apr 15;25(1):291. doi: 10.1186/s12891-024-07396-z. BMC Musculoskelet Disord. 2024. PMID: 38622662 Free PMC article. Review.
-
The identification of key genes and pathways in hepatocellular carcinoma by bioinformatics analysis of high-throughput data.Med Oncol. 2017 Jun;34(6):101. doi: 10.1007/s12032-017-0963-9. Epub 2017 Apr 21. Med Oncol. 2017. PMID: 28432618 Free PMC article.
-
Bioinformatics identification of key candidate genes and pathways associated with systemic lupus erythematosus.Clin Rheumatol. 2020 Feb;39(2):425-434. doi: 10.1007/s10067-019-04751-7. Epub 2019 Nov 1. Clin Rheumatol. 2020. PMID: 31673979
-
Identification of immune related cells and crucial genes in the peripheral blood of ankylosing spondylitis by integrated bioinformatics analysis.PeerJ. 2021 Sep 7;9:e12125. doi: 10.7717/peerj.12125. eCollection 2021. PeerJ. 2021. PMID: 34589304 Free PMC article.
-
Differentially expressed protein-coding genes in ankylosing spondylitis: Emerging insights into pathogenesis and therapeutic approaches.Int J Rheum Dis. 2023 Aug;26(8):1440-1452. doi: 10.1111/1756-185X.14814. Epub 2023 Jul 5. Int J Rheum Dis. 2023. PMID: 37403943 Review.
Cited by
-
Identification and bioinformatics analysis of lncRNAs in serum of patients with ankylosing spondylitis.BMC Musculoskelet Disord. 2024 Apr 15;25(1):291. doi: 10.1186/s12891-024-07396-z. BMC Musculoskelet Disord. 2024. PMID: 38622662 Free PMC article. Review.
-
Bacillus amyloliquefaciens attenuates the intestinal permeability, oxidative stress and endoplasmic reticulum stress: transcriptome and microbiome analyses in weaned piglets.Front Microbiol. 2024 May 13;15:1362487. doi: 10.3389/fmicb.2024.1362487. eCollection 2024. Front Microbiol. 2024. PMID: 38808274 Free PMC article.
References
MeSH terms
Substances
LinkOut - more resources
Full Text Sources
Medical
Molecular Biology Databases
Research Materials
