

What matters most? Assessment of within-canopy factors influencing the needle microbiome of the model conifer, Pinus radiata
- PMID: 37254222
- PMCID: PMC10230745
- DOI: 10.1186/s40793-023-00507-8
What matters most? Assessment of within-canopy factors influencing the needle microbiome of the model conifer, Pinus radiata
Abstract
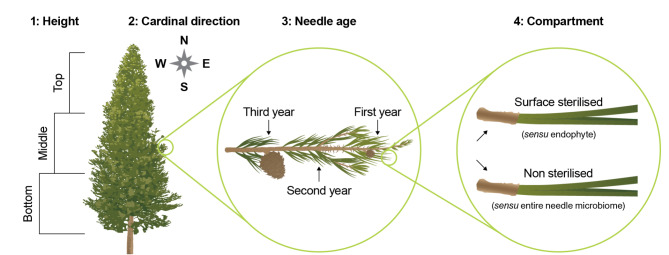
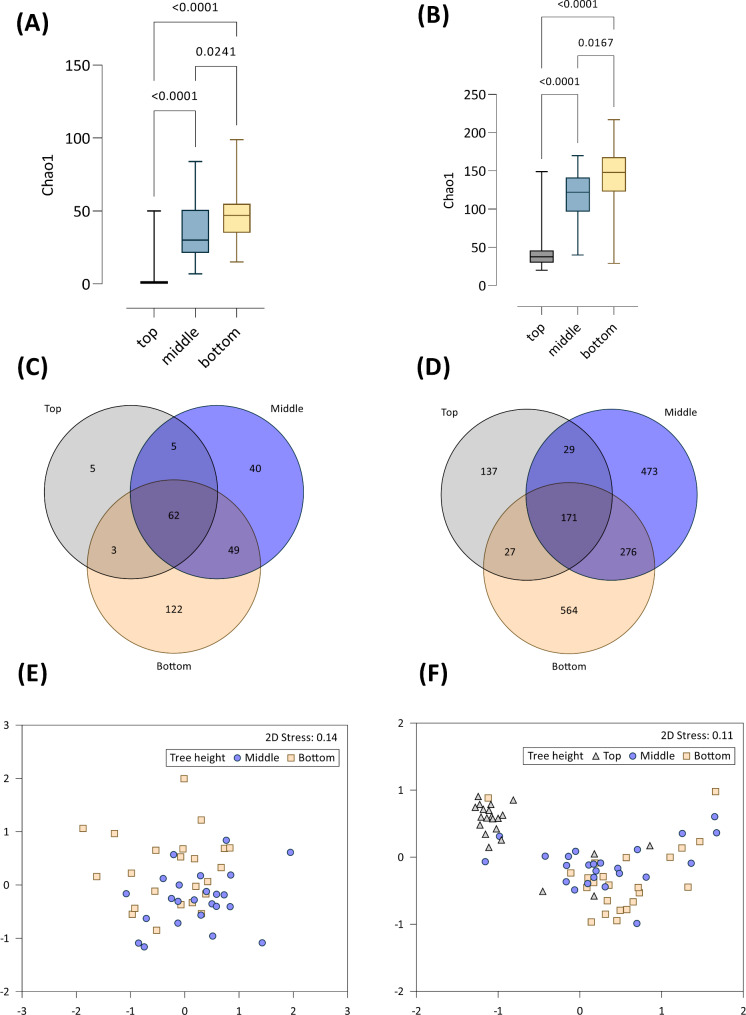
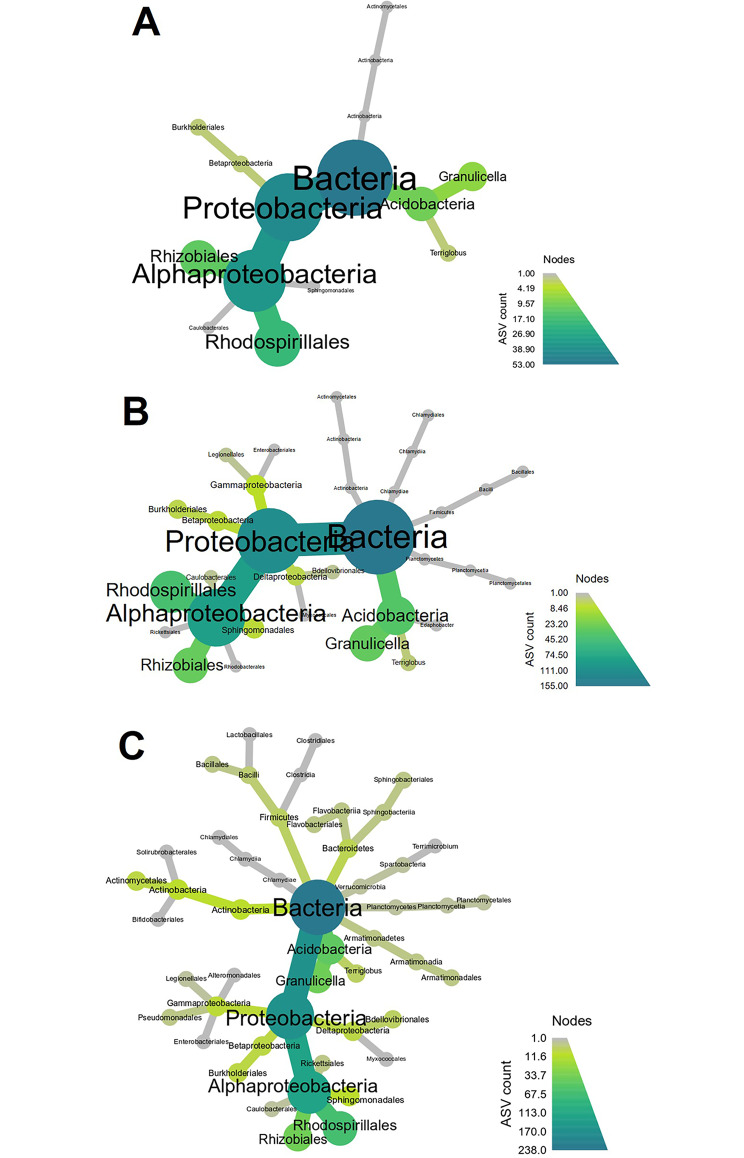
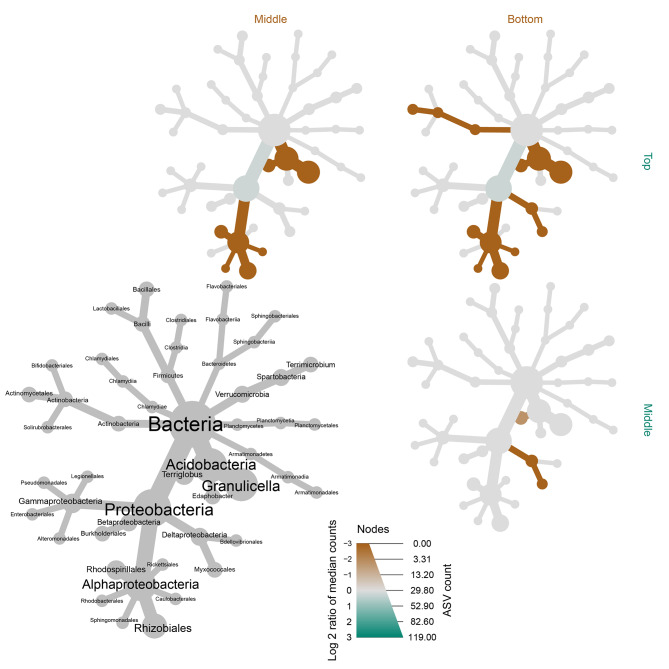
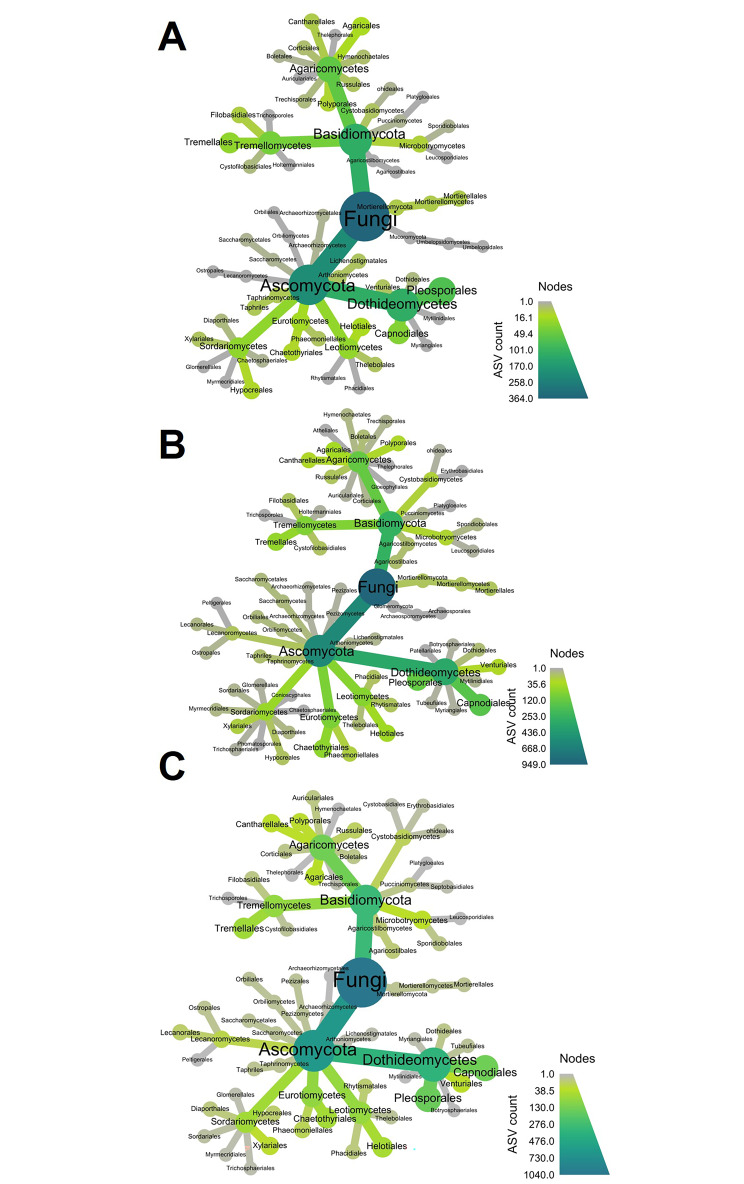
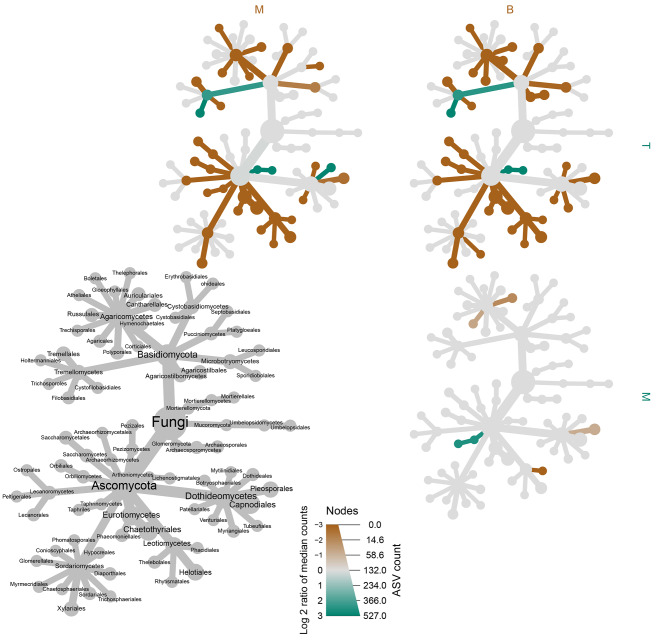
The assembly and function of the phyllosphere microbiome is important to the overall fitness of plants and, thereby, the ecosystems they inhabit. Presently, model systems for tree phyllosphere microbiome studies are lacking, yet forests resilient to pests, diseases, and climate change are important to support a myriad of ecosystem services impacting from local to global levels. In this study, we extend the development of model microbiome systems for trees species, particularly coniferous gymnosperms, by undertaking a structured approach assessing the phyllosphere microbiome of Pinus radiata. Canopy sampling height was the single most important factor influencing both alpha- and beta-diversity of bacterial and fungal communities (p < 0.005). Bacterial and fungal phyllosphere microbiome richness was lowest in samples from the top of the canopy, subsequently increasing in the middle and then bottom canopy samples. These differences maybe driven by either by (1) exchange of microbiomes with the forest floor and soil with the lower foliage, (2) strong ecological filtering in the upper canopy via environmental exposure (e.g., UV), (3) canopy density, (4) or combinations of factors. Most taxa present in the top canopy were also present lower in tree; as such, sampling strategies focussing on lower canopy sampling should provide good overall phyllosphere microbiome coverage for the tree. The dominant phyllosphere bacteria were Alpha-proteobacteria (Rhizobiales and Sphingomonas) along with Acidobacteria Gp1. However, the P. radiata phyllosphere microbiome samples were fungal dominated. From the top canopy samples, Arthoniomycetes and Dothideomycetes were highly represented, with abundances of Arthoniomycetes then reducing in lower canopy samples whilst abundances of Ascomycota increased. The most abundant fungal taxa were Phaeococcomyces (14.4% of total reads) and Phaeotheca spp. (10.38%). A second-order effect of canopy sampling direction was evident in bacterial community composition (p = 0.01); these directional influences were not evident for fungal communities. However, sterilisation of needles did impact fungal community composition (p = 0.025), indicating potential for community differences in the endosphere versus leaf surface compartments. Needle age was only important in relation to bacterial communities, but was canopy height dependant (interaction p = 0.008). By building an understanding of the primary and secondary factors related to intra-canopy phyllosphere microbiome variation, we provide a sampling framework to either explicitly minimise or capture variation in needle collection to enable ongoing ecological studies targeted at inter-canopy or other experimental levels.
Keywords: Community assembly; Conifer; Microbiome; Model system; Phyllosphere.
© 2023. The Author(s).
Conflict of interest statement
The authors declare there are no conflicts of interest.
Figures
References
-
- Vacher C, Hampe A, Porté AJ, Sauer U, Compant S, Morris CE. 2016. The phyllosphere: microbial jungle at the plant-climate interface. Annu Rev Ecol Evo Syst 1–24.
-
- Stone B, Weingarten EA, Jackson CR. The role of the pyllosphere microbiome in plant health and function. Annu Plant Rev. 2018;1:1–24.
Grants and funding
LinkOut - more resources
Full Text Sources
Miscellaneous