. 2023 Oct;41(4):644-654.
doi: 10.1002/hon.3187. Epub 2023 May 30.

Molecular classification and identification of an aggressive signature in low-grade B-cell lymphomas

Affiliations

Molecular classification and identification of an aggressive signature in low-grade B-cell lymphomas

Melissa A Hopper et al. Hematol Oncol. 2023 Oct.

Abstract

Non-follicular low-grade B-cell lymphomas (LGBCL) are biologically diverse entities that share clinical and histologic features that make definitive pathologic categorization challenging. While most patients with LGBCL have an indolent course, some experience aggressive disease, highlighting additional heterogeneity across these subtypes. To investigate the potential for shared biology across subtypes, we performed RNA sequencing and applied machine learning approaches that identified five clusters of patients that grouped independently of subtype. One cluster was characterized by inferior outcome, upregulation of cell cycle genes, and increased tumor immune cell content. Integration of whole exome sequencing identified novel LGBCL mutations and enrichment of TNFAIP3 and BCL2 alterations in the poor survival cluster. Building on this, we further refined a transcriptomic signature associated with early clinical failure in two independent cohorts. Taken together, this study identifies unique clusters of LGBCL defined by novel gene expression signatures and immune profiles associated with outcome across diagnostic subtypes.

Keywords: genetics; immune; lymphoma; signatures; transcriptomics.


Conflict of interest statement

Conflict-of-Interest Disclosures: A.J.N., Research Funding, Celgene Bristol Myers Squibb. M.A.H., K.W., K.T.H., J.E.K., A.R.D., J.P.N., M.K.M., M.R.S., V.S., M.C.L., Z.Y., M.J.M., J.P., E.D.M., T.M.H., B.K.L., L.M.R., S.M.A., J.R.C., and D.J. declare no competing financial interests.

Figures
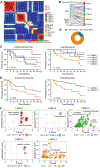
Figure 1.
Figure 1.. Identification of low-grade B-cell lymphoma clusters by transcriptomic profiling.
(A) RNA-sequencing data from LGBCL patients was subjected to non-negative matrix factorization (NMF) to identify context-dependent gene expression families (n = 61). Five clusters of patients, LGBCL1–5, were identified as shown in the consensus map. (B) Sankey diagram showing the distribution of low-grade B-cell lymphoma diagnoses across LGBCL1–5 clusters (LGBCL1 (tumor n = 5), LGBCL2 (n = 19), LGBCL3 (n = 10), LGBCL4 (n = 10), LGBCL5 (n = 17)). (C) Kaplan-Meier curves depicting patient event-free survival (left) and overall survival (right) with patients separated by cluster. Log-rank p-values are shown, with values of p < 0.05 considered significant. (D) Kaplan-Meier curves showing event-free survival (left) and overall survival (right) of LGBCL5 patients compared to all other LGBCL clusters combined. (E) Doughnut plot of LGBCL clusters of n = 5 patients with histological transformation. (F) Pathway analysis of significantly upregulated genes shows enriched GO Biological Processes for each LGBCL cluster. Each bubble depicts a significant GO term (p < 0.05). Bubble size indicates the number of genes in each pathway, with larger bubbles representing more genes.
Figure 2.
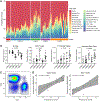
Figure 2.. Estimated tumor immune cell content associated with transcriptional clusters.
(A) RNA-sequencing data was subjected to immune deconvolution using CIBERSORTx (n = 61). Stacked bar plots show proportions of immune cell content in each tumor sample. (B) Major cell populations with significantly different frequencies across clusters are shown. A Kruskal-Wallis One-Way ANOVA test was used to determine significance. (C) Representative ArcSinh transformed psuedocolor plot of CD19 versus CD3 by CyTOF (n = 12). (D) Correlation of combined B-cell relative proportions determined by CIBERSORT versus frequency of B-cells from live singlets determined by CyTOF (n = 12) (left). Correlation of combined T-cell relative proportions determined by CIBERSORT versus frequency of T-cells from live singlets determined by CyTOF (n = 12) (right).
Figure 3.
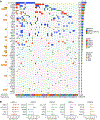
Figure 3.. Recurrent genomic alterations in 61 low-grade B-cell lymphoma tumors.
(A) OncoPlot of recurrent mutations (≥ 3%) and CNAs, color-coded by alteration type (center). CHASMplus mutation driver scores are shown in the bar graphs on the left. Frequency and distribution of recurrent alterations are shown on the right. Annotations for patient LGBCL cluster and diagnosis are displayed at the bottom. Variants identified as missense mutations, nonsense mutations, splice site, frame shift deletions, frame shift insertions, in frame deletions, in frame insertions, translation start site, nonstop mutations, or multi-hit in Maftools were designated a mutation in the OncoPlot. (B) Enrichment plots showing log10 odds ratio and 95% confidence intervals of the five most significant genomic alterations per cluster.
Figure 4.
Figure 4.. Identification of a gene expression signature associated with inferior event-free and overall survival in low-grade B-cell lymphomas.
(A) Protein-protein interaction network of genes upregulated in LGBCL5 and EFS24 failure patients. Nodes indicate genes and edges indicate interactions. Node color shows log2 fold-change of LGBCL5 compared to LGBCL1–4 patients. (B) Kaplan-Meier curves of n = 61 LGBCL patients with RNA-seq data. Grey lines represent patients with low singscore values; red lines indicate patients with high singscore values. EFS curves (left) and overall survival curves (right) are shown. Log-rank p-values are shown, with values of p < 0.05 considered significant. (C) Kaplan-Meier curves of validation cohort of n = 63 patients with GEP data. Grey lines show patients with low singscore values, while red lines indicate patients with high singscore values. EFS curves (left) and overall survival curves (right) are shown. (D) Summary of characteristics identified for each LGBCL cluster.

References

    1. Tracy SI, Larson MC, Feldman AL, et al. The utility of prognostic indices, early events, and histological subtypes on predicting outcomes in non-follicular indolent B-cell lymphomas. American journal of hematology. 2019;94(6):658–666. doi:10.1002/ajh.25473 - DOI - PMC - PubMed
    1. Solal-Céligny P, Roy P, Colombat P, et al. Follicular lymphoma international prognostic index. Blood. Sep 1 2004;104(5):1258–65. doi:10.1182/blood-2003-12-4434 - DOI - PubMed
    1. An international prognostic index for patients with chronic lymphocytic leukaemia (CLL-IPI): a meta-analysis of individual patient data. Lancet Oncol. Jun 2016;17(6):779–790. doi:10.1016/s1470-2045(16)30029-8 - DOI - PubMed
    1. Pillonel V, Juskevicius D, Ng CKY, et al. High-throughput sequencing of nodal marginal zone lymphomas identifies recurrent BRAF mutations. Leukemia. Nov 2018;32(11):2412–2426. doi:10.1038/s41375-018-0082-4 - DOI - PMC - PubMed
    1. Rinaldi A, Forconi F, Arcaini L, et al. Immunogenetics features and genomic lesions in splenic marginal zone lymphoma. 10.1111/j.1365-2141.2010.08347.x. British Journal of Haematology. 2010/December/01 2010;151(5):435–439. doi:10.1111/j.1365-2141.2010.08347.x - DOI - DOI - PubMed