. 2023 Sep 19;122(18):3690-3703.
doi: 10.1016/j.bpj.2023.05.027. Epub 2023 May 29.

Acute downregulation of emerin alters actomyosin cytoskeleton connectivity and function

Affiliations

Acute downregulation of emerin alters actomyosin cytoskeleton connectivity and function

Qianru Jin et al. Biophys J. .

Abstract

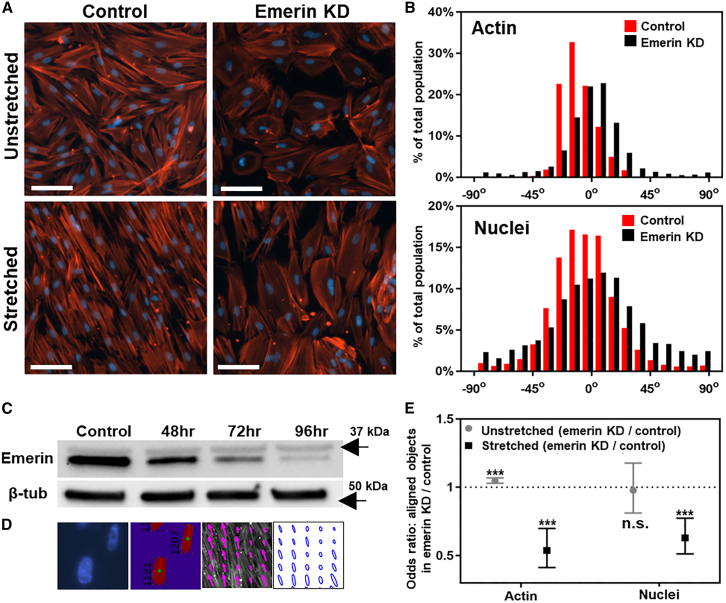
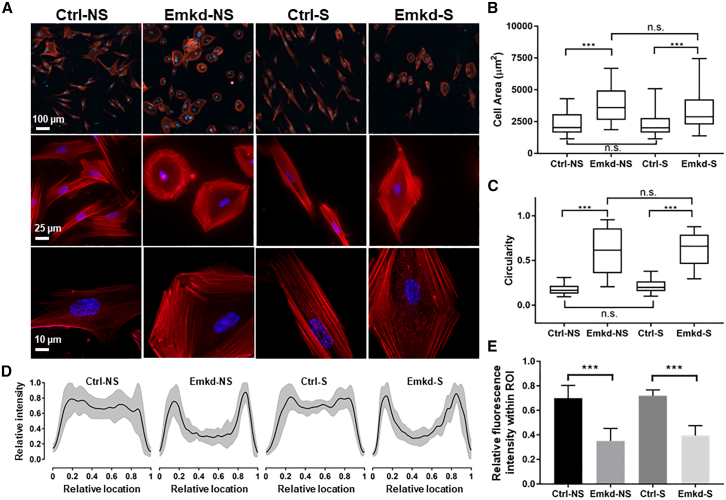
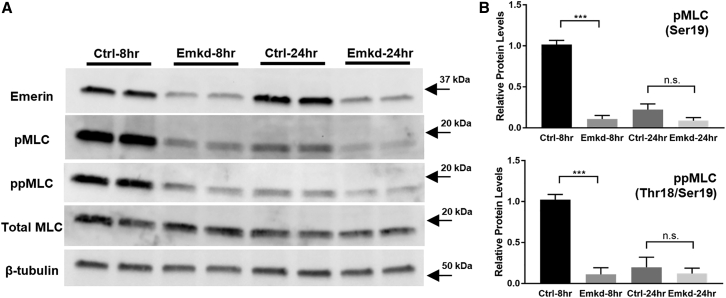
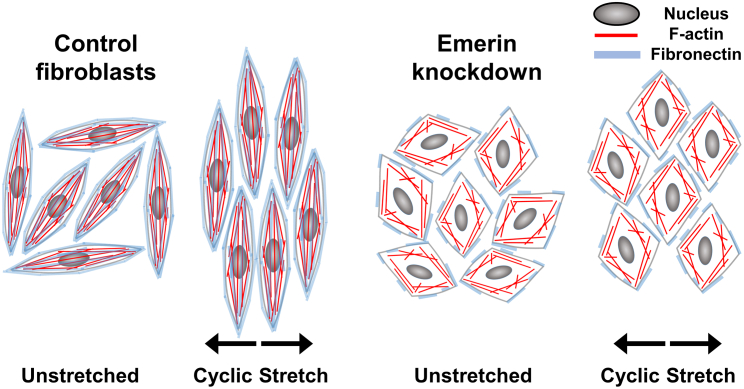
Fetal lung fibroblasts contribute dynamic infrastructure for the developing lung. These cells undergo dynamic mechanical transitions, including cyclic stretch and spreading, which are integral to lung growth in utero. We investigated the role of the nuclear envelope protein emerin in cellular responses to these dynamic mechanical transitions. In contrast to control cells, which briskly realigned their nuclei, actin cytoskeleton, and extracellular matrices in response to cyclic stretch, fibroblasts that were acutely downregulated for emerin showed incomplete reorientation of both nuclei and actin cytoskeleton. Emerin-downregulated fibroblasts were also aberrantly circular in contrast to the spindle-shaped controls and exhibited an altered pattern of filamentous actin organization that was disconnected from the nucleus. Emerin knockdown was also associated with reduced myosin light chain phosphorylation during cell spreading. Interestingly, emerin-downregulated fibroblasts also demonstrated reduced fibronectin fibrillogenesis and production. These findings indicate that nuclear-cytoskeletal coupling serves a role in the dynamic regulation of cytoskeletal structure and function and may also impact the transmission of traction force to the extracellular matrix microenvironment.


Conflict of interest statement

Declaration of interests The authors declare no competing interests.

Figures

Figure 1
Figure 1
Cyclic stretch induces alignment of extracellular matrix, F-actin, and nuclei in fetal lung fibroblasts. (A) A schematic illustration of the experimental setup. WI-38 fibroblasts plated on stretch chambers were subjected to cyclic uniaxial stretch (direction indicated by arrows). Fibronectin (dark gray), F-actin (light gray), and nuclei are highlighted. Top and side views of cells are shown. (BD) Distribution of fibronectin fibrils (B), F-actin (C), and nuclear (D) orientations at 0, 2, 15, and 20% strain. The angle of 0° is defined as the orientation perpendicular to the axis of stretch. Insets show representative images of the feature under study in grayscale. Images were analyzed using customized scripts (materials and methods). (E) The percentages of objects (fibronectin fibrils, F-actin, and nuclei) within ±15° of 0°, at 0, 2, 15, and 20% strain. Values are shown as mean ± standard error of the mean. Higher strains caused more complete realignment.
Figure 2
Figure 2
Emerin downregulation reduces alignment of F-actin and nuclei in response to stretch. (A) Epifluorescence images show nuclei and F-actin in control and emerin KD cells, with and without 15% stretch. Scale bars, 100 μm. (B) Distribution of F-actin and nuclear orientation observed in control (red) and emerin KD (black) cells. The angle of 0° is defined as the orientation perpendicular to the axis of stretch. (C) Western blot of emerin protein expression in WI-38 cells at different time points after adenovirally mediated knockdown. Emerin KD was maximal at 4 days after adenoviral transduction. (D) Representative images show the image analysis strategies to quantify the orientation of nuclei and F-actin. Nuclei were recognized as individual objects and orientation was determined by the long axis. For F-actin, each ellipse of persistence represents F-actin pattern in the corresponding tile. The orientation of the long axis represents F-actin orientation. Long and short axis values represent the extent of F-actin persistence parallel or perpendicular to the long axis, respectively. See materials and methods for details. (E) Odds ratios (OR) (dots and squares) and 95% confidence intervals (95% CI; bars) for the orientation of F-actin and nuclei. The OR is defined as the odds of F-actin filaments (or nuclei) within ±15° of the mean orientation in emerin KD compared with the odds in control. For the stretched groups, an OR of 0.63 indicates that the odds of having an emerin KD nucleus within ±15° of the mean orientation is 37% smaller than the odds of having a control nucleus within ±15° of the mean. OR (95% CI) comparing emerin KD with control cells were as follows: F-actin in unstretched condition, 1.05 (1.03–1.07, p < 0.001); F-actin in stretched conditions, 0.54 (0.41–0.70, p < 0.001); nuclei in unstretched condition, 0.97 (0.81–1.18, p = 0.81); nuclei in stretched conditions, 0.63 (0.51–0.77, p < 0.001). ∗∗∗p < 0.001; n.s. denotes that differences are not significant.
Figure 3
Figure 3
Emerin-downregulated cells are larger, more circular, and have a peripheral F-actin distribution. (A) Epifluorescence images of control (Ctrl) and emerin KD (Emkd) fibroblasts in unstretched (NS) or stretched (S) conditions. The middle and lower rows are shown with 4× and 10× greater magnification (respectively) than the top row (please see scale bars). The F-actin (red, rhodamine-phalloidin) and nuclei (blue, 4′,6-diamidino-2-phenylindole [DAPI]) are shown. (B) Quantitative analysis of cell size shows that Emkd cells are significantly larger than Ctrl in either unstretched or stretched conditions. Boxes indicate the median, first, and third quartiles. Whiskers indicate the 5th and 95th percentiles. Mean cell sizes (95% CI) were as follows (in μm2): Ctrl-NS, 908 (828–988); Emkd-NS, 1475 (1329–1622); Ctrl-S, 936 (815–1057); Emkd-S, 1341 (1277–1404). ∗∗∗p < 0.001; n.s., differences are not significant. (C) Quantitative analysis of cell circularity shows that there is a significant difference in circularity between Ctrl and Emkd in both unstretched and stretched conditions. Boxes indicate the median, first, and third quartiles. Whiskers indicate the 5th and 95th percentiles. Circularity (95% CI) values were as follows: Ctrl-NS, 0.17 (0.15–0.20); Emkd-NS, 0.58 (0.45–0.71); Ctrl-S, 0.22 (0.20–0.24); Emkd-S, 0.63 (0.51–0.76). ∗∗∗p < 0.001; n.s., differences are not significant. (D) F-actin fluorescence intensity distribution over the width of the cells. The y axis shows the normalized F-actin fluorescence intensity. The x axis shows the relative location in the cell normalized by the total width. The black line represents the mean value, and the gray zone represents the standard deviation. See materials and methods for details. (E) Quantitative analysis of the mean F-actin fluorescence intensity at region of interest (ROI): between 20 and 80% of the relative cell width. Bars and whiskers represent mean ± standard deviation. F-actin intensity values within the ROI (mean ± standard deviation) were as follows: Ctrl-NS, 0.70 ± 0.10; Emkd-NS, 0.35 ± 0.10; Ctrl-S, 0.72 ± 0.05; Emkd-S, 0.40 ± 0.08. ∗∗∗p < 0.001. See materials and methods for details.
Figure 4
Figure 4
Emerin-downregulated cells exhibit less myosin light chain phosphorylation during cell spreading than controls. (A) Control (Ctrl) and emerin KD (Emkd) fibroblasts were replated and cultured for 8 or 24 h. Immunoblotting was performed to probe monophosphorylation (Ser19; pMLC) and diphosphorylation (Thr18/Ser19; ppMLC) of the myosin light chain. Two technical replicates from each condition are shown. (B) Relative protein levels of pMLC and ppMLC demonstrated a large diminution of both pMLC and ppMLC in Emkd cells at 8 h, and a trend toward a similar pattern at 24 h. Bars and whiskers represent mean ± standard error of the mean based on four biological replicates. Relative pMLC levels were as follows (mean ± standard error of the mean): Ctrl-8hr, 1.02 ± 0.05; Emkd-8hr, 0.11 ± 0.04; Ctrl-24hr, 0.22 ± 0.07; Emkd-24hr, 0.09 ± 0.04. For ppMLC: Ctrl-8hr, 1.02 ± 0.06; Emkd-8hr, 0.11 ± 0.08; Ctrl-24hr, 0.20 ± 0.12; Emkd-24hr, 0.12 ± 0.06.∗∗∗p < 0.001; n.s. denotes that differences are not significant.
Figure 5
Figure 5
Emerin downregulation decreases fibronectin fibrillogenesis and expression. (A) Epifluorescence images of fibrillogenesis in control (Ctrl) and emerin KD (Emkd) cells on gelatin-coated coverslips for 8 and 24 h. Cells were labeled for F-actin (red, phalloidin), nuclei (blue, DAPI), and fibronectin (grayscale, antibody labeling). Green fluorescence is from GFP that was co-transduced by the adenovirus for emerin KD. Scale bars, 25 μm. (B) Distribution of fibrillogenesis scores in control and emerin KD cells. Higher scores represent more fibrillogenesis (Fig. S6). A score of 5 indicates several continuous fibers over the cell body; a score of 1 indicates only one short fiber at a single edge of a cell. The plot shows the distribution of scores in Ctrl and Emkd at 8 and 24 h. (C) Comparison of the mean (95% CI) of fibrillogenesis scores in the control and emerin KD cells. The mean scores (95% CI) were as follows: Ctrl-8hr, 1.78 (1.56–2.00); Emkd-8hr, 0.50 (0.38–0.63); Ctrl-24hr, 2.71 (2.18–3.24); Emkd-24hr, 0.93 (0.64–1.22). ∗∗∗p < 0.001; n.s. denotes that differences are not significant. Data were analyzed from three biological replicates. (D) Fibronectin protein expression in control and emerin KD cells that were replated and cultured for 24 h after the 4-day knockdown or control treatment. Two technical replicates from each condition are shown. (E) Relative fibronectin protein levels at 24 h. Bars and whiskers represent mean ± standard error of the mean, based on five biological replicates. Relative protein levels were as follows (mean ± standard error of the mean). For fibronectin: Ctrl, 0.97 ± 0.04; Emkd, 0.26 ± 0.10. For emerin: Ctrl, 1.03 ± 0.04; Emkd, 0.15 ± 0.05. ∗∗∗p < 0.001.
Figure 6
Figure 6
Featured phenotypes of acute emerin KD in fetal lung fibroblasts. Unstretched control fibroblasts grew in random directions, and after stretch they aligned perpendicularly to the axis of stretch. Actin filaments traversed the nuclear surface and the cells assembled fibronectin in ECM. Emerin KD cells were larger and more circular. Upon stretch, emerin KD cells exhibited less alignment than control cells. In emerin KD cells, actin filaments were disconnected from the nuclei, and cells demonstrated less effective fibronectin assembly. These findings indicate that acute emerin downregulation diminishes nuclear-cytoskeletal coupling and reduces fibronectin assembly.

References

    1. Wozniak M.A., Chen C.S. Mechanotransduction in development: a growing role for contractility. Nat. Rev. Mol. Cell Biol. 2009;10:34–43. - PMC - PubMed
    1. Mammoto T., Ingber D.E. Mechanical control of tissue and organ development. Development. 2010;137:1407–1420. - PMC - PubMed
    1. De Vries J.I., Visser G.H., Prechtl H.F. The emergence of fetal behaviour. II. Quantitative aspects. Early Hum. Dev. 1985;12:99–120. - PubMed
    1. Natale R., Nasello-Paterson C., Connors G. Patterns of fetal breathing activity in the human fetus at 24 to 28 weeks of gestation. Am. J. Obstet. Gynecol. 1988;158:317–321. - PubMed
    1. Patrick J., Campbell K., et al. Richardson B. Patterns of human fetal breathing during the last 10 weeks of pregnancy. Obstet. Gynecol. 1980;56:24–30. - PubMed

Publication types

MeSH terms

LinkOut - more resources