. 2023 Jul 5;33(14):8921-8941.
doi: 10.1093/cercor/bhad171.

Comprehensive volumetric phenotyping of the neonatal brain in Down syndrome

Affiliations

Comprehensive volumetric phenotyping of the neonatal brain in Down syndrome

Abi Fukami-Gartner et al. Cereb Cortex. .

Abstract

Down syndrome (DS) is the most common genetic cause of intellectual disability with a wide range of neurodevelopmental outcomes. To date, there have been very few in vivo neuroimaging studies of the neonatal brain in DS. In this study we used a cross-sectional sample of 493 preterm- to term-born control neonates from the developing Human Connectome Project to perform normative modeling of regional brain tissue volumes from 32 to 46 weeks postmenstrual age, accounting for sex and age variables. Deviation from the normative mean was quantified in 25 neonates with DS with postnatally confirmed karyotypes from the Early Brain Imaging in DS study. Here, we provide the first comprehensive volumetric phenotyping of the neonatal brain in DS, which is characterized by significantly reduced whole brain, cerebral white matter, and cerebellar volumes; reduced relative frontal and occipital lobar volumes, in contrast with enlarged relative temporal and parietal lobar volumes; enlarged relative deep gray matter volume (particularly the lentiform nuclei); and enlargement of the lateral ventricles, amongst other features. In future, the ability to assess phenotypic severity at the neonatal stage may help guide early interventions and, ultimately, help improve neurodevelopmental outcomes in children with DS.

Keywords: Down syndrome; magnetic resonance imaging; neonate; normative modeling; volumetric.


Figures

Fig. 1
Fig. 1
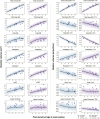
Normative modeling of absolute WBVs in neonates. GPR plots of absolute WBVs for females (in purple) and males (in blue) from 32 to 46 weeks PMA. Descriptions of ICV, TBV, and TTV can be found in Table 1. The normative mean appears as a bolded black curve, whereas shaded areas represent ±1, 2, and 3 standard deviations (SD) from the normative mean. Transparent gray dots represent control neonates (n = 243 females and n = 250 males). Data for the DS cohort (n = 25) are shown for females (purple dots, n = 12) and males (blue dots, n = 13).
Fig. 2
Fig. 2
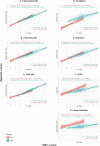
Normative modeling of main tissue classes in absolute and relative volume. GPR modeling of the main tissue classes of the brain from 32 to 46 weeks PMA. Plots for absolute volumes (in cm3) appear on the left side, whereas plots for relative volumes (i.e. proportion of TTV, TBV, or ICV) appear on the right side. The normative mean appears as a black bolded curve, whereas shaded areas represent ±1, 2, and 3 SD from the normative mean. Dots for control neonates are not shown for better visualization. Data for DS neonates (n = 25) are shown for females (purple dots, n = 12) and males (blue dots, n = 13). Lighter shaded dots for both females and males indicate DS neonates with a CHD (n = 13, 5 males and 8 females). GPR plots for all specific tissue segments can be found in Supplementary Fig. S1.
Fig. 3
Fig. 3
3D brain visualization of the median absolute volume z-score by tissue segment for neonates with DS. 3D brain visualization indicating the median absolute volume z-score (in SD) by tissue segment for the DS group. pFDR values can be found listed in Table 3 by tissue segment. The median absolute volume z-score is indicated by a color scale, whereby red indicates a negative deviation from the normative mean (i.e. z < 0, a smaller volume than control), white indicates no significant deviation from control (i.e. z ~ 0), and blue indicates a positive deviation (i.e. z > 0, a larger volume than control). 3D brain visualization for (a) cortical GM segments, (b) WM segments, and (c) deep GM and other segments. Axes: A = anterior, P = posterior, R = right, L = left.
Fig. 4
Fig. 4
3D brain visualization of the median relative volume z-score by tissue segment for neonates with DS. 3D brain visualization indicating the median relative volume z-score (in SD) by tissue segment for the DS group. pFDR values can be found listed in Table 4 by tissue segment. The median relative volume z-score is indicated by a color scale, whereby red indicates a negative deviation from the normative mean (i.e. z < 0, a smaller proportion of WBV than control), white indicates no significant deviation in proportion from control (i.e. z ~ 0), and blue indicates a positive deviation (i.e. z > 0, a larger proportion of WBV than control). 3D brain visualizations for (a) cortical GM segments, (b) WM segments, and (c) deep GM and other segments. Axes: A = anterior, P = posterior, R = right, L = left.
Fig. 5
Fig. 5
Covariation analysis of absolute volume z-scores against WBV z-scores using linear and median regression. Plots of absolute volume z-scores against WBV z-scores (i.e. ICV, TBV, or TTV). Plots for the (a) total cortical GM, (b) total deep GM, (c) total WM, (d) cerebellum, (e) brainstem, (f) eCSF, and (g) lateral ventricles. Dots for control neonates (n = 493, females and males) appear in blue, with colored linear regressions and colored 95% confidence intervals. Dots for neonates with DS (n = 25, females and males) appear in red, with colored linear regressions and colored 95% confidence intervals. Additionally, dotted black lines indicate quartile regressions (first quartile, median, and third quartile). Parameters for the linear regressions appear in the top left (i.e. equation, R2, adjusted R2, F- and P-value), whereas parameters for the median regressions appear in the bottom right of each graph (i.e. equation and AIC). Plots for all other specific tissue segments can be found in Supplementary Fig. S5. A table comparing WBV-adjusted median z-scores in DS vs control groups can be found in Supplementary Table S7.
Fig. 6
Fig. 6
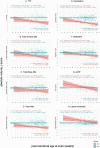
Simple linear regression of absolute volume z-scores against PMA at scan for whole brain and main tissue volumes. Simple linear regression plots of absolute volume z-scores against PMA at scan from 32 to 46 weeks for (a) the whole brain (i.e. TTV) and main tissue classes of the brain, including (b) the total cortical GM, (c) the total deep GM, (d) the total WM, (e) the cerebellum, (f) the brainstem, (g) the eCSF, and (h) the lateral ventricles. Dots for individual control neonates (n = 493, females and males consolidated) appear in blue, and linear regressions appear as flat blue lines at z = 0 with 95% confidence intervals. Dots for individual neonates with DS (n = 25, females and males) appear in red, and linear regressions appear as red lines with 95% confidence intervals. For additional information, dotted black lines indicate the median regression. Parameters for DS and control linear regressions appear in the top left (i.e. equation, R2, adjusted R2, F- and P-value), whereas parameters for the median regressions appear in the bottom right of each graph (i.e. equation and AIC). Linear regression plots for all other specific tissue segments can be found in Supplementary Fig. S3 and a table of results for F-tests in Supplementary Table S5.
Fig. 7
Fig. 7
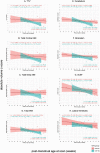
Simple linear regression of absolute volume z-scores against PMA at scan for whole brain and main tissue volumes in CHD+ and CHD− neonates with DS. Simple linear regression plots of absolute volume z-scores against PMA at scan from 32 to 46 weeks for (a) the WBV (i.e. TTV) and main tissue classes of the brain, including (b) the total cortical GM, (c) the total deep GM, (d) the total WM, (e) the cerebellum, (f) the brainstem, (g) the eCSF, and (h) the lateral ventricles. CHD+ neonates with DS (n = 13) appear in blue, whereas CHD− neonates with DS (n = 12) appear in pink. Linear regressions appear as colored lines with 95% confidence intervals, whereas for additional information, dotted black lines indicate the median regression. Parameters for the linear regressions appear in the top left (i.e. equation, R2, adjusted R2, F-statistic, and P-value), whereas parameters for the median regressions appear in the bottom right of each graph (i.e. equation and AIC). Plots for all other specific tissue segments can be found in Supplementary Fig. S4 and a table of results for F-tests in Supplementary Table S9.
Fig. 8
Fig. 8
Age-related differences between CHD+ and CHD− neonates with DS. 3D brain visualization of the F ratio (from the extra sum-of-squares F-test) for tissue segments, in which the slope or intercept of CHD+ and CHD− linear regressions were significantly different prior to multiple comparison correction (P uncorrected < 0.05) between CHD+ and CHD− neonates with DS. Importantly, only the F-test for the occipital WM remained significant after multiple comparison correction (pFDR < 0.05) (see Supplementary Table S9). Axes: A = anterior, P = posterior.

References

    1. Accogli A, Addour-Boudrahem N, Srour M. Diagnostic approach to cerebellar hypoplasia. Cerebellum. 2021:20:631–658. - PubMed
    1. Antonarakis SE, Skotko BG, Rafii MS, Strydom A, Pape SE, Bianchi DW, Sherman SL, Reeves RH. Down syndrome. Nat Rev Dis Prim. 2020:6:1–20. - PMC - PubMed
    1. Aylward EH, Habbak R, Warren AC, Margaret B, Barta PE, Jerram M, Pearlson GD. Cerebellar volume. Arch Neurol. 1997a:54:209–212. - PubMed
    1. Aylward EH, Li Q, Habbak R, Warren A, Pulsifer MB, Barta PE, Jerram M, Pearlson G. Basal ganglia volume in adults with down syndrome. Psychiatry Res - Neuroimaging. 1997b:74:73–82. - PubMed
    1. Aylward EH, Li Q, Honeycutt NA, Warren AC, Pulsifer MB, Barta PE, Chan MD, Smith PD, Jerram M, Pearlson GD. MRI volumes of the hippocampus and amygdala in adults with Down’s syndrome with and without dementia. Am J Psychiatry. 1999:156:564–568. - PubMed

Publication types