. 2023 Dec;91(12):1558-1570.
doi: 10.1002/prot.26533. Epub 2023 May 31.

To split or not to split: CASP15 targets and their processing into tertiary structure evaluation units

Affiliations

To split or not to split: CASP15 targets and their processing into tertiary structure evaluation units

Andriy Kryshtafovych et al. Proteins. 2023 Dec.

Abstract

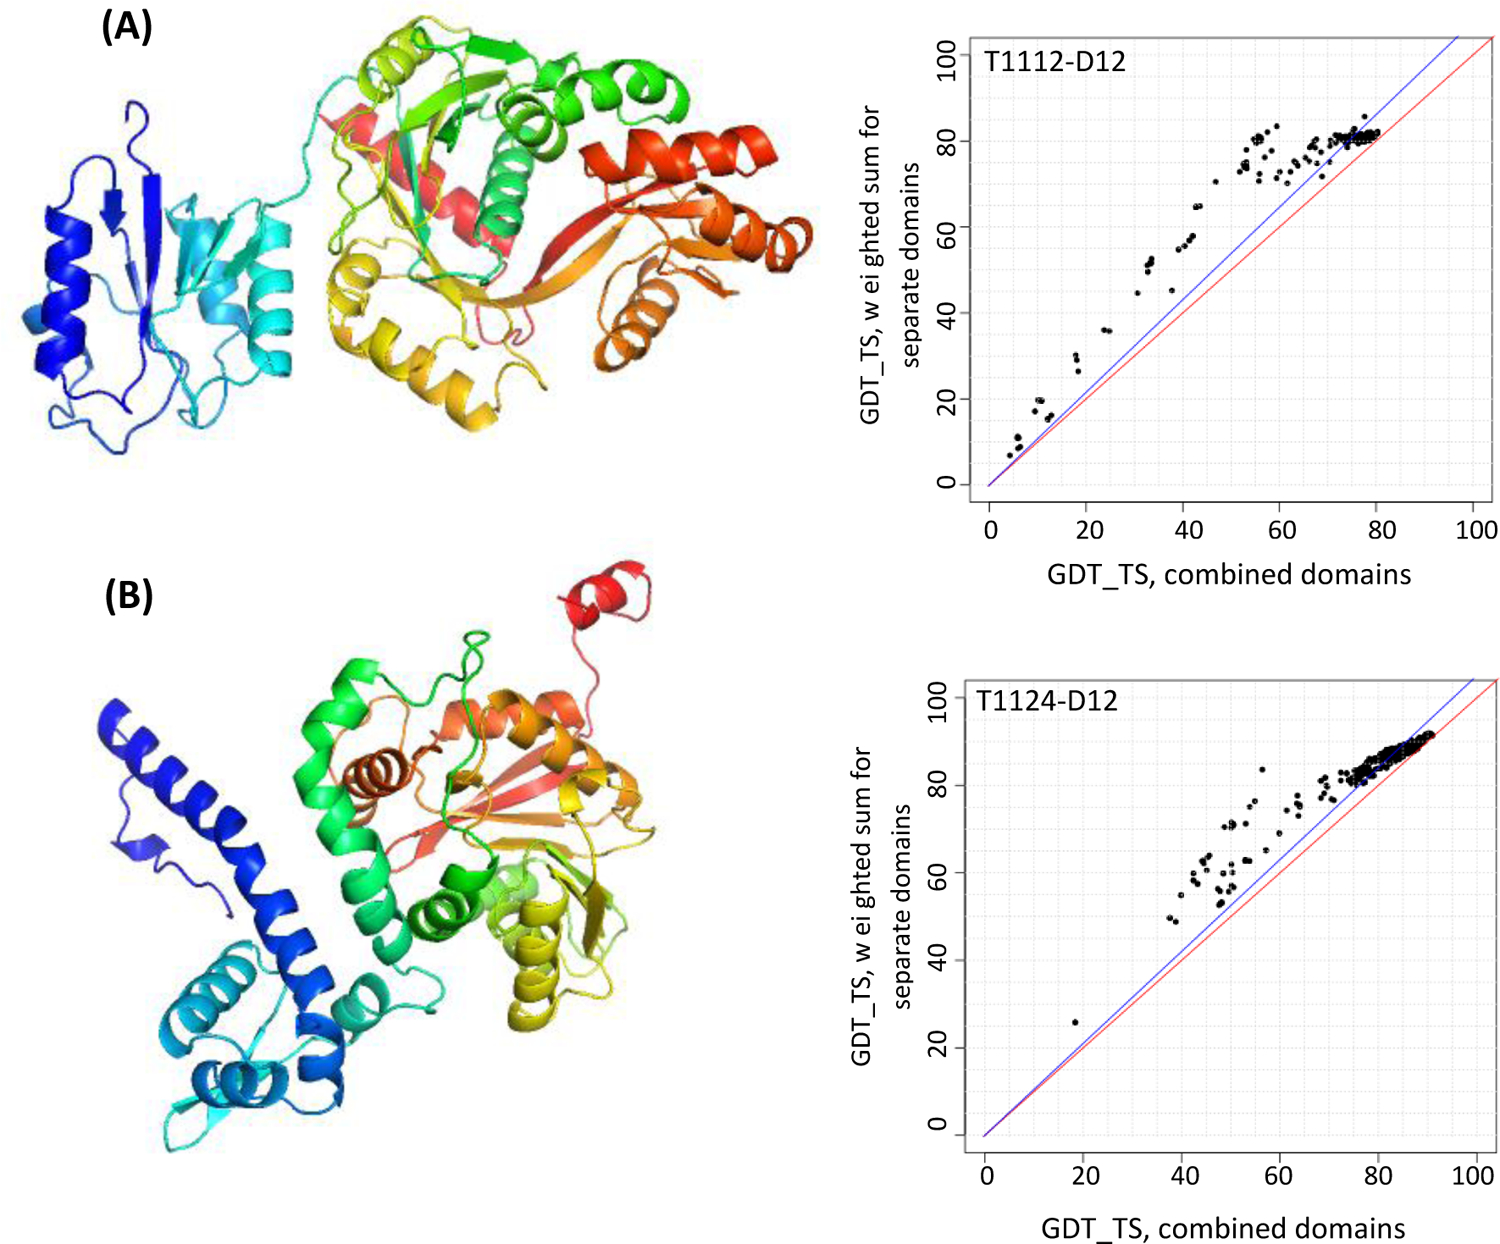
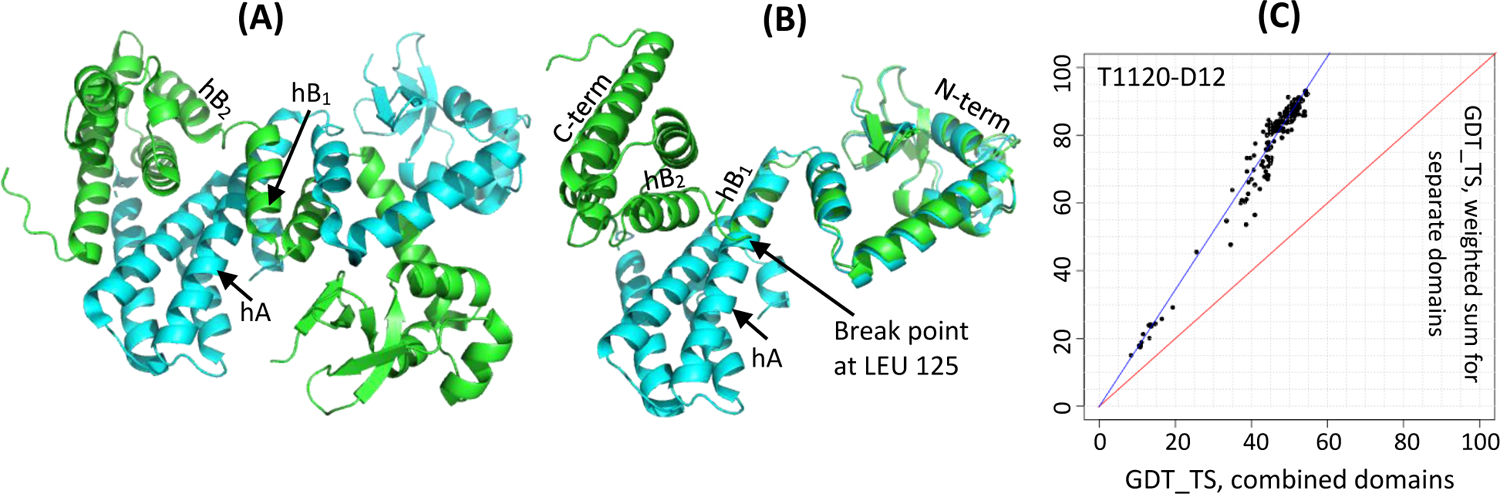
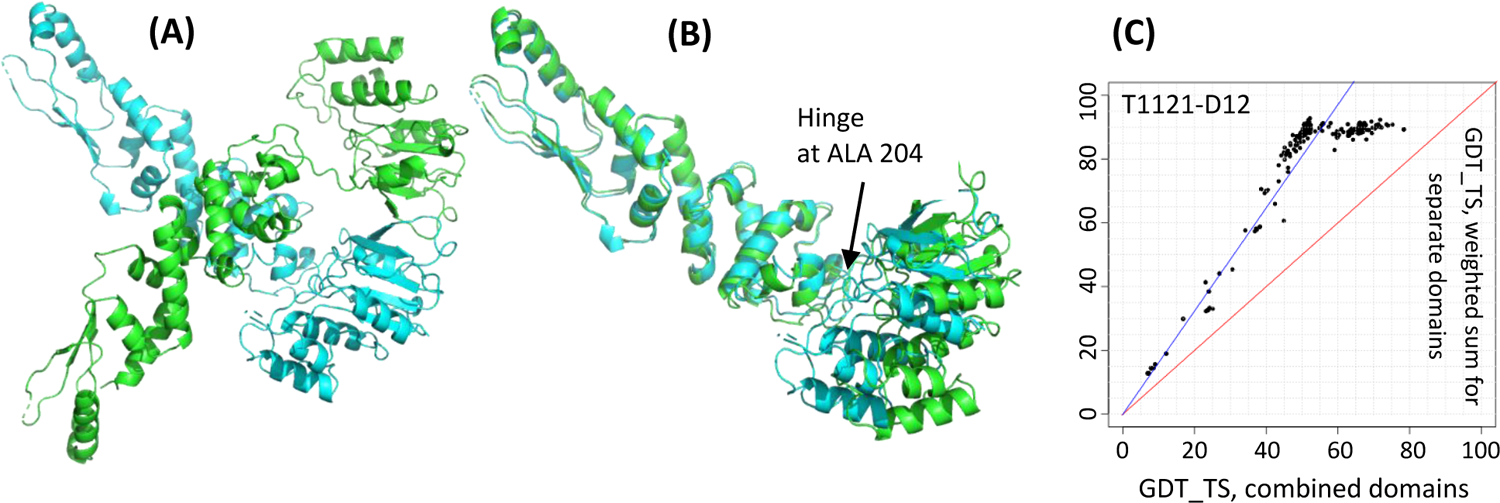
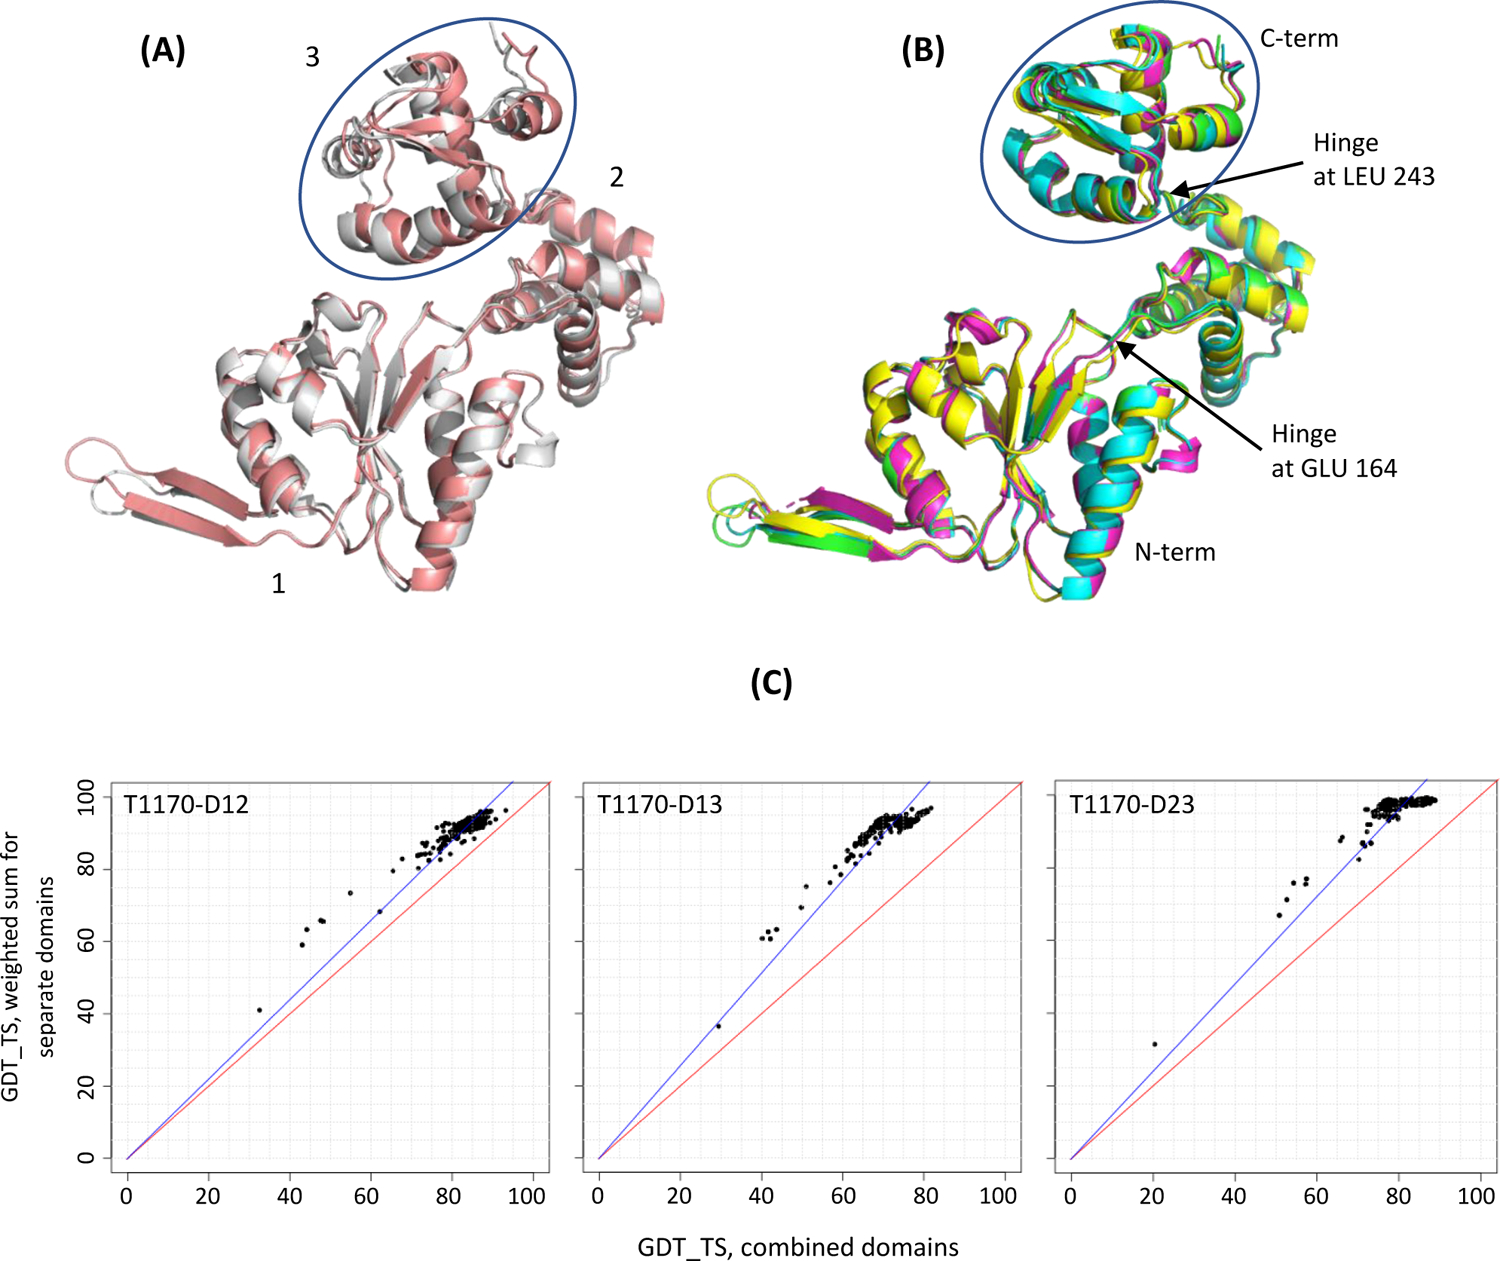
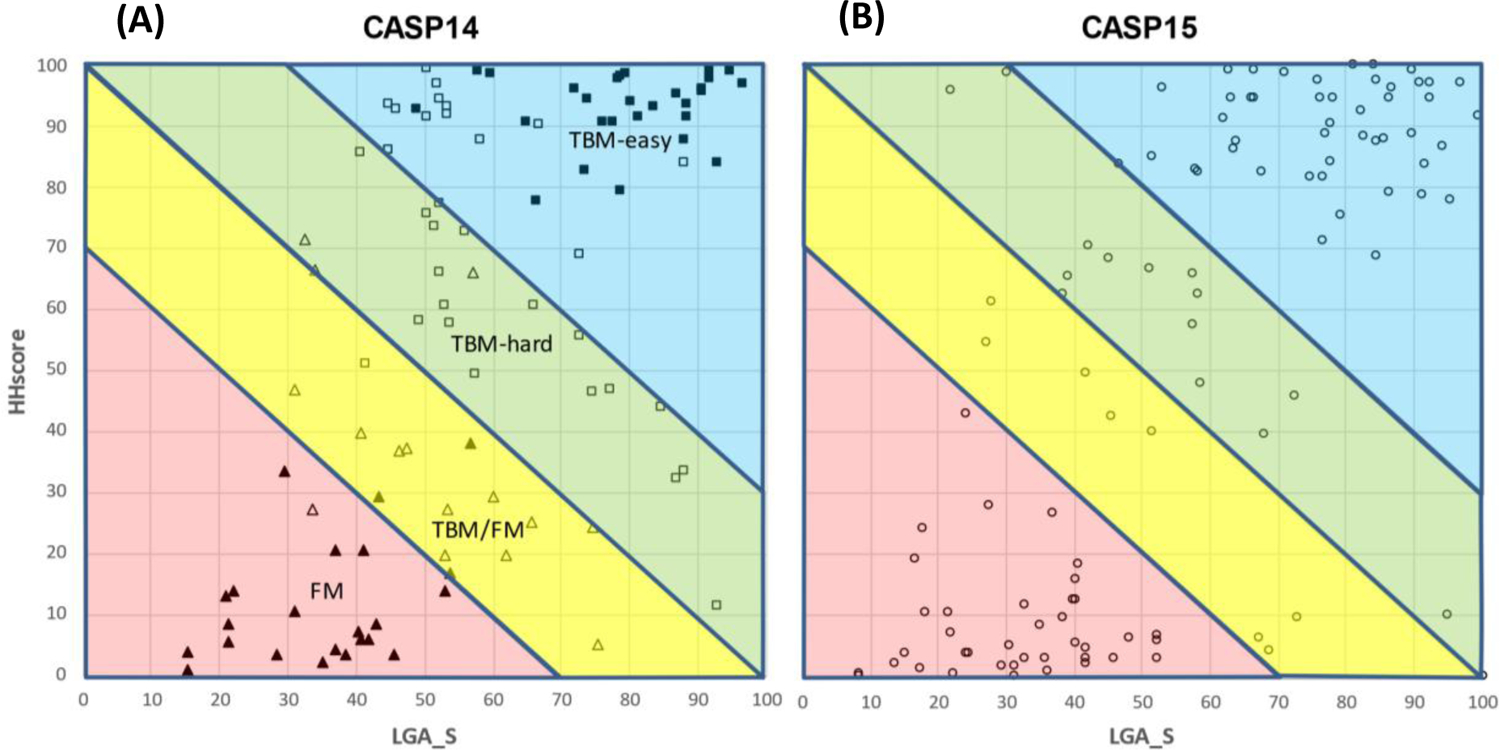
Processing of CASP15 targets into evaluation units (EUs) and assigning them to evolutionary-based prediction classes is presented in this study. The targets were first split into structural domains based on compactness and similarity to other proteins. Models were then evaluated against these domains and their combinations. The domains were joined into larger EUs if predictors' performance on the combined units was similar to that on individual domains. Alternatively, if most predictors performed better on the individual domains, then they were retained as EUs. As a result, 112 evaluation units were created from 77 tertiary structure prediction targets. The EUs were assigned to four prediction classes roughly corresponding to target difficulty categories in previous CASPs: TBM (template-based modeling, easy or hard), FM (free modeling), and the TBM/FM overlap category. More than a third of CASP15 EUs were attributed to the historically most challenging FM class, where homology or structural analogy to proteins of known fold cannot be detected.

Keywords: CASP15; evaluation units; protein domains; protein structure; protein structure prediction.


Figures

Figure 1.
Figure 1.
PyMOL target renderings (left) and Grishin plots (right) for two two-domain targets: (A) target T1112, a protein involved in the synthesis of an osmolyte involved in thermoadaptation, and (B) target T1124, a methyltransferase MfnG (PDB: 7UX8). Grishin plots are built on the GDT_TS scores for all collected models. The plots suggest evaluating domains together as the angle between the data trend line and the diagonal is small (i.e., the evaluation scores for the combined domains (X-axis) and individual domains (Y-axis) are similar for most groups).
Figure 2.
Figure 2.
Target T1120, a DNA-binding protein DdrC (PDB: 7QVB). (A) a homodimer with two chains colored as cyan and green; (B) superposition of two chains showing the break point in the helix hA at residue LEU 125; (C) a Grishin plot showing the need for splitting (large angle between the data trend line and the diagonal). The plot was built on the GDT_TS results for all participating groups on the constituent domains D1: 8–125 and D2: 126–235 and the whole target in the chain A configuration.
Figure 3.
Figure 3.
Target T1121, a DNA-cleavage protein JetD (PDB: 7TIL). (A) a homodimer with two chains colored as cyan and green; (B) superposition of its two chains showing flexibility of the C-term domain (Pfam DUF2220, right) with respect to the N-term arm-like domain (DUF3322, left); (C) a Grishin plot showing the need for splitting. The plot was built on the GDT_TS results for all groups on the constituent domains D1: 2–204 and D2: 205–381 and the whole target in the chain A configuration.
Figure 4.
Figure 4.
Target T1170, a Holliday junction hexamer (PDB: 7PBR). (A) superposition of two deformed chains versus (B) four undeformed chains in the same frame of reference. The domain that moves the most with respect to other two is encircled. (C) Grishin plots for the original target split into three domains show the similarity of results on domains 1, 2 and their combination 12 (left panel, points close to the diagonal), and the dissimilarity of results on the combined substructures 13 and 23 and their constituent domains (middle and right).
Figure 5.
Figure 5.
An ABC transporter (A) in apo state, T1158, colored from N-terminal (blue) to C-terminal (red); (B) in one of the bound states, T1158v4, colored from N-terminal to C-terminal; and (C) as split into two EUs: D1 (blue): 48–234,347–394,409–615,861–974 and D2 (red): 235–346,692–860,975–1296.
Figure 6.
Figure 6.
(A) A two-EU target T1154 as originally split into four domains (colored from blue to red). (B) Grishin plots for selected pairs of four original domains of T1154 as numbered in panel A. The upper panel in section (B) shows that domains 1 and 2 should remain separate for evaluation, while domains 2, 3 and 4 (bottom panels) should be joined.
Figure 7.
Figure 7.
(A) Target T1169, a mosquito protein relevant to pathogen transmission (PDB:8FJP) with four evaluation units defined: D1: 1–345; D2: 1302–2735; D3: 378–699,1223–1301; D4: 700–1222. (B) Parsing of SGS1 into domains as suggested by the authors of the structure. (C) Top HHsearch hits showing similarity of the query sequence to known folds in two areas: 395–670 (intermediate domain between the two beta-propellers - see panel B) and 1718–2735 (region after the lectin-CRD domain and up to the TM domain).
Figure 8.
Figure 8.
Scatter plot of evaluation units in CASP14 (A, left) and CASP15 (B, right) represented by sequence (HHscore, Y-axis) and structure (LGA_S, X-axis) scores of the top template. Evaluation units in the left panel are marked according to the difficulty categories as manually assigned in CASP14: full squares – TBM-easy; hollow squares – TBM-hard; hollow triangles –TBM/FM; full triangles – FM. Targets of the same difficulty cluster together in the suggested (X,Y) axes. An automatic delineation of EUs into four classes (X+Y<70, red; 70–100, yellow; 100–130 green; >130, blue) based on the results of sequence- and structure-based searches of the PDB is suggested to mimic the CASP14 difficulty categories. The schema is applied to define target prediction classes in CASP15 (right panel).

Similar articles

Cited by

References

    1. Moult J, Pedersen JT, Judson R, Fidelis K. A large-scale experiment to assess protein structure prediction methods. Proteins 1995;23(3):ii–v. - PubMed
    1. Moult J, Fidelis K, Kryshtafovych A, Schwede T, Tramontano A. Critical assessment of methods of protein structure prediction (CASP)-Round XII. Proteins 2018;86 Suppl 1:7–15. - PMC - PubMed
    1. Kryshtafovych A, Schwede T, Topf M, Fidelis K, Moult J. Critical assessment of methods of protein structure prediction (CASP)-Round XIII. Proteins 2019;87(12):1011–1020. - PMC - PubMed
    1. Kryshtafovych A, Schwede T, Topf M, Fidelis K, Moult J. Critical assessment of methods of protein structure prediction (CASP)-Round XIV. Proteins-Structure Function and Bioinformatics 2021;89(12):1607–1617. - PMC - PubMed
    1. Cheng H, Schaeffer RD, Liao Y, Kinch LN, Pei J, Shi S, Kim BH, Grishin NV. ECOD: an evolutionary classification of protein domains. PLoS Comput Biol 2014;10(12):e1003926. - PMC - PubMed