. 2023 May;131(5):55001.
doi: 10.1289/EHP11807. Epub 2023 May 31.

Humidity's Role in Heat-Related Health Outcomes: A Heated Debate

Affiliations

Humidity's Role in Heat-Related Health Outcomes: A Heated Debate

Jane W Baldwin et al. Environ Health Perspect. 2023 May.

Abstract

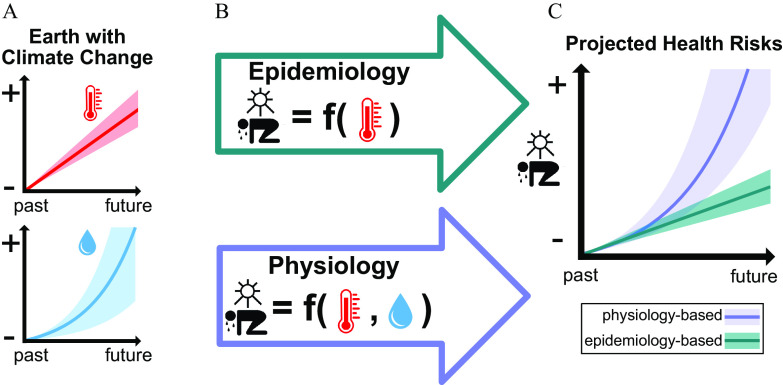
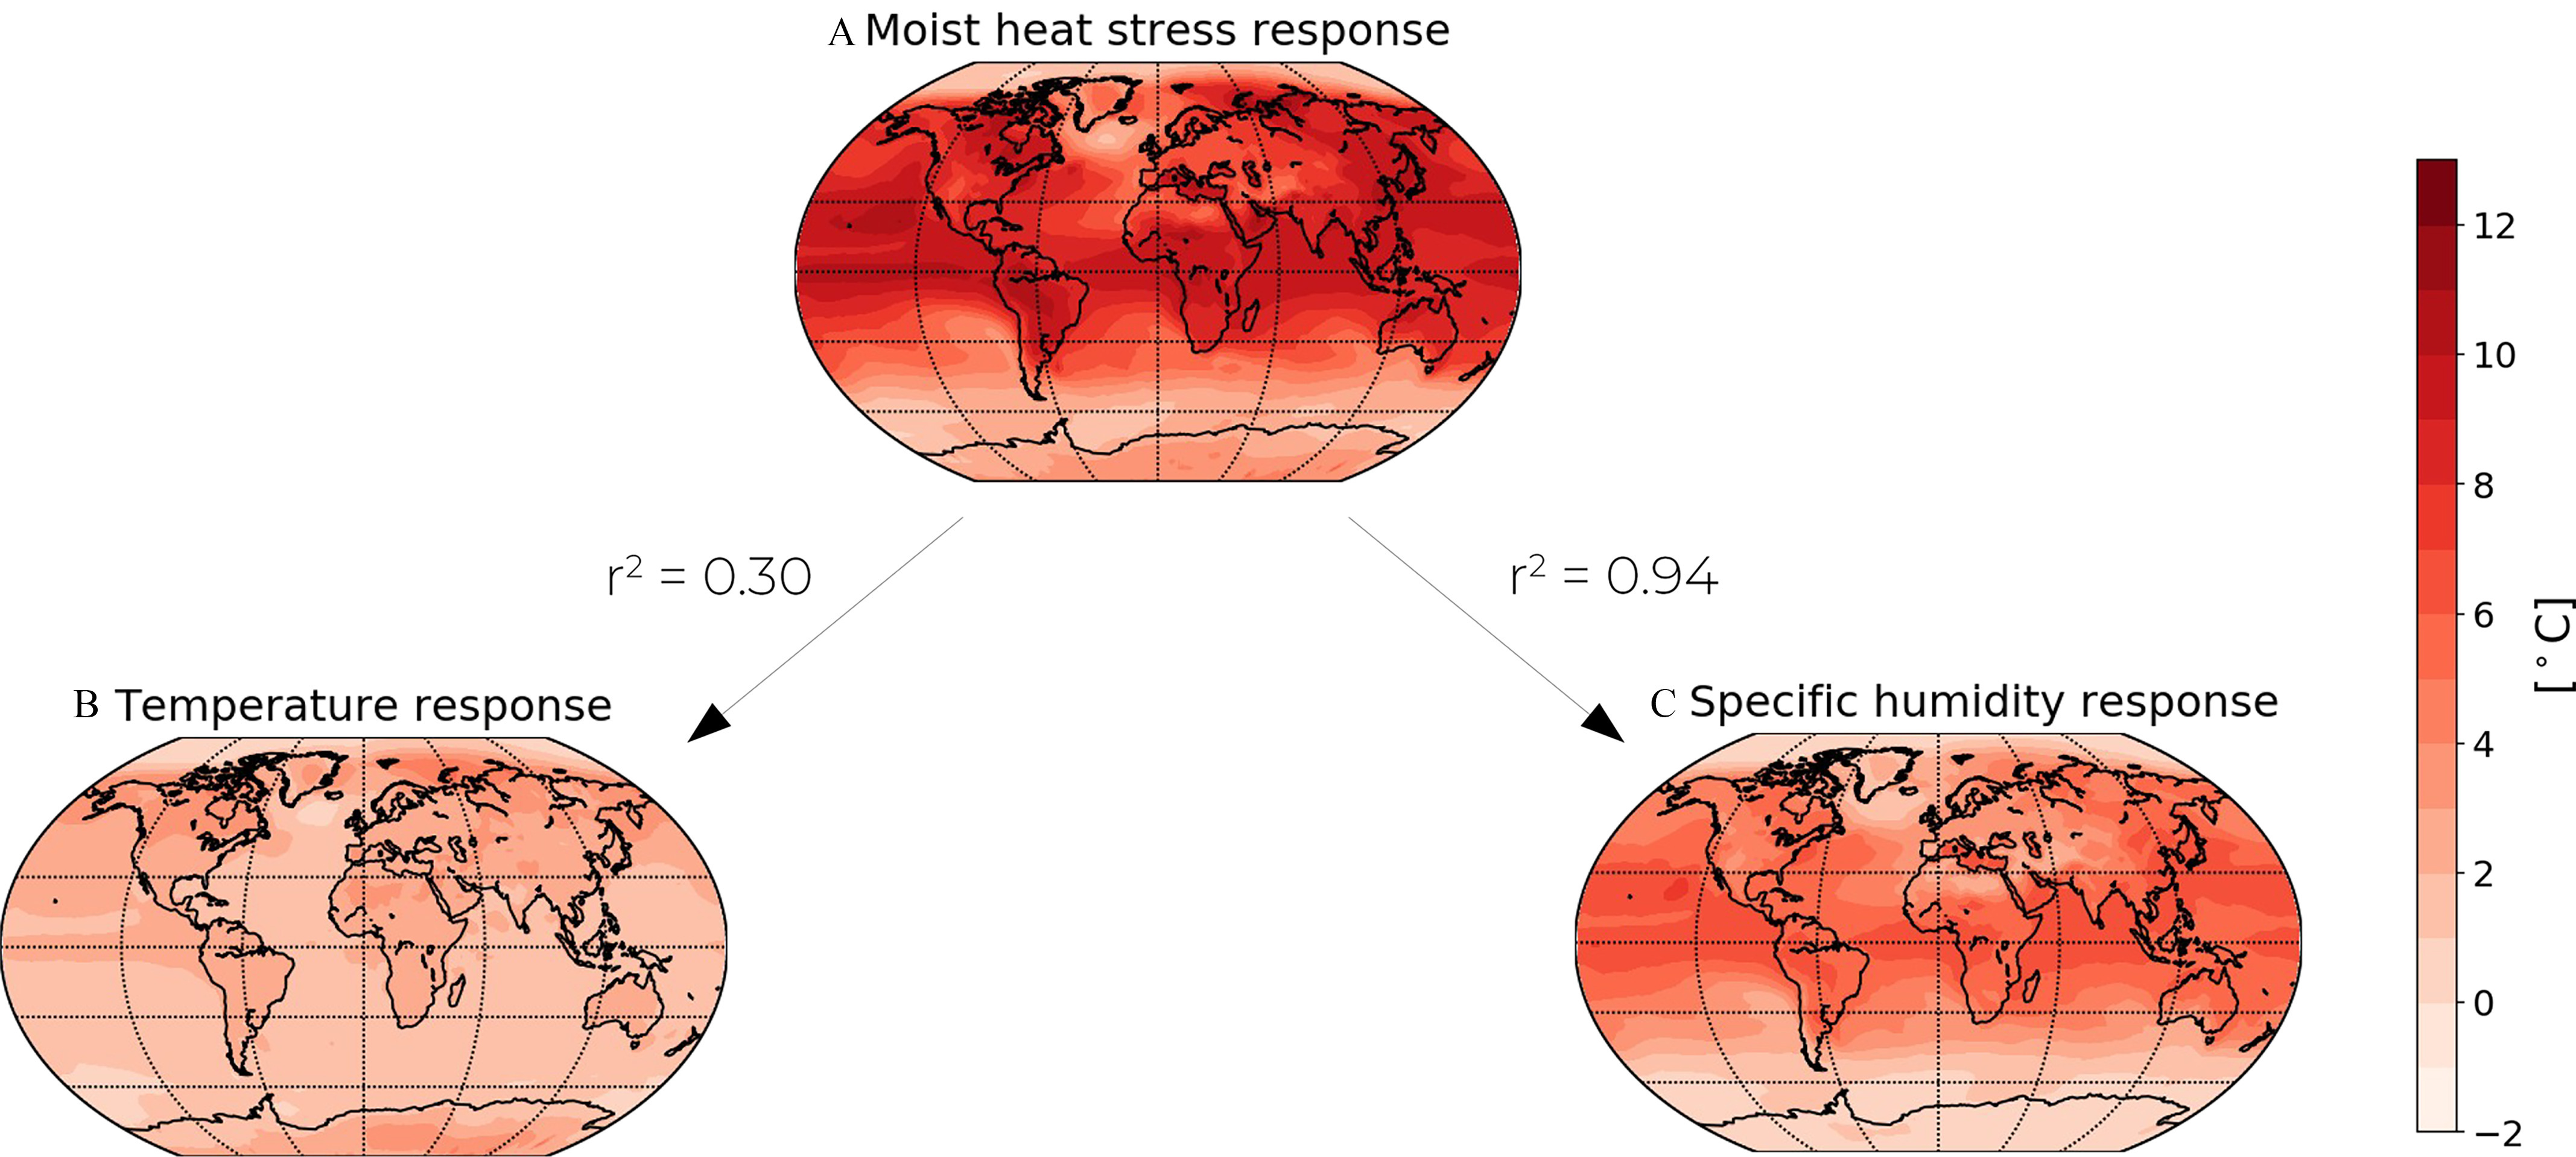
Background: As atmospheric greenhouse gas concentrations continue to rise, temperature and humidity will increase further, causing potentially dire increases in human heat stress. On physiological and biophysical grounds, exposure to higher levels of humidity should worsen heat stress by decreasing sweat evaporation. However, population-scale epidemiological studies of heat exposure and response often do not detect associations between high levels of humidity and heat-related mortality or morbidity. These divergent, disciplinary views regarding the role of humidity in heat-related health risks limit confidence in selecting which interventions are effective in reducing health impacts and in projecting future heat-related health risks.

Objectives: Via our multidisciplinary perspective we seek to a) reconcile the competing realities concerning the role of humidity in heat-related health impacts and b) help ensure robust projections of heat-related health risks with climate change. These objectives are critical pathways to identify and communicate effective approaches to cope with present and future heat challenges.

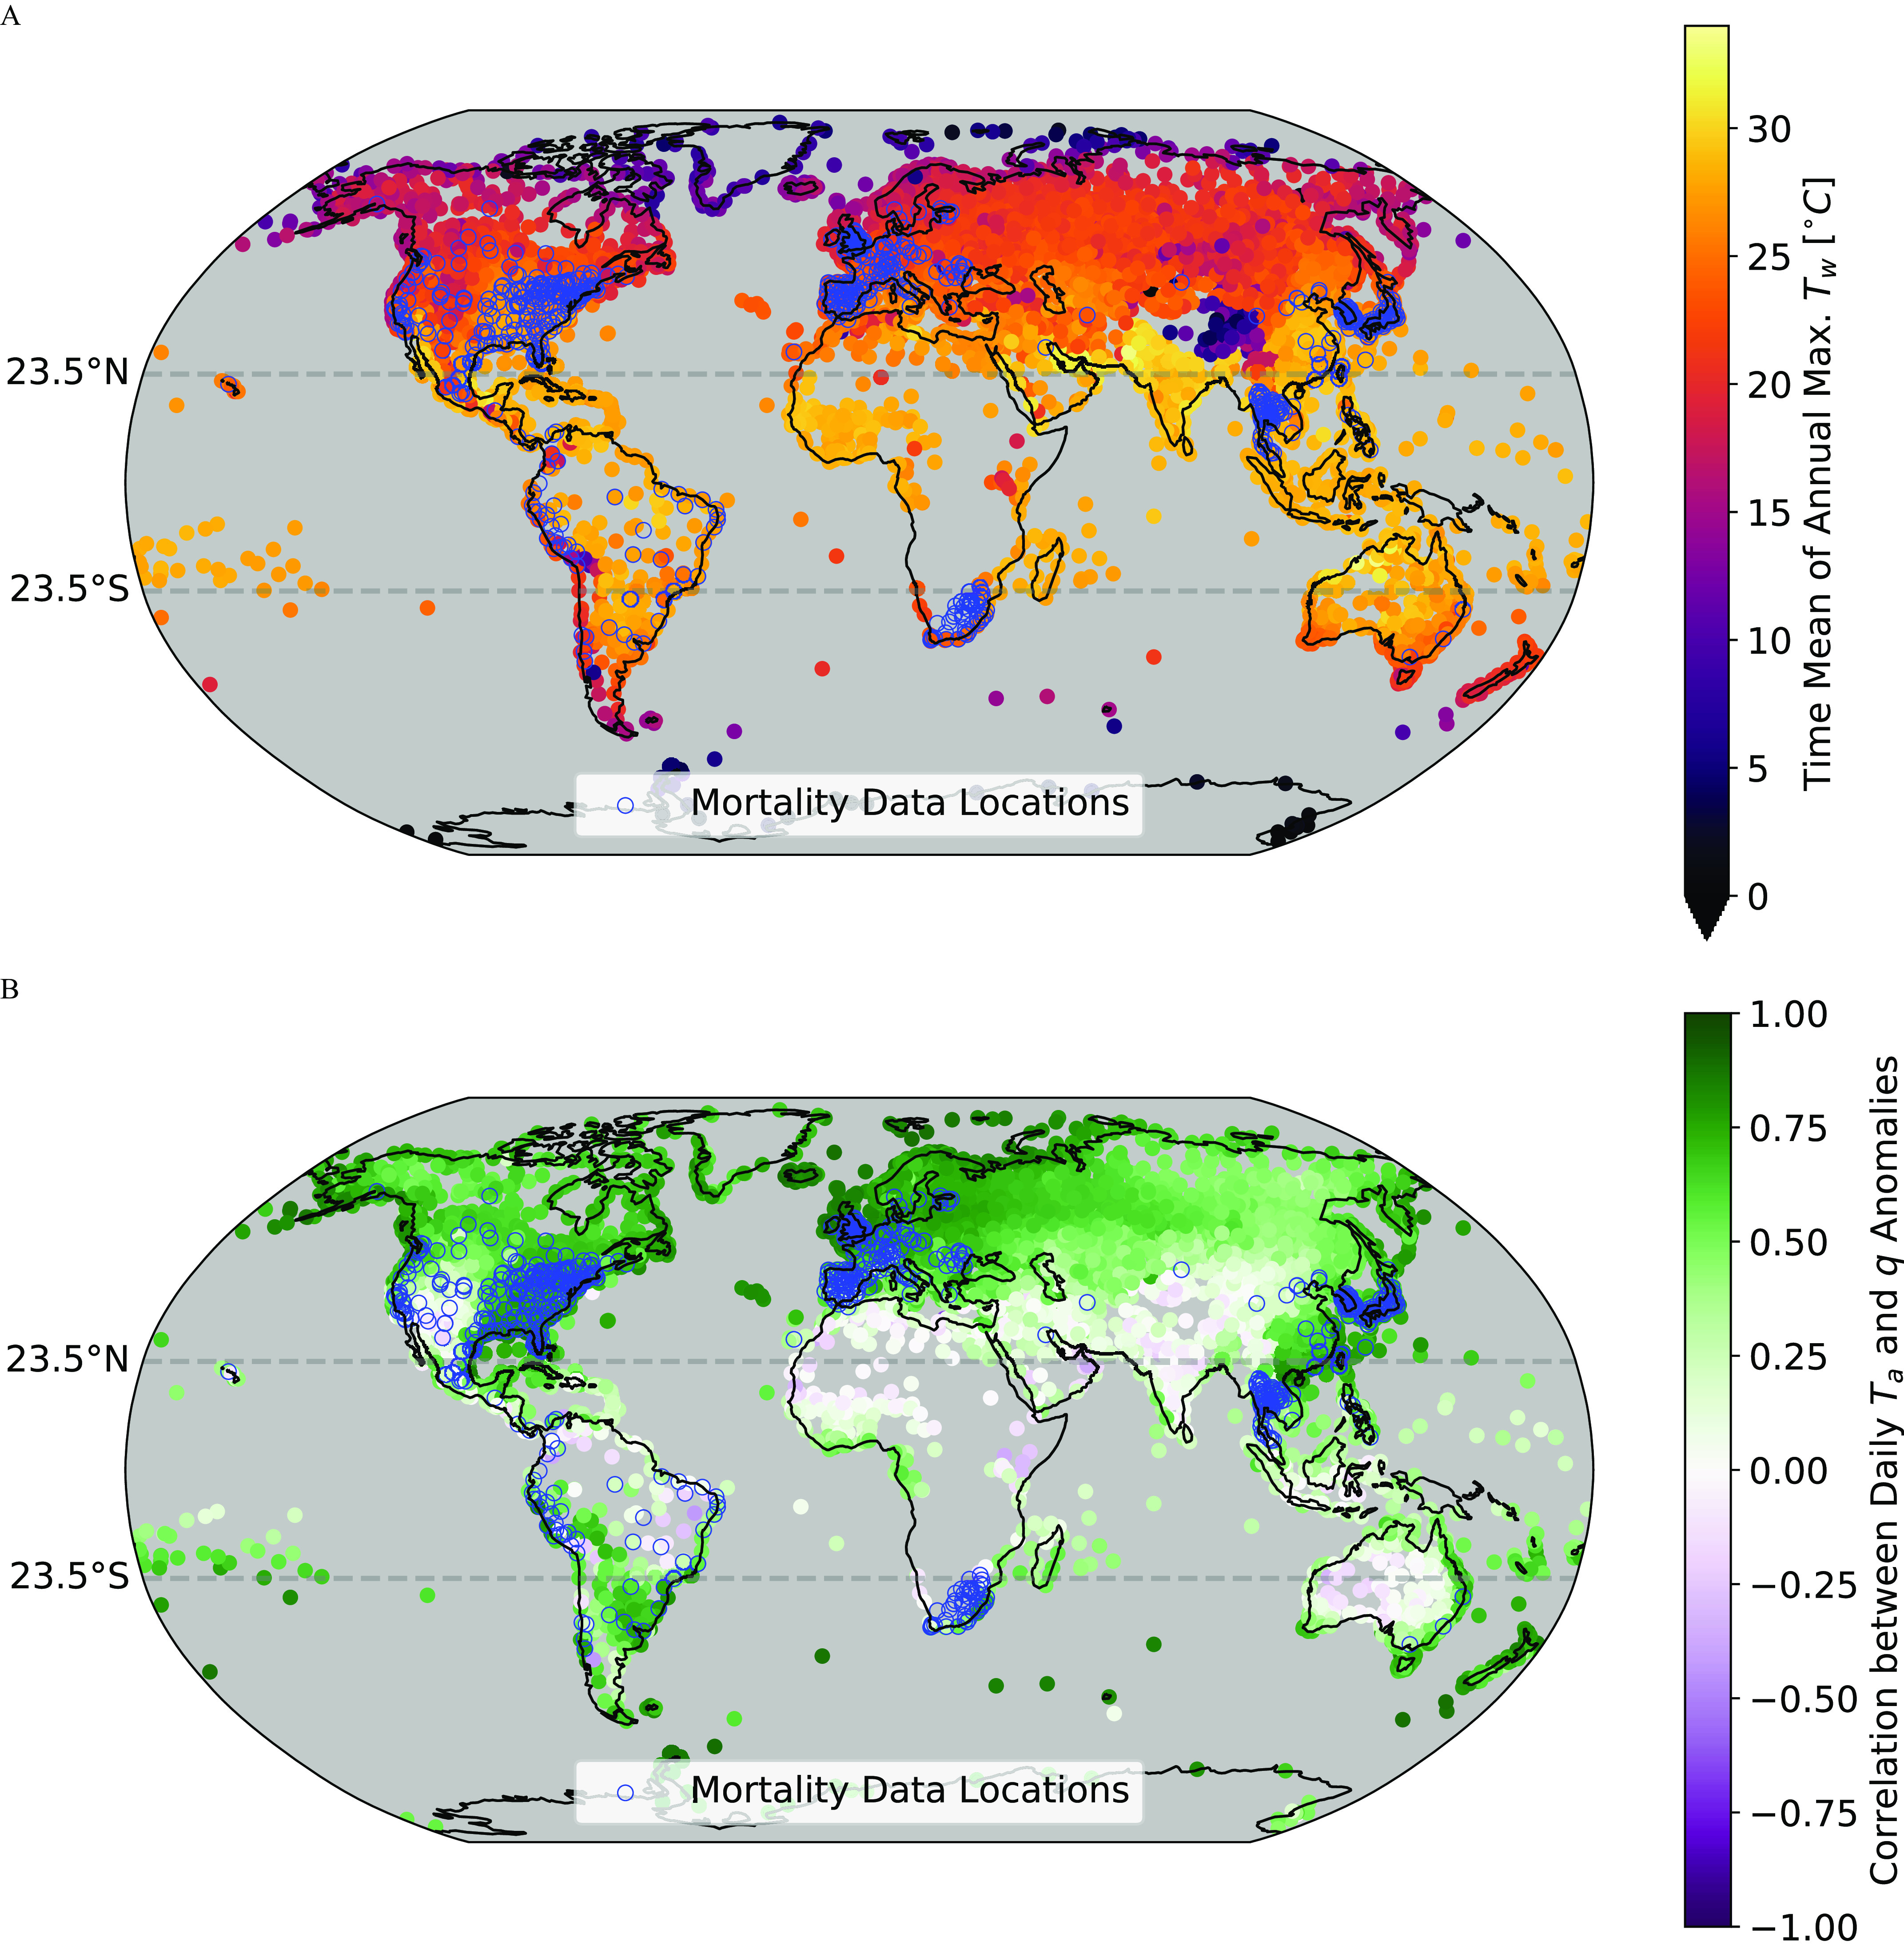
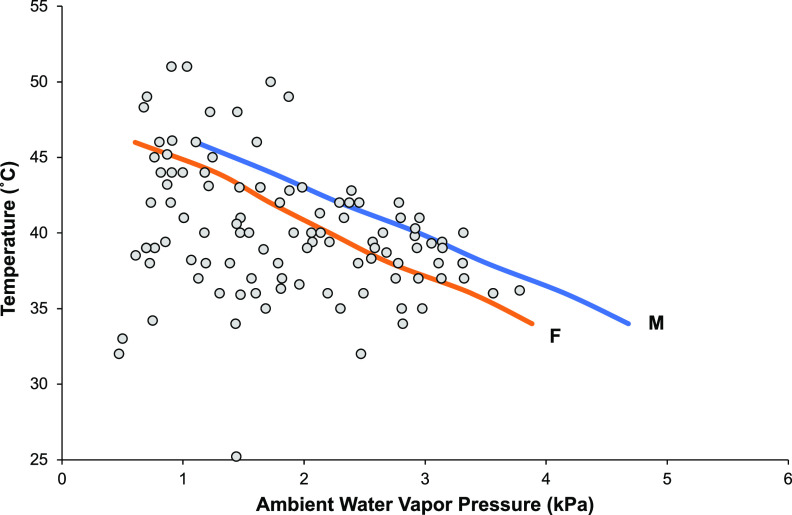
Discussion: We hypothesize six key reasons epidemiological studies have found little impact of humidity on heat-health outcomes: a) At high temperatures, there may be limited influence of humidity on the health conditions that cause most heat-related deaths (i.e., cardiovascular collapse); b) epidemiological data sets have limited spatial extent, a bias toward extratropical (i.e., cooler and less humid), high-income nations, and tend to exist in places where temporal variations in temperature and humidity are positively correlated; c) analyses focus on older, vulnerable populations with sweating, and thus evaporative, impairments that may be further aggravated by dehydration; d) extremely high levels of temperature and humidity (seldom seen in the historical record) are necessary for humidity to substantially impact heat strain of sedentary individuals; e) relationships between temperature and humidity are improperly considered when interpreting epidemiological model results; and f) sub-daily meteorological phenomena, such as rain, occur at high temperatures and humidity, and may bias epidemiological studies based on daily data. Future research must robustly test these hypotheses to advance methods for more accurate incorporation of humidity in estimating heat-related health outcomes under present and projected future climates. https://doi.org/10.1289/EHP11807.


Figures

Figure 1A is a set of two ribbon plus line graphs titled Earth with climate change, plotting negative to positive (y-axis) across past and future (x-axis) for temperature and humidity. Figure 1B is a set of two illustrations. On the top, inside an arrow pointing right, an illustration depicts epidemiology where a human stick figure is kneeling down owing to sun exposure equaling a function of high temperature exposures. At the bottom, inside an arrow pointing right, an illustration depicts physiology where a human stick figure is kneeling down owing to sun exposure equaling a function of shorter-duration exposures to both high temperature and humidity (among other variables). Figure 1C is a ribbon plus line graph titled projected health risks, plotting negative to positive with a human stick figure kneeling down owing to sun exposure (y-axis) across past to future (x-axis) for physiology based and epidemiology based.
Figure 1.
Flowchart illustrating the central problems proposed in this commentary. (A) With increasing atmospheric greenhouse gasses, temperature (top, red projection) and humidity (moisture in the atmosphere; bottom, blue projection) increase, with nonlinear, growing increases for humidity. (B) According to epidemiologists (darker outline, turquoise arrow), heat-related health outcomes, such as excess all-cause mortality including cardiovascular collapse, should primarily follow daily temperature exposures; but according to physiologists (lighter outline, purple arrow), heat strain and stroke should follow shorter-duration exposures to both temperature and humidity (among other variables)., (C) We propose that the physiologists’ perspective with a strong role for humidity would result in faster increases in adverse heat–health outcomes with warming (lighter, purple projection) compared with the epidemiologists’ perspective (darker, turquoise projection). Note that this is an illustration and does not incorporate actual data—for example, the light colored shading schematically illustrates uncertainty in climate change projections. Hypothesized resolutions to this discrepancy are summarized in Tables 2 and 3.
Figure 2 is an illustration flowchart with one step. Figure 2A: A moist heat stress response with an image of a world map leads to Figure 2B, a temperature response with an image of a world map, and Figure 2C, a specific humidity response with an image of a world map. A scale depicting degrees Celsius ranging from negative 2 to 12 in increments of 2.
Figure 2.
Changes in moist heat stress metrics following global warming are strongly correlated with changes in specific humidity. (A) Multi-model mean change in the 98th percentile of daily equivalent potential temperature (which scales with wet-bulb temperature). (B) Multi-model mean change in air temperature, conditioned on the 98th percentile of daily equivalent potential temperature. (C) Multi-model mean change in specific humidity (converted to degrees Celsius), conditioned on the 98th percentile of equivalent potential temperature. Output from transient warming simulations (CO2 concentrations are increased at 1%/y) of 14 CMIP6 models is analyzed; each panel plots the annual mean comparing years 71–80 and years 1–10 of near-surface (2-m) atmospheric quantities. This figure uses data from Lutsko, and methods and particular model simulations used are described in detail in that paper. Note: CMIP6, Coupled Model Intercomparison Project Phase 6; CO2, carbon dioxide.
Figure 3A is an image of a world map depicting the time mean of the annual maximum wet-bulb temperature, which is overlaid with locations of mortality data that were used in a recent study attributing heat-related mortality to climate change. A scale depicts time mean of annual maximum uppercase italic t begin subscript lowercase italic w end subscript open bracket degrees Celsius closed bracket ranging from 0 to 30 in increments of 5. Figure 3B is an image of a world map depicting the correlation between daily anomalies of 2-meter air temperature and specific humidity. A scale depicts the correlation between daily uppercase italic T subscript a and lowercase italic q anomalies ranging from negative 1.00 to 1.00 in increments of 0.25.
Figure 3.
Historical temperature and humidity conditions compared to locations of available mortality data. (A) Time mean of annual maximum wet-bulb temperature from stations in HadISD (version 3.1.2.202104p), overlaid with locations of mortality data (blue circles) used in a recent study attributing heat-related mortality from climate change, (B) Same data sources as (A), but instead plotting correlation between daily anomalies of 2-m air temperature and specific humidity. Anomalies are calculated as deviations from the daily resolution seasonal cycle for each station. In both (A and B), gray dashed lines demarcate latitude bounds of the tropics. Note: max, maximum; q, specific humidity; Ta, air temperature; Td, dew point; Tw, wet-bulb temperature.
Figure 4 is a graph, plotting temperature (degrees Celsius), ranging from 25 to 55 in increments of 5 (y-axis) across absolute humidity (kilopascals), ranging from 0 to 6 in unit increments with lines for a male and a female, and with grey points for past observed weather.
Figure 4.
Environmental constraints on sweating efficiency compared to historical extreme heat data. Threshold combinations of temperature and humidity for a sedentary man (blue) and woman (orange) at which further increases in humidity will theoretically increase thermoregulatory strain because of reductions in sweating efficiency (i.e., the proportion of sweat that evaporates). For context, the hottest single 1-h temperature and accompanying ambient water vapor pressure from the airport weather stations of 108 global cities across a 13-y period (1 January 2007 to 31 December 2019) are plotted (solid black circles). Five cities with the largest populations were selected in specific countries across all six habitable continents (North America, Europe, Asia, South America, Oceania, and Africa) to represent a wide range of hot weather conditions. Data underlying this figure can be found in Excel Tables S1 and S2. Note: F, female; M, male.

References

    1. Dang TN, Honda Y, Van Do D, Pham ALT, Chu C, Huang C, et al. . 2019. Effects of extreme temperatures on mortality and hospitalization in Ho Chi Minh City, Vietnam. Int J Environ Res Public Health 16(3):432, PMID: , 10.3390/ijerph16030432. - DOI - PMC - PubMed
    1. Ebi KL, Capon A, Berry P, Broderick C, de Dear R, Havenith G, et al. . 2021. Hot weather and heat extremes: health risks. Lancet 398(10301):698–708, PMID: , 10.1016/S0140-6736(21)01208-3. - DOI - PubMed
    1. Basagaña X, Sartini C, Barrera-Gómez J, Dadvand P, Cunillera J, Ostro B, et al. . 2011. Heat waves and cause-specific mortality at all ages. Epidemiology 22(6):765–772, PMID: , 10.1097/EDE.0b013e31823031c5. - DOI - PubMed
    1. Oudin Åström D, Schifano P, Asta F, Lallo A, Michelozzi P, Rocklöv J, et al. . 2015. The effect of heat waves on mortality in susceptible groups: a cohort study of a Mediterranean and a northern European city. Environ Health 14:30, PMID: , 10.1186/s12940-015-0012-0. - DOI - PMC - PubMed
    1. Tuholske C, Caylor K, Funk C, Verdin A, Sweeney S, Grace K, et al. . 2021. Global urban population exposure to extreme heat. Proc Natl Acad Sci USA 118(41):e2024792118, PMID: , 10.1073/pnas.2024792118. - DOI - PMC - PubMed

Publication types