. 2023 May 31;7(6):e0164.
doi: 10.1097/HC9.0000000000000164. eCollection 2023 Jun 1.

Microbiota transfer following liver surgery involves microbial extracellular vesicle migration that affects liver immunity

Affiliations

Microbiota transfer following liver surgery involves microbial extracellular vesicle migration that affects liver immunity

Shmuel J Cohen et al. Hepatol Commun. .

Abstract

Background: Short-term perioperative administration of probiotics was shown to alleviate postoperative complications and promote liver recovery among patients undergoing resection for liver malignancy. The mechanisms by which probiotic bacteria effectively influence the gut microbiome composition during the perioperative time are controversial. Here, we aim to elucidate the short-term direct biological effect of probiotic microbiota-derived vesicles on host liver cells during the perioperative period.

Methods: Probiotic-derived vesicles (pbMVs) were administered postoperatively. pbMVs were isolated and characterized from probiotics, mainly from the bacteria genus Lactobacillus, Bifidobacterium, and Lactococcus. Mice underwent bile duct ligation, sham laparotomy (SHAM), or 70% partial hepatectomy (70%PH). pbMVs were tracked in vivo, and intrahepatic cellular and molecular aspects were analyzed by flow cytometry and qRT-PCR techniques. Liver sinusoidal endothelial cells (LSECs) analysis for Vascular Cell Adhesion Molecule-1(VCAM-1) expression following pbMV stimulation of cultured liver non-parenchymal cells which had been activated by LPS.

Results: The administered pbMV rapidly translocated to the liver after surgery. pbMV administrations following surgeries enhanced neutrophil clearance; there was a dramatic decline in the liver neutrophil-to-lymphocyte ratio Ly6G+/CD3+ and an increase in IL6 levels. pbMVs reduced intrahepatic VCAM1 and ICAM2 expression compared with control following SHAM and decrease in IL10 levels following 70%PH. The administration of pbMV improved liver regeneration 72 hours following surgical liver resection with a significant decrease in IL17 expression. pbMVs modulated VCAM-1 on liver sinusoidal endothelial cells in liver cell culture.

Conclusions: Our study findings provide mechanistic insights into the liver-gut axis following surgery and illustrate how probiotic vesicles can reduce adhesion molecule expression and affect immune cell invasion and liver immunity, resulting in improved liver recovery following hepatic surgery.


Conflict of interest statement

The authors declare that the research was conducted in the absence of any commercial or financial relationships that could be construed as a potential conflict of interest.

Figures

None
Graphical abstract
FIGURE 1
FIGURE 1
An in vivo observation tracking study: representative IVIS picture shows fluorescent tracking of intragastrically administered probiotic bacterial EVs. pbMVs were stained for bacterial epitopes using anti-LTA biotinylated antibody followed by secondary Ab and streptavidin Cy5. Bacterial EVs were administered intragastrically following a 12-hour fast. (A) Representative whole-body IVIS images of a mouse after a 12-hour fast and intragastric administration of bacterial EV showing EV migration through the GI tract 1 hour after administration (multispectral viewing) in comparison to a nonfeeding control mouse (left). (B) Enlargement of image number 11 shown in (A). Abbreviations: LTA, lipoteichoic acid; pbMV, probiotic-derived vesicle.
FIGURE 2
FIGURE 2
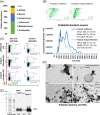
Characterization of probiotic-derived EV. (A) Bar graph representing microbial community composition at the genus level. (B) Isolated bacterial EVs from the probiotic dried powder of commercial food supplement products. Measurements of probiotic bacterial EV diameters by a nanoparticle tracking analysis system for unfiltered or 0.45-µm–filtered bacterial EV fractions (overlay histogram). (C) FACS analysis of bacterial outer membrane epitope, anti-LTA (left), and control (right). The percent positive population was measured using gated populations, with the gate set for control at >1% of the control population. For control stains, we used a secondary biotinylated antibody followed by streptavidin APC. (D) Structural analysis of EVs by transmission electron microscopy. Uranyl acetate–stained electron micrographs of outer membrane vesicles and EV enrichment fraction from a probiotic source. Size bars indicate 200 nm (upper), 500 nm (bottom left), and 2 µm (bottom right). (E) Western blot analysis of LTA anchored to the gram-positive bacteria outer membrane vesicles (well 1) (pbMVs), cell-free media (well 2), or anchored to bacteria membrane (well 3); the same protein concentration was used for pbMVs and cell-free media. Abbreviations: LTA, lipoteichoic acid; MVs, membrane vesicles.
FIGURE 3
FIGURE 3
Bacterial EV administration following 70%PH and SHAM laparotomy: an in vivo observation tracking study. Whole-body and liver IVIS images of intrahepatic-migrating bacteria: pbEVs were stained with anti-LTA antibody and administered intragastrically at POD3 following 70%PH (A). The EV-treated group (bottom) and the vehicle-treated group (upper) were compared with the ROI tool by surrounding the right lobe area (blue line). Graph showing average radiant counts per field (left) or maximum radiant efficiency counts (right), n = 6–8/group. The results represent 2–3 different experiments. Hepatectomy was performed following perfusion, and livers were analyzed by IVIS 60 minutes after bacterial EV administration (A; right). Graph showing average radiant counts per field (n = 5/group, results of 2 independent studies). (B) IVIS images of excised livers 90 minutes after intragastric administration of probiotic EVs at POD4 (upper, n = 6/group superior side) and controls [bottom, vehicle (phosphate buffered saline), n = 6/group superior side]. Radiant efficiency was quantified by automatic ROI (blue line and arrow) for both the superior and inferior sides of the livers and showed average values (n = 6/group, results of 2 independent studies). (C) Small particle FACS analysis using the FACSymphony A1 cell analyzer. Recipient mice were treated as described in (C). Livers were processed for bacterial EVs FACS analysis as described. The upper panel shows a positive-to-negative APC-LTA-labeled pbMVs gated population on SP SCC-H to the APC axis, and the middle panel shows an SSC-H/FSC-H gated population. The bottom panel shows gated populations on SP-SSC-H to the BB515 axis. BB515-labeled beads (middle) were used to set size analysis parameters. Graph showing the percent of population (n = 3/group). Data are represented as mean ± SD; *p < 0.05, **p < 0.01 by Student t test. Abbreviations: APC, allophycocyanin; LTA, lipoteichoic acid; pbMV, probiotic-derived vesicle; PH, partial hepatectomy.
FIGURE 4
FIGURE 4
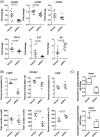
Effects of pbMV interventions on liver immune cell accumulation, cytokines, chemokines, and adhesion molecule transcript levels in livers following SHAM laparotomy: pbMVs were administered intragastrically to mice recipients after SHAM laparotomy. Vehicle (saline)-administered mice served as controls. Removed livers were analyzed for mRNA expression (A). Fold change relative to the vehicle was calculated. VCAM1, ICAM1, ICAM2, TGF-β, IL10, and IL6 transcripts were analyzed by qRT-PCR. (A) Livers were analyzed at POD4 following pbMV administrations (n=7–8/group, results of 2 independent studies). (B) Flow cytometric quantification of CD11+, Ly6G+, and CD3+ cells in nonparenchymal liver cells performed 4 days after SHAM laparotomy and after intragastric administration of pbMVs (n = 4/group). Shown are the relative populations of the nonparenchymal liver cells (upper panel) and the total cell numbers (lower panel). (C) Liver neutrophil-to-T lymphocytes ratio, an NLR-like ratio (as analyzed for B), was calculated using the relative abundance (upper) and total cell numbers (lower) data of Ly6G+ and CD3+ cells. Data are represented as mean ± standard deviation; *p < 0.05, **p < 0.01, and ***p < 0.001 by Student t test. Abbreviations: ICAM1, intercellular adhesion molecule-1; NLR, neutrophils-to-lymphocytes ratio; pbMV, probiotic-derived vesicle; VCAM1, vascular cell adhesion molecule-1.
FIGURE 5
FIGURE 5
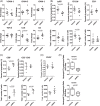
Effects of pbMV interventions on liver immune cell accumulation, cytokines, chemokines, and adhesion molecule transcript levels in livers following 70%PH: pbMVs were administered intragastrically to mice recipients after 70%PH. Vehicle (saline)-administered mice served as controls. Removed livers were analyzed for mRNA expression (A). Fold change relative to the vehicle was calculated. VCAM1, ICAM1, ICAM2, TGF-β, IL10, and IL6 transcripts were analyzed by qRT-PCR. (A) Livers were analyzed following pbMV administrations (n=6–8/group, results of 2 independent studies). (B) Flow cytometric quantification of CD11+, Ly6G+, and CD3+ in nonparenchymal liver cells performed at POD3 after 70%PH and after intragastric administration of pbMVs (n = 6–8/group, results of 2 independent studies). (C) Quantification of CD8 T (CD3+/CD8+) and CD4 T (CD3+/CD8-) cells (n=3/group). (D) Quantification of CD45+ cells (n=3/group). (E) Neutrophils-to-lymphocytes ratio–like ratios were calculated as analyzed for Figure 3C. Data are represented as mean ± SD; *p < 0.05 and **p < 0.01 by Student t test. Abbreviations: ICAM1, intercellular adhesion molecule-1; NLR, neutrophils-to-lymphocytes ratio; pbMV, probiotic-derived vesicle; VCAM1, vascular cell adhesion molecule-1.
FIGURE 6
FIGURE 6
Postsurgical sterile pbMVs intervention following 70%PH improve liver regeneration. Mice (C57bl/6) underwent 70%PH followed by intragastrically administrated sterile pbMVs. Removed livers were weighed, and livers lobes were processed to single-cell suspension, snap frozen in liquid nitrogen, or fixed by formalin. (A) The percentage of the remaining liver-to-body weight ratio was evaluated on day 3 (72 h) after surgery (left), qRT-PCR showed relative messenger RNA expression in the liver, cyclin D1, and cyclin A2 fold change levels compared with vehicle (middle, n=8–9/group, results of 2 independent studies). Immunohistochemistry stains of the formalin-fixed liver for Ki67-positive cells (representative figures are shown). The percent of Ki67-positive hepatocytes (right) from total hepatocytes in the field was calculated (10 fields per slide, n=8–9/group, results of 2 independent studies). (B) Removed livers were analyzed for mRNA expression. Il17 fold change relative to vehicle mRNA expression was analyzed by qRT-PCR (n = 7–9/group, results of 2 independent studies). Data are represented as mean ± SD; *p < 0.05 and **p < 0.01 by Student t test. Abbreviations: pbMV, probiotic-derived vesicle.
FIGURE 7
FIGURE 7
Effect of probiotic microbiota vesicles on induced LPS–activated VCAM-1 expression on LSEC in an ex vivo nonparenchymal liver cells culture. The nonparenchymal liver cells were treated for 18 hours with LPS (B), pbMVs or LTA (C), or LPS 0.1 µg/mL plus pbMVs (0.1–50 µg/mL) or LTA (0.1–10 µg/mL) (D). (A) Flow cytometry gating strategy following doublets and aggregated exclusion. APC-CD146+/PE-CD11b gated cells (on NPC gate) were examined for LSEC and gated Alexa-fluor 405-CD106 high on LSEC used for VCAM-1 expression on LSEC analysis. Representative analysis for LPS-treated cells (lower left panel) and LPS + pbMV (lower right panel). (B–D) The cells were treated for 18 hours with (B) LPS, (0.1–100 µg/mL), (C) pbMVs or LTA, and (D) medium culture with LPS 0.1 µg/mL plus pbMVs or LTA. Results show the mean ± SD of 3 experiments. *p < 0.05 and **p < 0.01 by Student t test. Abbreviations: APC, allophycocyanin; LPS, lipopolysaccharide; LTA, lipoteichoic acid; LSECs, liver sinusoidal endothelial cells; pbMV, probiotic-derived vesicle; VCAM1, vascular cell adhesion molecule-1.

References

    1. Siu J, McCall J, Connor S. Systematic review of pathophysiological changes following hepatic resection. HPB (Oxford). 2014;16:407–21. - PMC - PubMed
    1. Ueda K, Turner P, Gagner M. Stress response to laparoscopic liver resection. HPB (Oxford). 2004;6:247–52. - PMC - PubMed
    1. Peralta C, Jimenez-Castro MB, Gracia-Sancho J. Hepatic ischemia and reperfusion injury: effects on the liver sinusoidal milieu. J Hepatol. 2013;59:1094–106. - PubMed
    1. Ray S, Mehta NN, Golhar A, Nundy S. Post hepatectomy liver failure—a comprehensive review of current concepts and controversies. Ann Med Surg. 2018;34:4–10. - PMC - PubMed
    1. Hibi T, Kitagawa Y. Small-for-size syndrome in LT. Clin Liver Dis (Hoboken). 2017;10:93–6. - PMC - PubMed

Substances