Prediction of distant metastasis and specific survival prediction of small intestine cancer patients with metastasis: A population-based study
- PMID: 37255376
- PMCID: PMC10417179
- DOI: 10.1002/cam4.6166
Prediction of distant metastasis and specific survival prediction of small intestine cancer patients with metastasis: A population-based study
Abstract
Background: Small intestine cancer (SIC) is difficult to diagnose early and presents a poor prognosis due to distant metastasis. This study aimed to develop nomograms for diagnosing and assessing the prognosis of SIC with distant metastasis.
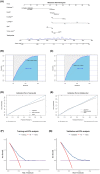
Methods: Patients diagnosed with SIC between 2010 and 2015 were included from the Surveillance, Epidemiology and End Results database. Univariate and multifactor analysis determined independent risk factors for distant metastasis and prognostic factors for overall and cancer-specific survival. We then constructed the corresponding three nomograms and assessed the diagnostic accuracy of the nomograms by net reclassification improvement, receiver operating characteristic curves and calibration curves, assessed the clinical utility by decision curve analysis.
Results: The cohort consisted of 6697 patients, of whom 1299 had distant metastasis at diagnosis. Tstage, Nstage, age, tumor size, grade, and histological type were independent risk factors for distant metastasis. Age, histological type, T stage, N stage, grade, tumor size, whether receiving surgery, number of lymph nodes removed, and the presence of bone or lung metastases were predictors of both overall survival and cancer-specific survival. The nomograms showed excellent accuracy in predicting distant metastasis and prognosis.
Conclusion: Nomograms were developed and validated for SIC patients with distant metastasis, aiding physicians in making rational and personalized clinical decisions.
Keywords: cancer-specific survival; distant metastases; nomogram; overall survival; small intestine cancer.
© 2023 The Authors. Cancer Medicine published by John Wiley & Sons Ltd.
Figures


Similar articles
-
Risk factors, prognostic factors, and nomograms for distant metastasis in patients with diagnosed duodenal cancer: A population-based study.World J Gastrointest Oncol. 2024 Apr 15;16(4):1384-1420. doi: 10.4251/wjgo.v16.i4.1384. World J Gastrointest Oncol. 2024. PMID: 38660656 Free PMC article.
-
A New Online Dynamic Nomogram: Construction and Validation of a Predictive Model for Distant Metastasis Risk and Prognosis in Patients with Gastrointestinal Stromal Tumors.J Gastrointest Surg. 2023 Jul;27(7):1429-1444. doi: 10.1007/s11605-023-05706-9. Epub 2023 May 25. J Gastrointest Surg. 2023. PMID: 37231240 Review.
-
Individualized assessment of risk and overall survival in patients newly diagnosed with primary osseous spinal neoplasms with synchronous distant metastasis.Front Public Health. 2022 Aug 22;10:955427. doi: 10.3389/fpubh.2022.955427. eCollection 2022. Front Public Health. 2022. PMID: 36072380 Free PMC article.
-
Specific survival nomograms based on SEER database for small intestine adenocarcinoma.Ann Palliat Med. 2021 Jul;10(7):7440-7457. doi: 10.21037/apm-21-600. Epub 2021 Jul 14. Ann Palliat Med. 2021. PMID: 34263641 Clinical Trial.
-
Predictors of Distant Metastasis and Prognosis in Newly Diagnosed T1 Intrahepatic Cholangiocarcinoma.Biomed Res Int. 2023 Jan 17;2023:6638755. doi: 10.1155/2023/6638755. eCollection 2023. Biomed Res Int. 2023. PMID: 36704724 Free PMC article. Review.
Cited by
-
Risk factors, prognostic factors, and nomograms for distant metastasis in patients with diagnosed duodenal cancer: A population-based study.World J Gastrointest Oncol. 2024 Apr 15;16(4):1384-1420. doi: 10.4251/wjgo.v16.i4.1384. World J Gastrointest Oncol. 2024. PMID: 38660656 Free PMC article.
-
Radiomics analysis based on CT for predicting lymph node metastasis and prognosis in duodenal papillary carcinoma.Insights Imaging. 2024 Jun 20;15(1):155. doi: 10.1186/s13244-024-01732-6. Insights Imaging. 2024. PMID: 38900393 Free PMC article.
References
-
- North JH, Pack MS. Malignant tumors of the small intestine: a review of 144 cases. Am Surg. 2000;66:46‐51. - PubMed
-
- US National Cancer Institute . Surveillance Epidemiology and End Results (SEER) data base . https://seer.cancer.gov
Publication types
MeSH terms
LinkOut - more resources
Full Text Sources
Medical

