. 2023 Jun 28;89(6):e0026723.
doi: 10.1128/aem.00267-23. Epub 2023 May 31.

Mapping the Kitchen Microbiota in Five European Countries Reveals a Set of Core Bacteria across Countries, Kitchen Surfaces, and Cleaning Utensils

Affiliations

Mapping the Kitchen Microbiota in Five European Countries Reveals a Set of Core Bacteria across Countries, Kitchen Surfaces, and Cleaning Utensils

Birgitte Moen et al. Appl Environ Microbiol. .

Abstract

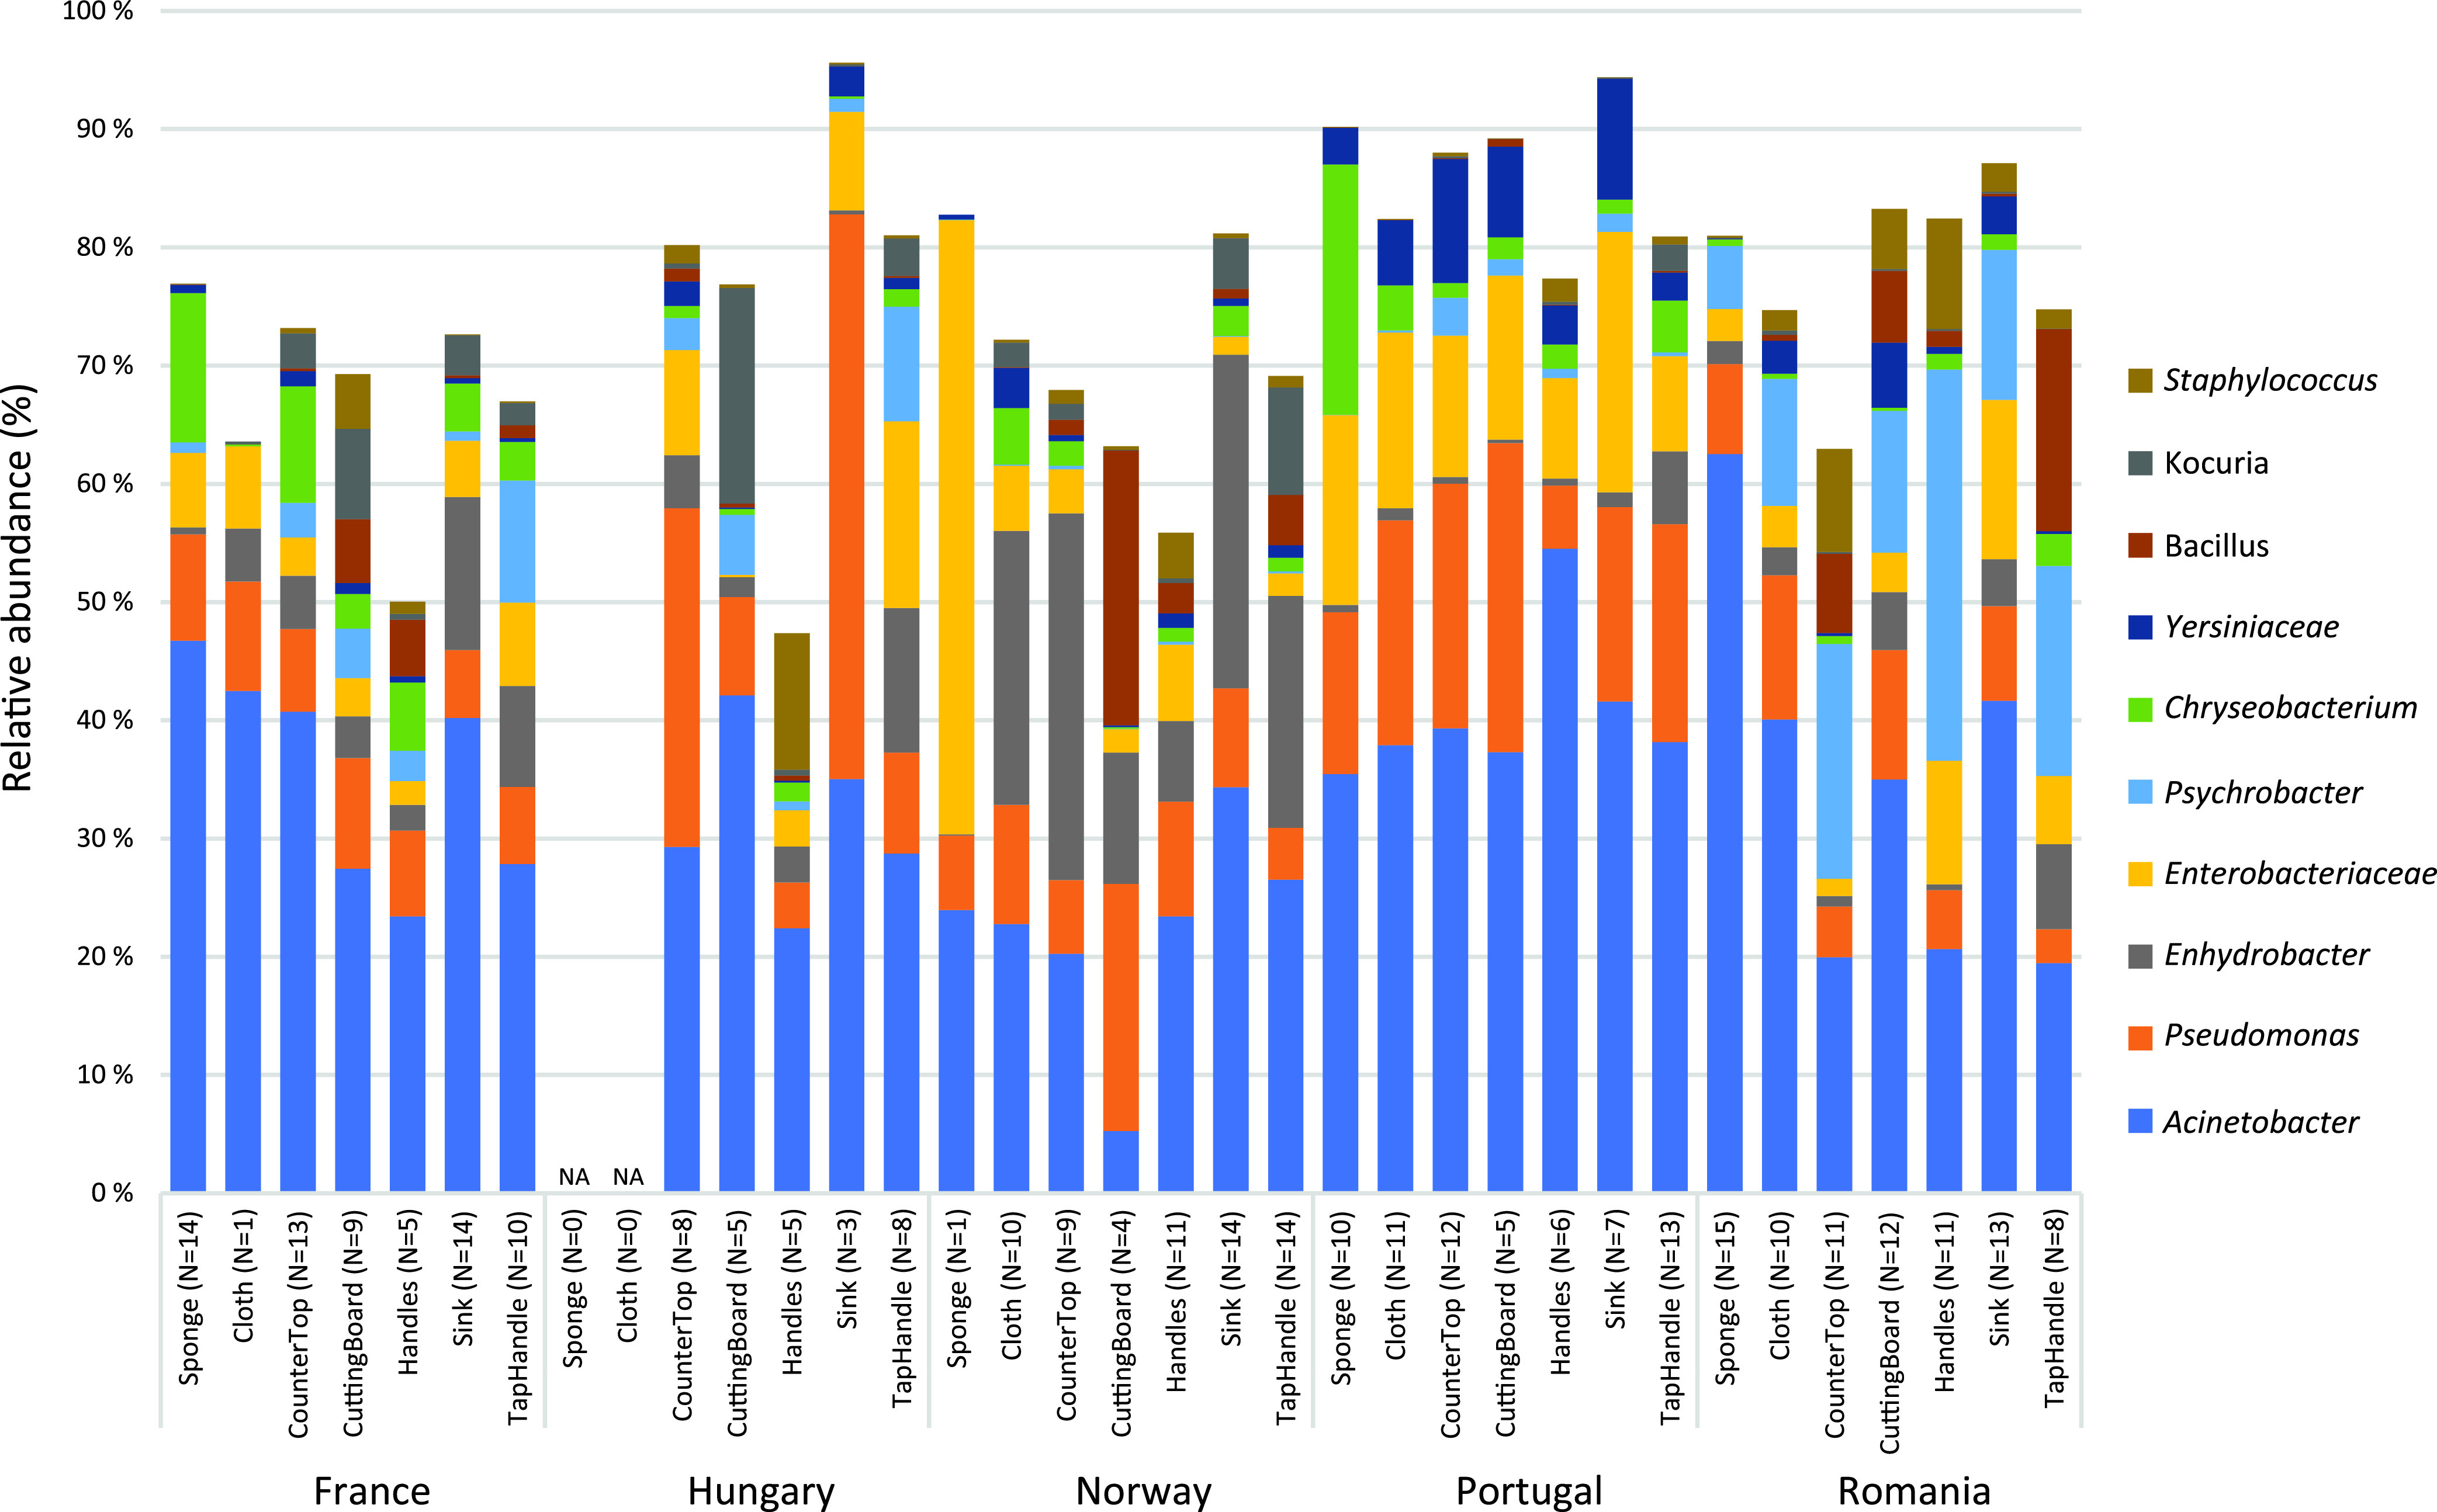
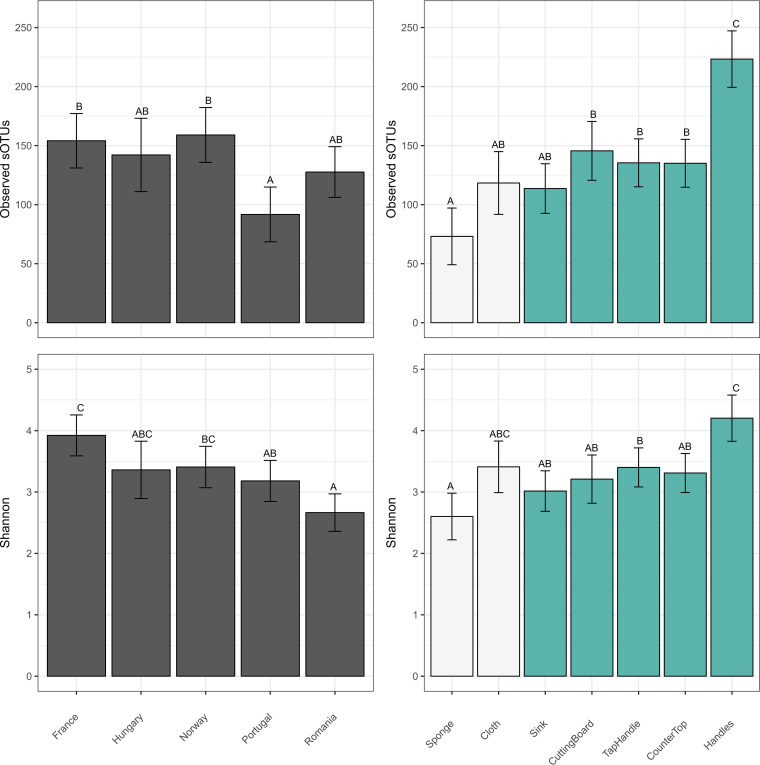
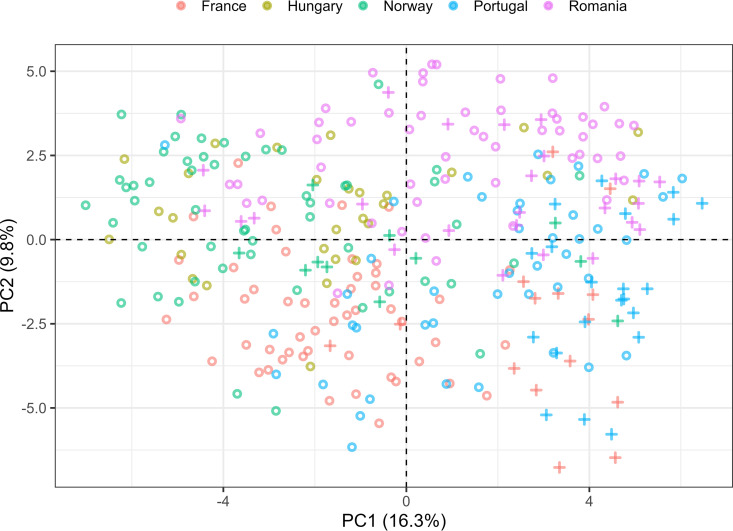
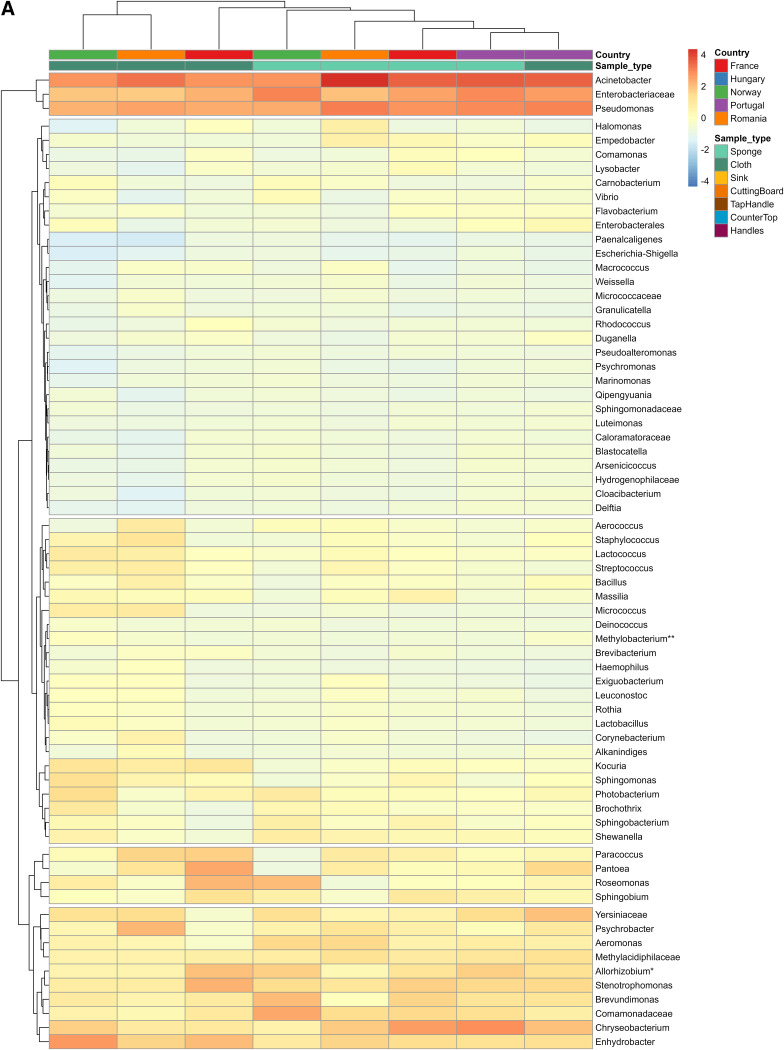
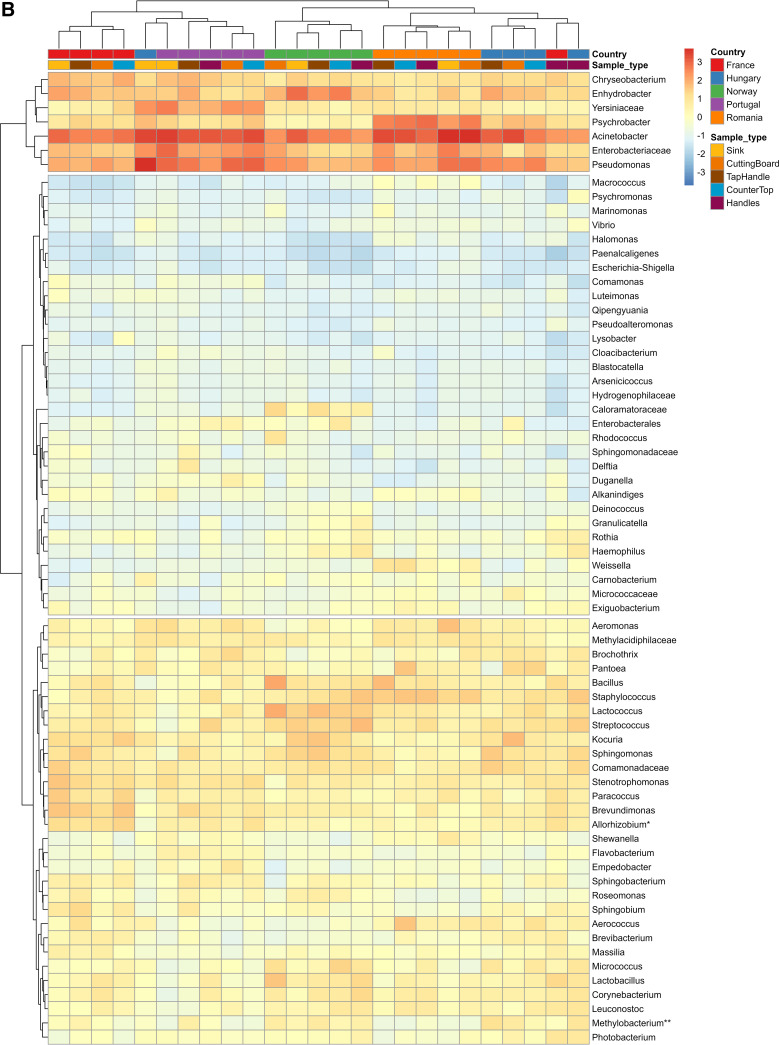
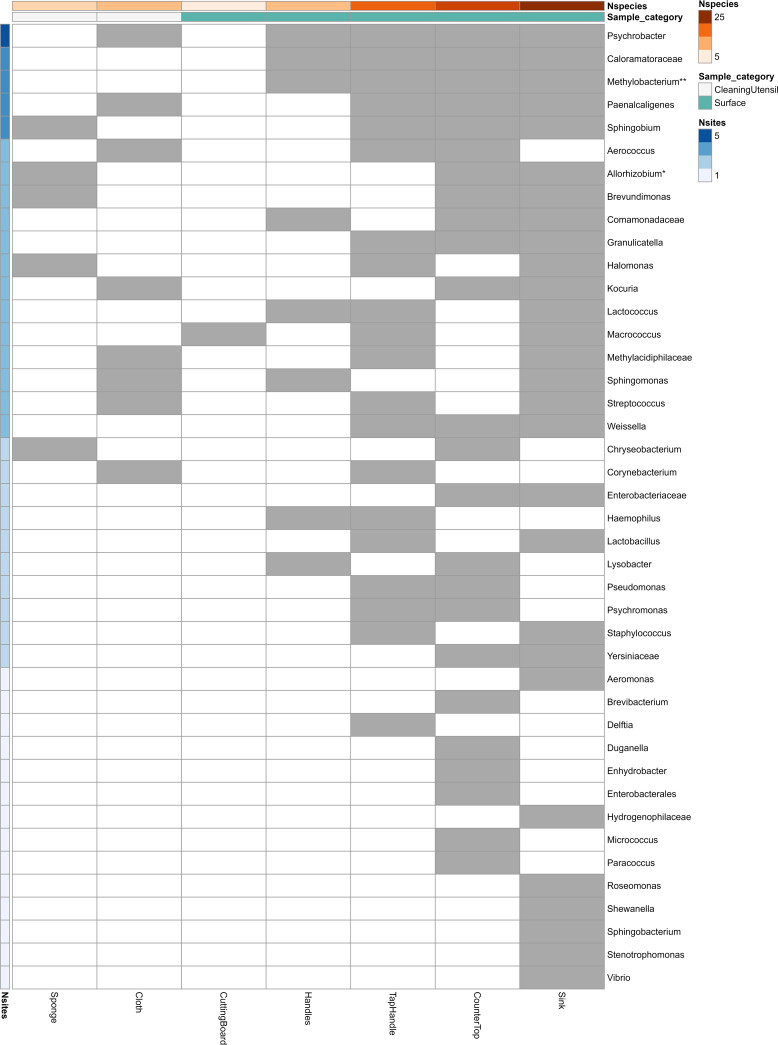
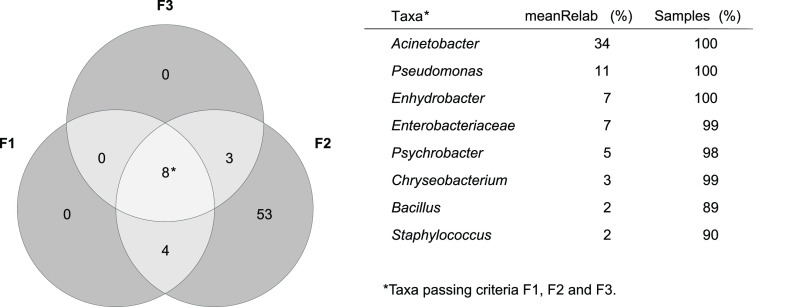
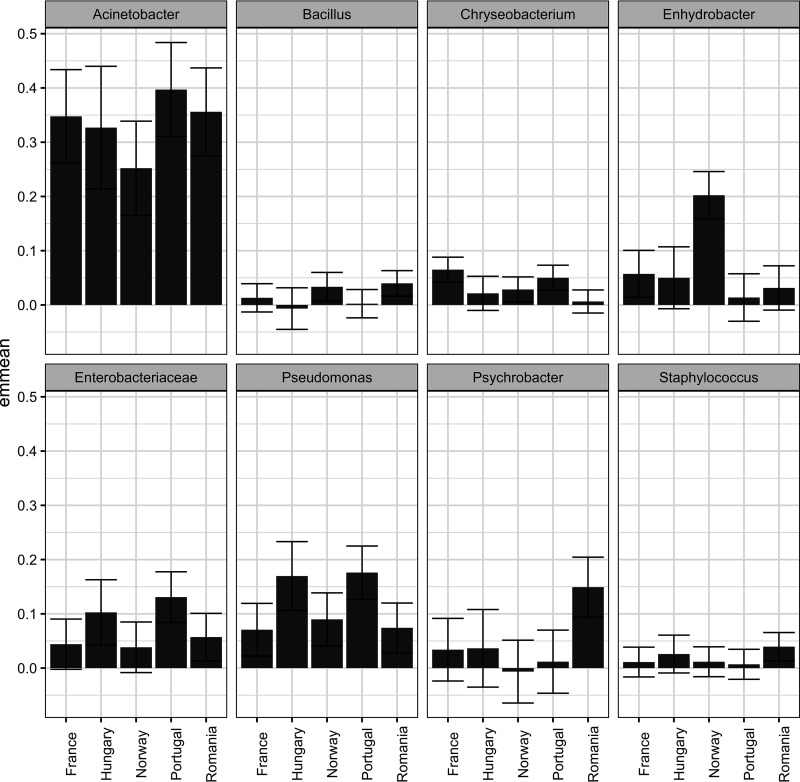
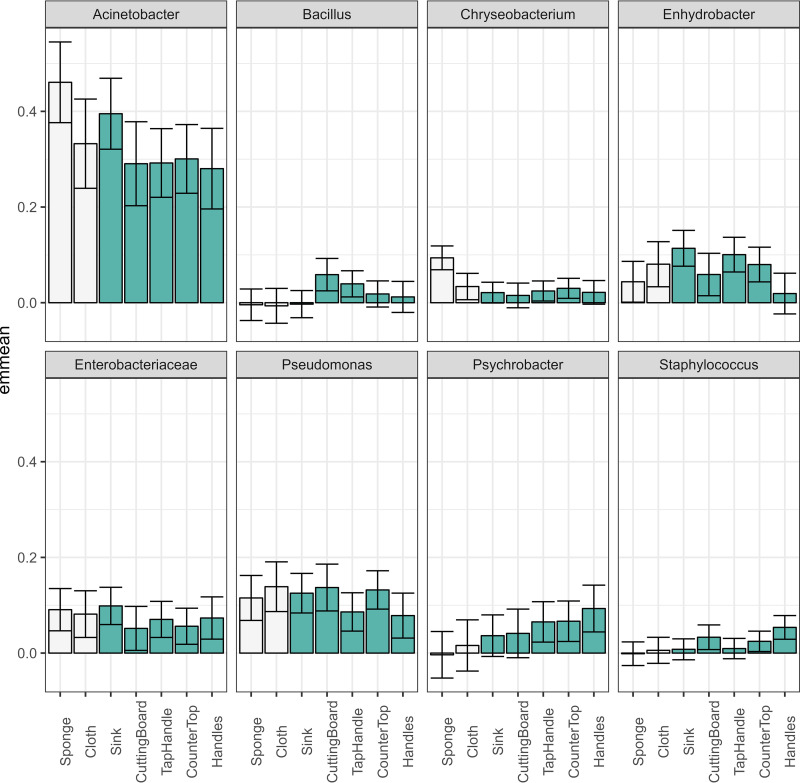
The residential kitchen is often heavily colonized by microbes originating from different sources, including food and human contact. Although a few studies have reported the bacterial composition in cleaning utensils and surface samples there is limited knowledge of the bacterial diversity across different sample types, households, and countries. As part of a large European study, we have identified the microbiota of 302 samples from cleaning utensils (sponges and cloths), kitchen surfaces (sinks, cutting boards, countertops, tap handles, and a pooled sample of other handles) in 74 households across 5 countries (France, Hungary, Norway, Portugal, and Romania). In total, 31 bacterial phyla were identified, with Proteobacteria, Firmicutes, Bacteroidota, and Actinobacteria being the most abundant. Despite large variations in households with respect to kitchen standards, kitchen practices, cleaning regimes, and diet and considerable differences in bacterial diversity between samples, eight bacterial genera/families commonly associated with environmental sources were identified in most samples and defined as a core microbiota: Acinetobacter, Pseudomonas, Enhydrobacter, Enterobacteriaceae, Psychrobacter, Chryseobacterium, Bacillus, and Staphylococcus. These genera/families were also among the bacteria with the highest relative abundance across all samples, in addition to Yersiniaceae, Kocuria, Pantoea, and Streptococcus. Taxa associated with potential pathogens and fecal indicators were low in abundance but broadly distributed throughout the households. The microbial composition of surface samples indicated that the microbial composition on kitchen surfaces is more characteristic for the particular country than the object type, while the microbiota of cleaning utensils was similar across countries but differed between types (sponge or cloth). IMPORTANCE There is limited knowledge of the characteristics, differences, and similarities of the bacterial composition in residential kitchens. Here, we report the microbiota of cleaning utensils (sponges and cloths) and five different surface samples in 74 households across five European countries. In addition to increasing the knowledge of the kitchen microbiota from many geographical areas, this study identified a core microbiota in European residential kitchens despite large variations in kitchen practices and kitchen design and standards across countries and households.

Keywords: 16S rRNA gene; Illumina; core microbiota; microbiome; sponges.


Conflict of interest statement

The authors declare no conflict of interest.

Figures

FIG 1
FIG 1
Relative abundance (%) of the 10 most abundant genera/families in the different sample types and countries. The values are based on the average of similar sample types within each country. The number of samples (N) representing each bar is written in parentheses after the sample type. There were no sponges or cloths from Hungary (marked NA in the figure).
FIG 2
FIG 2
Bacterial diversity (alpha diversity) measured by observed features (observed sOTUs) (top two panels) and Shannon diversity (bottom two panels). Alpha diversity is measured per country (left) and per sample type (right). The alpha diversity is presented as the estimated marginal means for observed features (observed sOTUs) and Shannon diversity. Different colors are used to contrast cleaning utensils (sponge and cloth) and surface samples. The error bars show the 95% confidence intervals. Different letters indicate statistically significant differences (P < 0.05).
FIG 3
FIG 3
Principal-component analysis (PCA) of L6 (genus level) data. The analysis was performed on CLR transformed data at the L6 level after filtering. The samples are colored based on country and symbols representing either cleaning utensils (crosses) or surface samples (circles).
FIG 4
FIG 4
(A and B) Heatmaps of the bacterial genera with average relative abundance higher than 1% or exceeding 5% in at least one sample (N 68 genera) for cleaning utensils (A) and surface samples (B). The heatmaps are based on the average of a sample type within a country. Allorhizobium*, Allorhizobium-Neorhizobium-Pararhizobium-Rhizobium; Methylobacterium**, Methylobacterium-Methylorubrum.
FIG 4
FIG 4
(A and B) Heatmaps of the bacterial genera with average relative abundance higher than 1% or exceeding 5% in at least one sample (N 68 genera) for cleaning utensils (A) and surface samples (B). The heatmaps are based on the average of a sample type within a country. Allorhizobium*, Allorhizobium-Neorhizobium-Pararhizobium-Rhizobium; Methylobacterium**, Methylobacterium-Methylorubrum.
FIG 5
FIG 5
Bacteria with significantly different relative abundance between countries for various sample types. Gray boxes indicate sample types/species for which there are significant (FDR-adjusted P value of <0.01) differences between countries. The number of sample types with significant differences between countries is indicated on the left side (Nsites), whereas the number of genera significant for each sample point (Nspecies) is indicated on the top together with the sample category.
FIG 6
FIG 6
Venn diagram of bacterial taxa and core microbiota of kitchens. The diagram is based on the L6 table and different criteria: F1, arithmetic mean abundance above a threshold of 1%; F2, MeanMax (arithmetic mean abundance above a threshold of 1% or an abundance above 5% in at least one sample); F3, occurrence (the taxa is present in at least one sample for all consumers). The core taxa are listed together with the meanRelab (mean relative abundance [%]) and samples (proportion [%] of samples where the taxa are present). The four taxa fulfilling criteria F1 and F2 (not F3) were Yersiniaceae, Kocuria, Pantoea, and Streptococcus, while the three taxa fulfilling criteria F2 and F3 (not F1) were Aeromonas, Comamonadaceae, and Allorhizobium-Neorhizobium-Pararhizobium-Rhizobium.
FIG 7
FIG 7
Estimated marginal means of the relative abundance for each of the taxa defined as core microbiota. The error bars represent the confidence interval (95%).
FIG 8
FIG 8
Estimated marginal means of the relative abundance for each of the taxa defined as core microbiota. The error bars represent the confidence interval (95%). White bars represent cleaning utensils and green bars for surface samples.

Similar articles

References

    1. Novak Babič M, Gostincar C, Gunde-Cimerman N. 2020. Microorganisms populating the water-related indoor biome. Appl Microbiol Biotechnol 104:6443–6462. doi:10.1007/s00253-020-10719-4. - DOI - PMC - PubMed
    1. Adams RI, Bateman AC, Bik HM, Meadow JF. 2015. Microbiota of the indoor environment: a meta-analysis. Microbiome 3:49. doi:10.1186/s40168-015-0108-3. - DOI - PMC - PubMed
    1. Rusin P, Orosz-Coughlin P, Gerba C. 1998. Reduction of faecal coliform, coliform and heterotrophic plate count bacteria in the household kitchen and bathroom by disinfection with hypochlorite cleaners. J Appl Microbiol 85:819–828. doi:10.1046/j.1365-2672.1998.00598.x. - DOI - PubMed
    1. Ojima M, Toshima Y, Koya E, Ara K, Kawai S, Ueda N. 2002. Bacterial contamination of Japanese households and related concern about sanitation. Int J Environ Health Res 12:41–52. doi:10.1080/09603120120110040. - DOI - PubMed
    1. Scott E, Bloomfield SF, Barlow CG. 1982. An investigation of microbial contamination in the home. J Hyg (Lond) 89:279–293. doi:10.1017/s0022172400070819. - DOI - PMC - PubMed

Publication types

Substances