. 2023 May 12;26(6):106864.
doi: 10.1016/j.isci.2023.106864. eCollection 2023 Jun 16.

ADAR1-mediated RNA editing promotes B cell lymphomagenesis

Affiliations

ADAR1-mediated RNA editing promotes B cell lymphomagenesis

Riccardo Pecori et al. iScience. .

Abstract

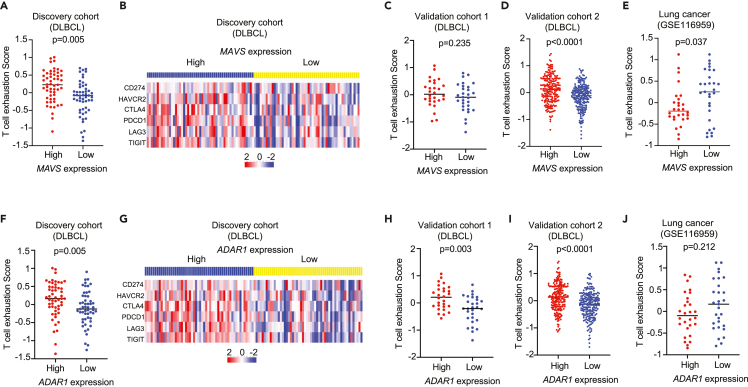
Diffuse large B cell lymphoma (DLBCL) is one of the most common types of aggressive lymphoid malignancies. Here, we explore the contribution of RNA editing to DLBCL pathogenesis. We observed that DNA mutations and RNA editing events are often mutually exclusive, suggesting that tumors can modulate pathway outcomes by altering sequences at either the genomic or the transcriptomic level. RNA editing targets transcripts within known disease-driving pathways such as apoptosis, p53 and NF-κB signaling, as well as the RIG-I-like pathway. In this context, we show that ADAR1-mediated editing within MAVS transcript positively correlates with MAVS protein expression levels, associating with increased interferon/NF-κB signaling and T cell exhaustion. Finally, using targeted RNA base editing tools to restore editing within MAVS 3'UTR in ADAR1-deficient cells, we demonstrate that editing is likely to be causal to an increase in downstream signaling in the absence of activation by canonical nucleic acid receptor sensing.

Keywords: Epigenetics; Genetics; Molecular biology; Omics; Transcriptomics.


Conflict of interest statement

The authors declare no competing interests.

Figures

None
Graphical abstract
Figure 1
Figure 1
Robust ADAR1 catalyzed RNA editing in DLBCL (A) ADAR1 expression levels in a cohort of 106 DLBCL patients suggests that ADAR1 is the main adenosine deaminase active in these tumors. (B) Within tumors, increased ADAR1 expression is correlated with the number of editing sites identified from RED-ML (p<0.0001). (C and D) RNA editing in DLBCL shows features consistent with ADAR1 activity: most A-to-I editing involves Alu repeats within non-coding regions (intronic or 3′UTR) within specific sequence features. (E) Within tumors, increased ADAR1 expression is correlated with increased AEI (p<0.0001). (F) The comparison of AEI in DLBCL, FL and control B cells. (G) An increase in p110 in DLBCL (and concomitant decrease of p150) versus FL or control B cells, leads to an increased ADAR1 p110/p150 ratio that is characteristic of DLBCL. For panels B and E, Pearson correlation coefficient was used for r and p values. For panels F and G, p values were calculated using Mann-Whitney U test.
Figure 2
Figure 2
The landscape of RNA editing versus DNA mutation in DLBCL (A) KEGG pathway enrichment of genes affected by unique RNA editing sites identified in DLBCL but absent in control B cells. Only the editing sites identified in functional regions were considered in the analysis, and the editing sites identified in more than 10% of DLBCL but absent in control B cells. (B–D) RNA editing versus DNA mutation. Genes that belong to the Apoptosis/p53 pathway (B), the RIG-I like Receptor (RLR) pathway (which usually culminates in interferon signaling in response to viral infection) (C) and the NF-κB signaling pathway (of key relevance to lymphoma progression) (D) are shown in the figure. These pathways can be perturbed either by editing (right) or by mutation (left). For example, TP53 is mutated in ∼30% of the patients (red bars), but ATM is edited in almost all patients, as is MDM4 (a regulator of p53 activity). Each column represents a patient, and each row a gene. The p value in panel A was calculated using Fisher’s exact test. Genes mentioned in the results session are highlighted by a red star (∗).
Figure 3
Figure 3
ADAR1 editing of MAVS is correlated with increased MAVS protein levels and increased downstream signaling (A) Correlation between MAVS editing and MAVS expression (p<0.0001, Pearson correlation coefficients). (B) Proteomic data for n = 14 samples (corresponding tumors are marked in red in 3A) show a correlation between MAVS and ADAR1 protein levels (p = 0.0036, Pearson correlation coefficients). (C) MAVS expression and correlation with ISG (in red)/NF-κB (in blue) scores (p values are p = 0.0004 for ISG and p<0.0001 for NF-κB respectively). (D) MAVS protein expression and correlation with ISG (in red)/NF-κB (in blue) scores in the protein level (p values are p<0.0001 for both ISG and NF-κB). (E and F) MAVS expression and correlation with ISG (in red)/NF-κB (in blue) scores in two different and independent DLBCL validation cohorts. validation cohort 1 (n = 54), a Swedish DLBCL cohort. validation cohort 2 (n = 420), GSE10846. (G) MAVS expression and correlation with ISG (in red)/NF-κB (in blue) scores in a third independent FL validation cohort (n = 20, p values are p = 0.002 for ISG and p<0.001 for NF-κB respectively). (H) MAVS expression and correlation with ISG (in red)/NF-κB (in blue) scores in lung adenocarcinoma (p values are p = 0.083 for ISG and p = 0.086 for NF-κB respectively). Pearson correlation coefficient was used for r and p values.
Figure 4
Figure 4
Base editor dependent re-targeting of the MAVS 3′UTR modulates the inflammatory output of the NF-κB and type-I IFN signaling cascades (A) Cartoon of the SNAP-ADAR1 targeted editing system used to induce RNA editing within MAVS 3′UTR. RC-K8 KO (clone 18) was transduced to express SA1Q-GFP stably. This cell line was then nucleofected with two chemically stabilized bisbenzylguanine(BB)-modified guide RNAs (BB-gRNAs or gMAVSs) or without BB group (NH-gRNAs or gCTRLs). 24h later, RNA and protein were extracted, and RT-PCR on MAVS, RNA-seq, and mass spectrometry analysis were performed. (B) The bar plot represents the editing index calculated for the 3′UTR of MAVS in the presence of gMAVSs or gCTRLs. (C) Editing frequency per position along the 3′UTR of MAVS. The bars indicate the frequency of editing in each position in the presence of gMAVSs or gCTRLs. The coverage per position is shown by overlapping dot plots. (D) Barplot representing the 100 genes with the highest number of significantly edited editing sites within their transcripts in gMAVS samples in comparison to gCTRL samples. ISGs and NF-κB genes are labeled in red and green, respectively. (E and F) A comparison of ISG and NF-κB scores between ADAR1 WT and KO RC-K8 cells (F) A comparison of ISG and NF-κB scores between ADAR1 KO RC-K8 cells in which MAVS editing is restored (gMAVS) and the relevant controls (gCTRL), indicates increased signaling on MAVS editing restoration. (G) MAVS protein quantification via mass spectrometry in the same samples. n = number of independent biological replicates. For panels B, C and G, data are represented as mean ± SD.
Figure 5
Figure 5
MAVS/ADAR1 expression within DLBCL tumor cells is a biomarker for T cell exhaustion within a relatively uninflamed TME The expression of 6 genes was used to measure the T cell exhaustion in tumors by using RNA-seq data. (A–E) The analysis of T cell exhaustion in patients with MAVS high (top 50%) and low (bottom 50%) expression in different cohorts, including DLBCL discovery cohort (n = 106, A-B), DLBCL validation cohort 1 (n = 54, Swedish DLBCL cohort, C), validation cohort 2 (n = 420, GSE10846, D), as well as lung cancer cohort (n = 57, GSE116959, E). (F–J) The analysis of T cell exhaustion in patients with ADAR1 high (top 50%) and low (bottom 50%) expression in different cohorts, including DLBCL discovery cohort (F-G), DLBCL validation cohort 1 (n = 54, Swedish DLBCL cohort, H), validation cohort 2 (n = 420, GSE10846, I), as well as lung cancer cohort (n = 57, GSE116959, J). B and G is a heatmap showing the expression of 6 genes used to calculate T cell exhaustion scores in the respective groups. For panels A, C-F, and H-J, bars indicated the mean of each group and p values were calculated by the Mann-Whitney U test.

References

    1. Ye X., Ren W., Liu D., Li X., Li W., Wang X., Meng F.-L., Yeap L.-S., Hou Y., Zhu S., et al. Genome-wide mutational signatures revealed distinct developmental paths for human B cell lymphomas. J. Exp. Med. 2021;218:e20200573. doi: 10.1084/jem.20200573. - DOI - PMC - PubMed
    1. Alizadeh A.A., Eisen M.B., Davis R.E., Ma C., Lossos I.S., Rosenwald A., Boldrick J.C., Sabet H., Tran T., Yu X., et al. Distinct types of diffuse large B-cell lymphoma identified by gene expression profiling. Nature. 2000;403:503–511. doi: 10.1038/35000501. - DOI - PubMed
    1. Rosenquist R., Beà S., Du M.Q., Nadel B., Pan-Hammarström Q. Genetic landscape and deregulated pathways in B-cell lymphoid malignancies. J. Intern. Med. 2017;282:371–394. doi: 10.1111/joim.12633. - DOI - PubMed
    1. Reddy A., Zhang J., Davis N.S., Moffitt A.B., Love C.L., Waldrop A., Leppa S., Pasanen A., Meriranta L., Karjalainen-Lindsberg M.L., et al. Genetic and functional drivers of diffuse large B cell lymphoma. Cell. 2017;171:481–494.e15. doi: 10.1016/j.cell.2017.09.027. - DOI - PMC - PubMed
    1. Schmitz R., Wright G.W., Huang D.W., Johnson C.A., Phelan J.D., Wang J.Q., Roulland S., Kasbekar M., Young R.M., Shaffer A.L., et al. Genetics and pathogenesis of diffuse large B-Cell lymphoma. N. Engl. J. Med. 2018;378:1396–1407. doi: 10.1056/NEJMoa1801445. - DOI - PMC - PubMed