Review
. 2023 May 10:59:101996.
doi: 10.1016/j.eclinm.2023.101996. eCollection 2023 May.

Reducing alcohol use through alcohol control policies in the general population and population subgroups: a systematic review and meta-analysis

Affiliations
Review

Reducing alcohol use through alcohol control policies in the general population and population subgroups: a systematic review and meta-analysis

Carolin Kilian et al. EClinicalMedicine. .

Abstract

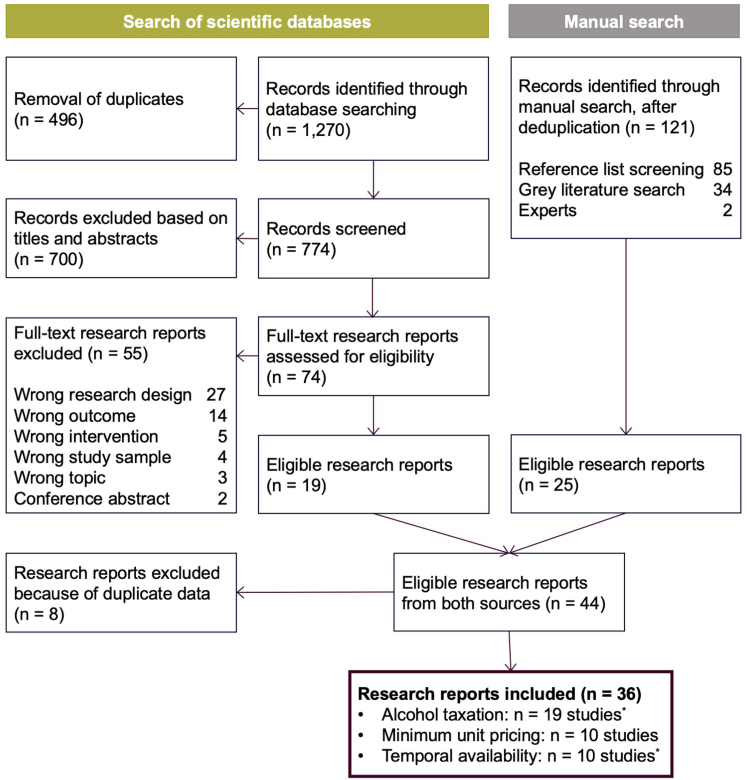
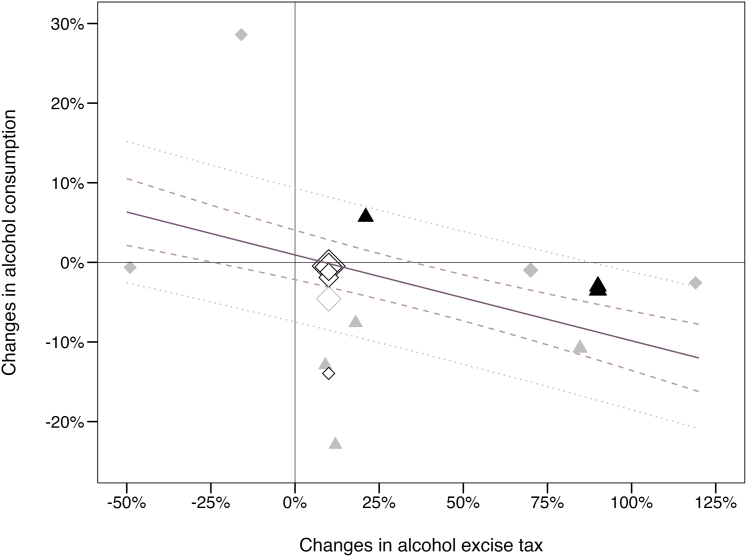
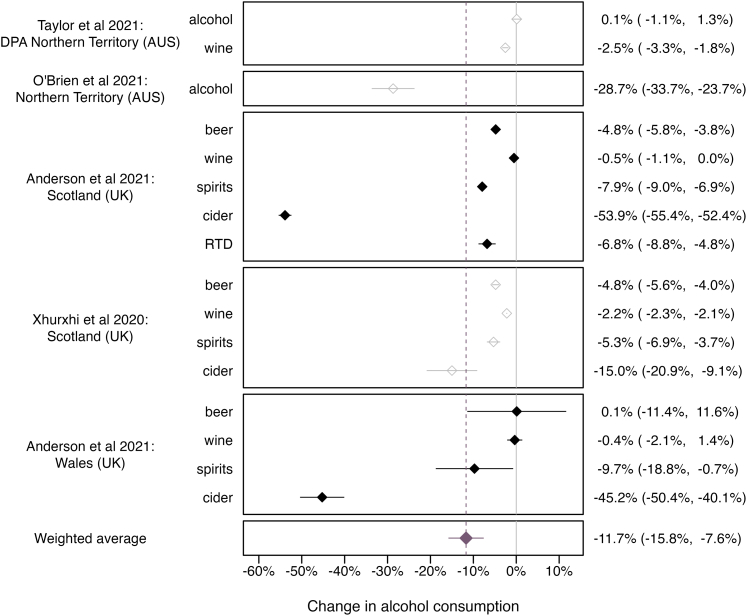
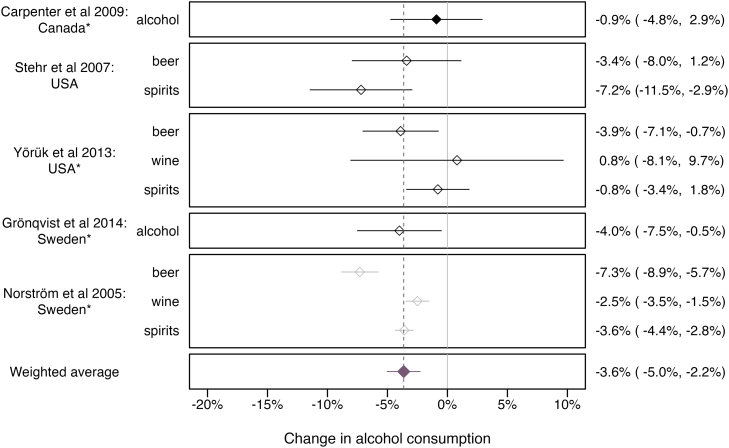
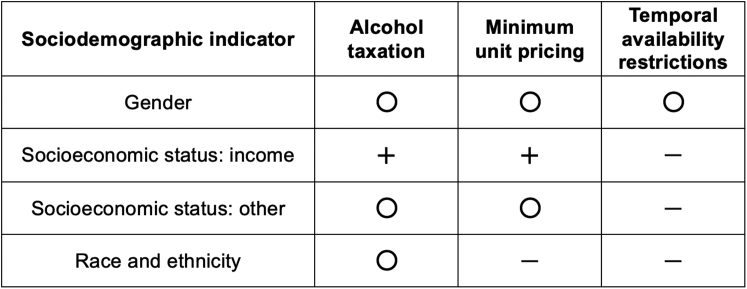
We estimate the effects of alcohol taxation, minimum unit pricing (MUP), and restricted temporal availability on overall alcohol consumption and review their differential impact across sociodemographic groups. Web of Science, Medline, PsycInfo, Embase, and EconLit were searched on 08/12/2022 and 09/26/2022 for studies on newly introduced or changed alcohol policies published between 2000 and 2022 (Prospero registration: CRD42022339791). We combined data using random-effects meta-analyses. Risk of bias was assessed using the Newcastle-Ottawa Scale. Of 1887 reports, 36 were eligible. Doubling alcohol taxes or introducing MUP (Int$ 0.90/10 g of pure alcohol) reduced consumption by 10% (for taxation: 95% prediction intervals [PI]: -18.5%, -1.2%; for MUP: 95% PI: -28.2%, 5.8%), restricting alcohol sales by one day a week reduced consumption by 3.6% (95% PI: -7.2%, -0.1%). Substantial between-study heterogeneity contributes to high levels of uncertainty and must be considered in interpretation. Pricing policies resulted in greater consumption changes among low-income alcohol users, while results were inconclusive for other socioeconomic indicators, gender, and racial and ethnic groups. Research is needed on the differential impact of alcohol policies, particularly for groups bearing a disproportionate alcohol-attributable health burden.

Funding: Research reported in this publication was supported by the National Institute on Alcohol Abuse and Alcoholism of the National Institutes of Health under Award Number R01AA028009.

Keywords: Alcohol consumption; Alcohol policy; Effectiveness; Ethnicity; Race; Socioeconomic status.


Conflict of interest statement

Dr. Kerr has received funding and travel support from the National Alcoholic Beverage Control Association (NABCA). Dr. Kerr has been paid as an expert witness regarding cases on alcohol policy issues retained by the Attorney General's Offices of the US states of Indiana and Illinois under arrangements where half of the cost was paid by organizations representing wine and spirits distributors in those states. JML has received a PhD stipend from the German Academic Scholarship Foundation. AL has received Early Postdoc Mobility funding (number P2LAP3 191273) from the Swiss National Science Foundation. All other authors have no conflicts to declare.

Figures

Fig. 1
Fig. 1
Flowchart of study selection. Note: List of excluded full-text articles is available in the appendix p. 12. Numbers do not add up, as three studies reported results on both the impact of alcohol taxation and temporal availability policies.
Fig. 2
Fig. 2
Effect of alcohol excise taxes on the level of alcohol consumption based on the identified literature (n = 10). Notes: 1. One study may have provided multiple point estimates, for example, for different alcoholic beverages. 2. Solid shapes indicate the focus of the interventional study: tax reform specific to certain alcoholic beverages (diamond) and a more complex tax reform affecting different alcoholic beverages to varying degrees (triangle). 3. Empty shapes indicate studies reporting tax elasticities. 4. Grey colors indicate studies with a critical risk of bias. 5. The size of the shape indicates the inverse variance weight of each point estimate. 6. The solid regression line depicts the association between alcohol excise taxes and consumption based on the random-effects meta-regression model. The dashed lines illustrate the 95% confidence interval and the dotted grey lines the 95% prediction interval. 7. Where multiple point estimates (k ≥ 2) on the consumption change were available, point estimates were pooled using fixed-effects meta-analysis (applied to one study28).
Fig. 3
Fig. 3
Effect of introducing a minimum unit price on the level of alcohol consumption within one year of policy implementation. 95% prediction interval of weighted average: 95% PI: −28.2%, 5.8%. Notes: 1. Solid and empty shapes indicate individual-level and aggregated alcohol consumption data, respectively. 2. Grey colors indicate studies with a critical risk of bias. 3. DPA = Darwin/Palmerston area is a subregion of the Northern Territory. The point estimates from the Darwin/Palmerston area were preferred over that of the Northern Territory, as another policy were implemented shortly before the introduction of MUPs in different areas throughout the Northern Territory (Police Adjunct Licensing Inspectors, PALI: stationing of police officers in front of off-trade alcohol stores). The introduction of PALIs may have amplified the MUP effect in the Northern Territory. 4. “Alcohol” in Taylor et al., 2021 refers to the consumption of alcoholic beverages other than wine. 5. The effect estimate for ready-to-drink (RTD) beverages in Wales (Anderson et al. 202150) could not be included in the model as the effect and standard error was zero. 6. Where multiple point estimates (k ≥ 2) on the consumption change were available, point estimates were pooled using fixed-effects meta-analysis (applied to one study47). 7. Inverse variance weighting: larger confidence interval signifies smaller weighting of a point estimate.
Fig. 4
Fig. 4
Effect of banning alcohol sales on one additional day on alcohol consumption. 95% prediction interval of weighted average: 95% PI: −7.2%, −0.1%. 1. Solid and empty shapes indicate individual-level and aggregated alcohol consumption data, respectively. 2. Grey colors indicate studies with a critical risk of bias. 3. Asterisks (∗) indicate studies that examined the impact of permitting alcohol sales on one additional day a week; observed consumption changes were inverted. 4. USA = United States of America. 5. Inverse variance weighting; larger confidence interval signifies smaller weighting of a point estimate.
Fig. 5
Fig. 5
Summary of existing evidence on the impact of alcohol control policies conditional on gender, socioeconomic status, and race and ethnicity. ‘+’ evidence for conditional effectiveness, ‘〇’ mixed or inconclusive evidence for conditional effectiveness, ‘–’ no evidence available.

References

    1. Shield K.D., Manthey J., Rylett M., et al. National, regional, and global burdens of disease from 2000 to 2016 attributable to alcohol use: a comparative risk assessment study. Lancet Public Health. 2020;5:e51–e61. - PubMed
    1. Probst C., Könen M., Rehm J., Sudharsanan N. Alcohol-attributable deaths help drive growing socioeconomic inequalities in US life expectancy, 2000–18. Health Aff. 2022;41:1160–1168. - PMC - PubMed
    1. United Nations Statistics Division (UNSD) SDG indicators: global indicator framework for the sustainable development goals and targets of the 2030 agenda for sustainable development. 2019. https://unstats.un.org/sdgs/indicators/indicators-list/
    1. Sperkova K., Anderson P., Llopis E.J. Alcohol policy measures are an ignored catalyst for achievement of the sustainable development goals. PLoS One. 2022;17 - PMC - PubMed
    1. World Health Organization The SAFER initiative: a world free from alcohol related harm. 2022. https://www.who.int/initiatives/SAFER

LinkOut - more resources