. 2023 Jul:152:106306.
doi: 10.1016/j.jbankfin.2021.106306. Epub 2021 Sep 8.

Compounding COVID-19 and climate risks: The interplay of banks' lending and government's policy in the shock recovery

Affiliations

Compounding COVID-19 and climate risks: The interplay of banks' lending and government's policy in the shock recovery

Nepomuk Dunz et al. J Bank Financ. 2023 Jul.

Abstract

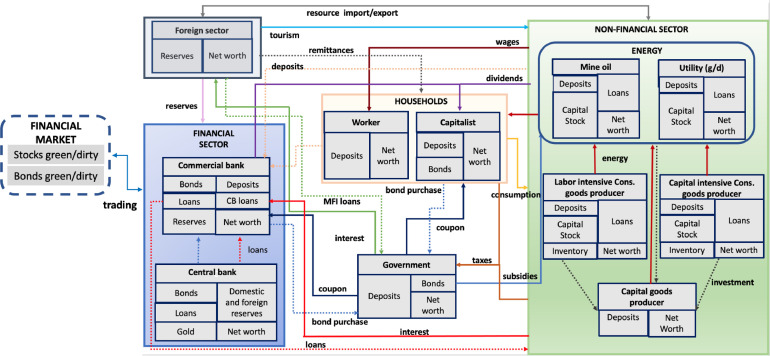
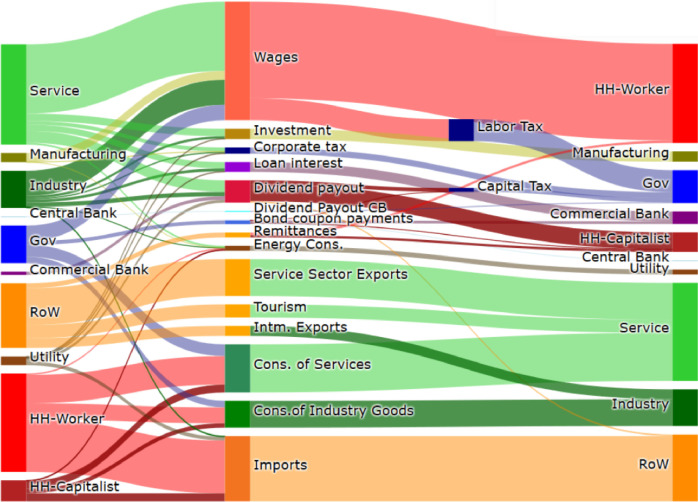
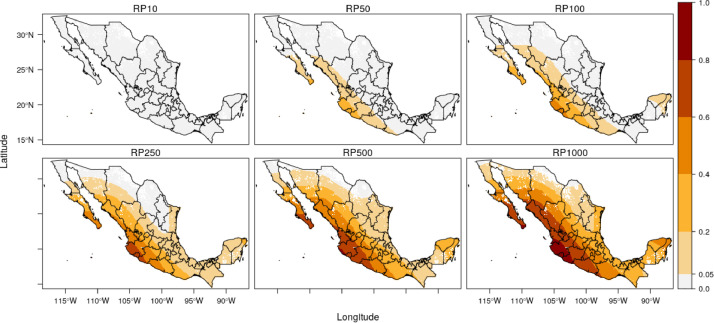
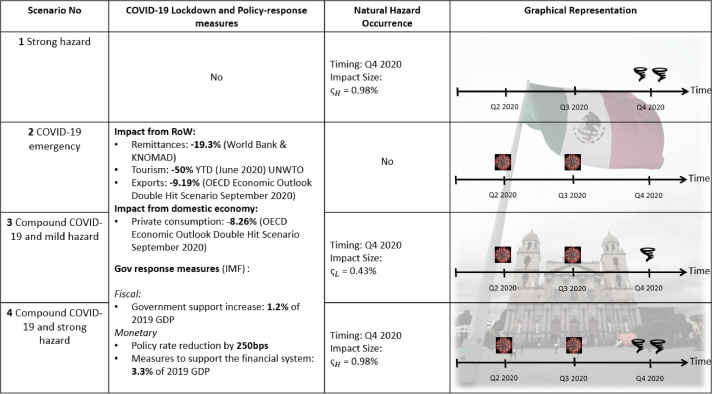
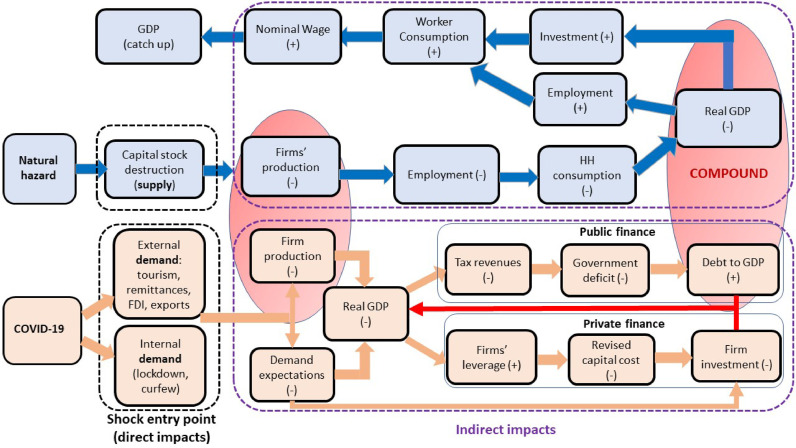
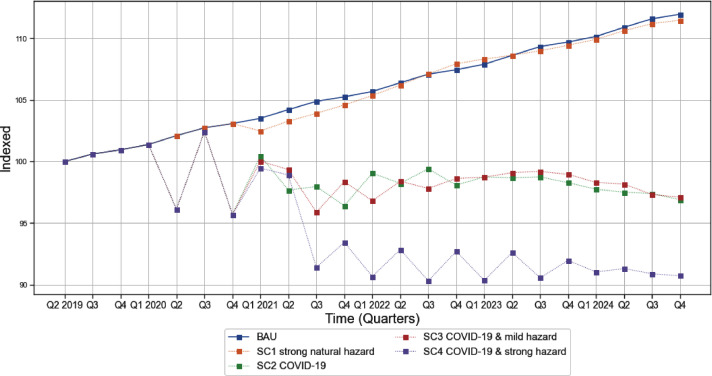
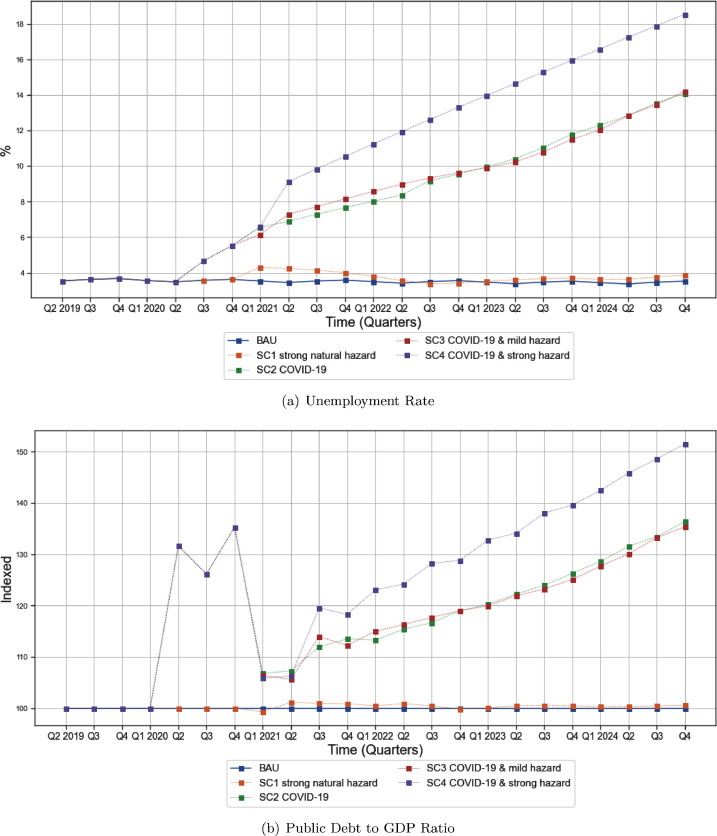
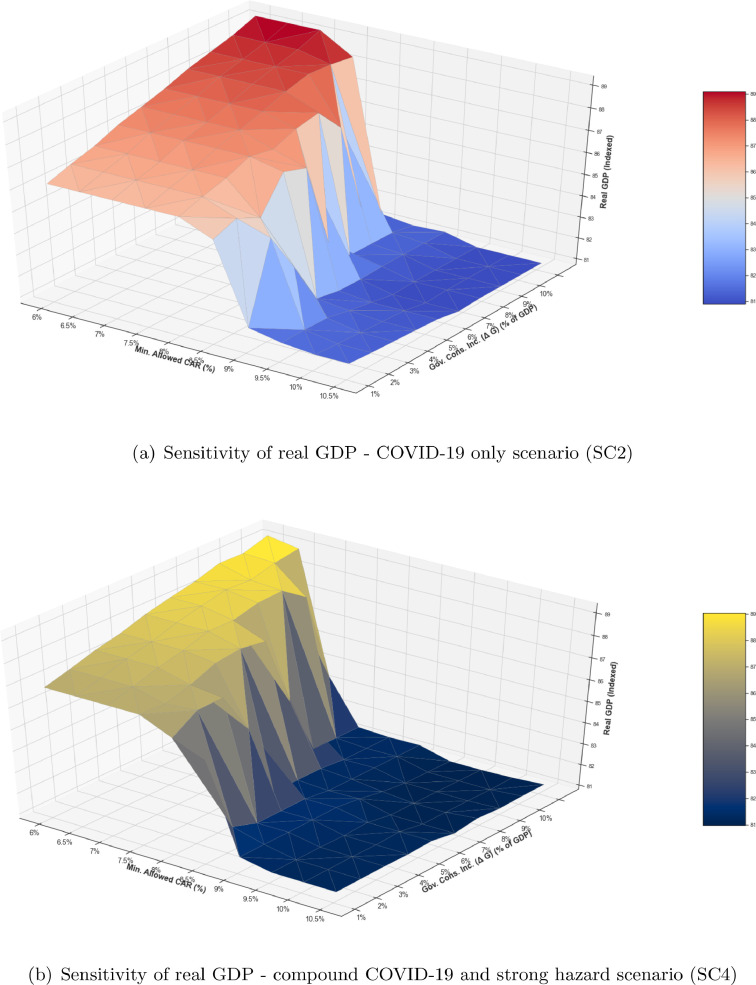
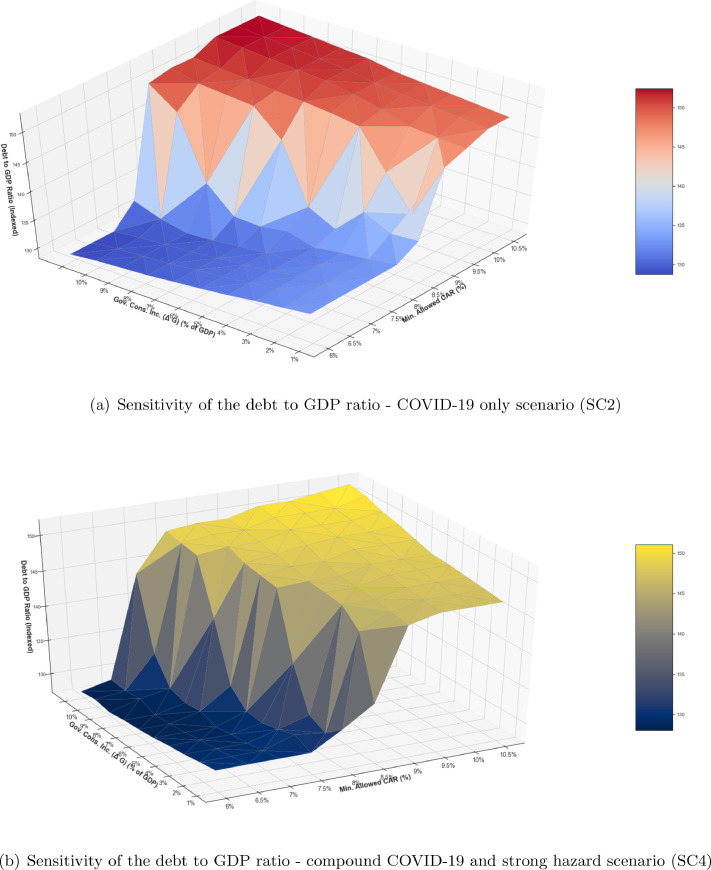
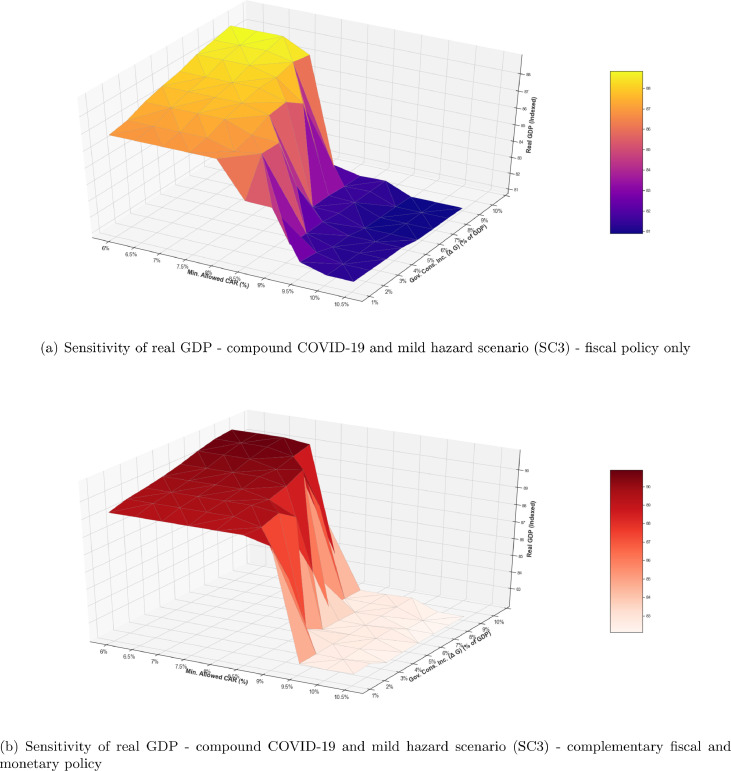
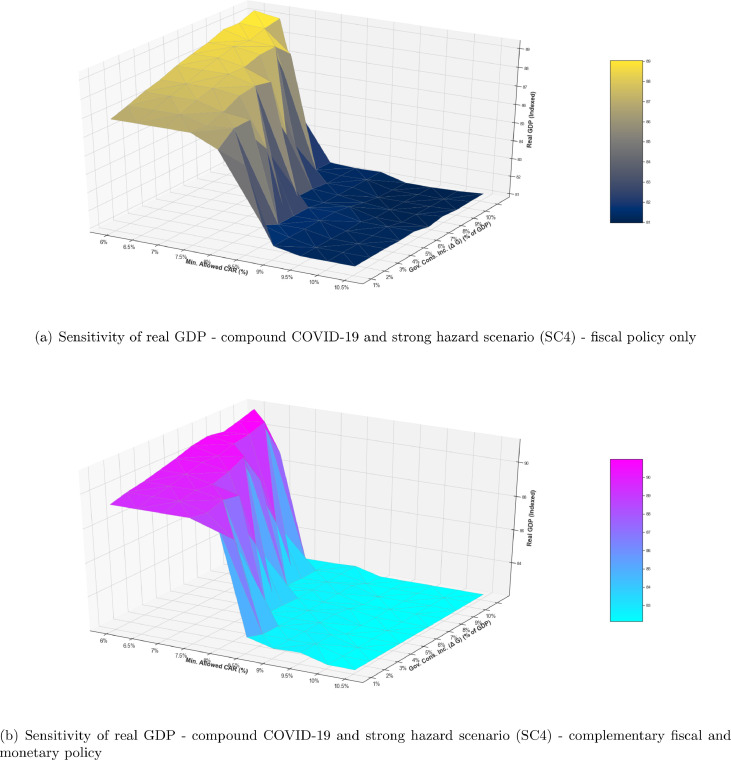
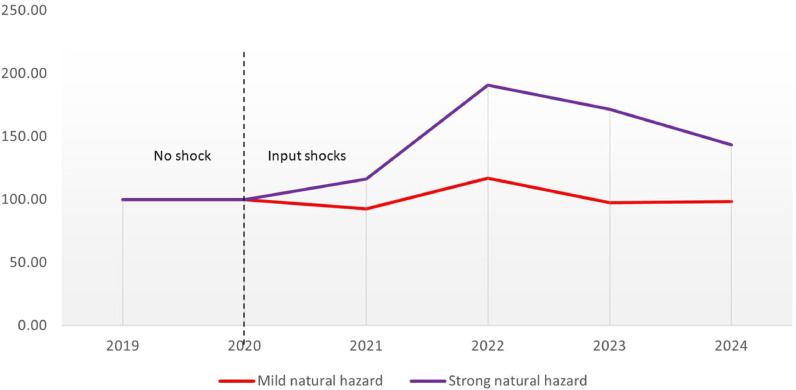
We assess the individual and compounding impacts of COVID-19 and climate physical risks in the economy and finance, using the EIRIN Stock-Flow Consistent model. We study the interplay between banks' lending decisions and government's policy effectiveness in the economic recovery process. We calibrate EIRIN on Mexico, being a country highly exposed to COVID-19 and hurricanes risks. By embedding financial actors and the credit market, and by endogenising investors' expectations, EIRIN analyses the finance-economy feedbacks, providing an accurate assessment of risks and policy co-benefits. We quantify the impacts of compounding COVID-19 and hurricanes on GDP through time using a compound risk indicator. We find that procyclical lending and credit market constraints amplify the initial shocks by limiting firms' recovery investments, thus mining the effectiveness of higher government spending. When COVID-19 and hurricanes compound, non-linear dynamics that amplify losses emerge, negatively affecting the economic recovery, banks' financial stability and public debt sustainability.

Keywords: COVID-19; Climate change; Compound risk; Credit market constraints; Government policies; Macrofinancial impacts; Procyclical bank lending; Stock-flow consistent model.


Figures

Fig. 2.1
Fig. 2.1
The EIRIN model framework: capital and current account flows of the EIRIN economy. For each sector and agent, a representation in terms of assets and liabilities is provided. The dotted lines represent the capital account flows, while the solid lines represent the current account flows. The model is composed of five sectors i.e. the non-financial sector, the financial sector, households, the government and the foreign sector. The non-financial sector is composed of (i) an energy firm that supplies energy to households and to firms as an input factor for production (red solid line); (ii) capital intensive (e.g. industry) and a labour intensive (e.g. service, tourism, agriculture) consumption goods producers that provide households heterogeneous consumption goods (yellow solid line). The energy firm and the consumption goods producers require capital as an input factor for production. To build-up their capital stock, they invest in capital goods (grey dotted line), which are produced by the capital goods producer. To finance investment expenditures, firms can borrow from the commercial bank (red dotted line), which applies an interest rate to their loans (red solid line). Households, firms and the government have deposits in the commercial bank (pink dotted line). The commercial bank also holds reserves at the central bank (blue dotted line) that could provide refinancing lines (red dotted line). The government sector pays public employees. In case of COVID-19 and of climate shocks, the government provides emergency relief to households, purchases consumption goods and grants investment subsidies to firms (blue solid line). The government collects tax revenues from households and firms (brown solid line) and finances its current spending by issuing sovereign bonds (dark blue dotted line). Sovereign bonds are bought by capitalist household, by the commercial bank and by the central bank. Furthermore, the government may receive loans from Monetary Financial Institutions (MFI, green dotted line). The government pays coupons (dark blue solid line) and interest (green solid line) respectively to the sovereign bonds and MFI loans (if applicable). Households are divided into workers and capitalists, based on their functional source of income. Workers receive wage income (wine-coloured solid line). Capitalists own domestic firms for which they receive dividend income (purple solid line) and coupon payments for their sovereign bond holdings (dark blue solid line). The foreign sector provides remittances (grey dotted line) and consumption goods to households (dark grey solid line), and resources to firms as inputs for the production factors (black solid line). The foreign sector also generates tourism flows and spending in the country (grey solid line), exports of service sector and industry goods (dark green solid line) and provides financial support to the government via MFI (green dotted line). Finally, it provides reserves to the domestic central bank (light purple solid line). (For interpretation of the references to colour in this figure legend, the reader is referred to the web version of this article.)
Fig. 3.1
Fig. 3.1
Sankey plot of the EIRIN economy: The Sankey plot represents all current account outflows and inflows of EIRINs agents and sectors at the beginning of the policy simulation. Left and right side of the figure include the main agents and sectors of EIRIN tailored to the Mexican economy. The central part of the figure represents the use of the monetary flows. How to read the Sankey plot: moving from the left to the right side we capture, respectively, the outflows to the use and the inflows from the use to the agents and sectors. Unit of measurement: $ US Dollars.
Fig. 4.1
Fig. 4.1
Damage index factor, Findex, computed for six different hurricanes return periods in Mexico based on UNEP-GRDP data (Cardona, Bernal, Ordaz, Salgado-Gálvez, Singh, Mora, Villegas, 2015, UNISDR).
Fig. 4.2
Fig. 4.2
Compound COVID-19 and climate risk scenarios: Affected sectors by COVID-19 and hurricanes occurrence and respective shock sizes.
Fig. 5.1
Fig. 5.1
Individual and compound risk transmission channels. The figure shows the COVID-19 and hurricanes entry points (black dotted boxes) and transmission channels to the main variables of the real economy, public and private finance. Direct impacts correspond to the input shocks considered and are identified by the black dotted boxes. In contrast, indirect impacts are identified by the purple dotted box. The red arrow shows the reinforcing economy-finance feedback loop, while the shaded red areas identify the compound effect. The signs (+/) indicates the direction of the impact (+: variables move in the same direction; : variables move in opposite directions, i.e. an increase in A leads to a decrease in B). The COVID-19 shock affects domestic and international demand (export, tourism, remittances), while the hurricane affects supply by hitting firms’ production. The shocks are transmitted in the economy via real and financial flows. (For interpretation of the references to colour in this figure legend, the reader is referred to the web version of this article.)
Fig. 5.2
Fig. 5.2
Real GDP (5 years time span). The x-axis shows the timeline of the simulation lasting until the fourth quarter of 2024 on a quarterly basis. The y-axis shows real GDP for Mexico indexed against the 2019 pre-shock value (GDP 2019 = 100). (For interpretation of the references to colour in this figure legend, the reader is referred to the web version of this article.)
Fig. 5.3
Fig. 5.3
Unemployment rate and public debt to GDP ratio (5 years time span). The x-axis shows the timeline of the simulation lasting until the fourth quarter in 2024 on a quarterly basis. The y-axis shows a) the unemployment rate (upper figure) for Mexico in percentage terms and b) public debt to GDP ratio (lower figure) for Mexico indexed against the BAU scenario considering no COVID-19 or natural hazard shock occurring (BAU = 100). (For interpretation of the references to colour in this figure legend, the reader is referred to the web version of this article.)
Fig. 5.4
Fig. 5.4
Sensitivity of real GDP to an increase in government’s spending and stronger credit constraints (represented by a minimum required CAR) 5 years after the shock. The red blue surface plot (a) refers to the COVID-19 only scenario (SC2). The blue yellow surface plot (b) refers to the compound COVID-19 and strong hazard scenario (SC4). The y-axis shows the percentage of additional government spending (ΔG) during the COVID-19 shock. The x-axis shows the minimum required CAR. The z-axis shows the impact on real GDP. (For interpretation of the references to colour in this figure legend, the reader is referred to the web version of this article.)
Fig. 5.5
Fig. 5.5
Sensitivity the debt to GDP ratio to an increase in government’s spending and stronger credit constraints (represented by a minimum required CAR) 5 years after the shock. The red blue surface plot (a) refers to the COVID-19 only scenario (SC2). The blue yellow surface plot (b) refers to the compound COVID-19 and strong hazard scenario (SC4). The y-axis shows the percentage of additional government spending (ΔG) during the COVID-19 shock. The x-axis shows the minimum required CAR. The z-axis shows the impact on the debt to GDP ratio. (For interpretation of the references to colour in this figure legend, the reader is referred to the web version of this article.)
Fig. 5.6
Fig. 5.6
Sensitivity of real GDP to an increase in government’s spending, stronger credit constraints (represented by a minimum required CAR), with and without complementary monetary policy 5 years after the shock. The purple-yellow surface plot (a) refers to the COVID-19 and mild hazard scenario (SC3) with only fiscal policy response. The red surface plot (b) refers to the compound COVID-19 and mild hazard scenario (SC3) with monetary policy in place. The y-axis shows the percentage of additional government spending (ΔG) during the COVID-19 shock. The x-axis shows the minimum required CAR. The z-axis shows the impact on real GDP. (For interpretation of the references to colour in this figure legend, the reader is referred to the web version of this article.)
Fig. 5.7
Fig. 5.7
Sensitivity of real GDP to an increase in government's spending, stronger credit constraints (represented by a minimum required CAR), with and without complementary monetary policy 5 years after the shock. The dark yellow surface plot (a) refers to the COVID-19 and strong hazard scenario (SC4) with only fiscal policy response. The turquoise-pink surface plot (b) refers to the compound COVID-19 and strong hazard scenario (SC4) with complementary monetary policy in place. The y-axis shows the percentage of additional government spending (ΔG) during the COVID-19 shock. The x-axis shows the minimum required CAR. The z-axis shows the impact on real GDP. (For interpretation of the references to colour in this figure legend, the reader is referred to the web version of this article.)
Fig. 5.8
Fig. 5.8
Compound risk indicator showing the non-linear amplification effects resulting from the compounding of COVID-19 and climate shocks happening in 2020. The x-axis shows the timeline of the simulation until 2024 on an annual basis. The y-axis shows the value of the CRI indexed against the sum of the individual event scenarios of hurricane only and COVID-19 only, at 100. The vertical dotted line represents the starting point of the input shocks, which occur during 2020. Two compound scenarios are considered, i.e.: (i) COVID-19 and mild hurricane scenario (red line) and (ii) COVID-19 and strong hurricane scenario (purple line). Being an index, we do not present results in percentage terms. (For interpretation of the references to colour in this figure legend, the reader is referred to the web version of this article.)

References

    1. Adrian, T., Natalucci, F., 2020. COVID-19 Crisis Poses Threat to Financial Stability. https://blogs.imf.org/2020/04/14/covid-19-crisis-poses-threat-to-financi....
    1. Ahmed F., Ahmed N., Pissarides C., Stiglitz J. Why inequality could spread COVID-19. Lancet Public Health. 2020;5(5):e240. doi: 10.1016/S2468-2667(20)30085-2. - DOI - PMC - PubMed
    1. Andries A.M., Ongena S., Srincean N. The COVID-19 pandemic and sovereign bond risk. Swiss Finance Inst. Res. Pap. Ser. 2020:20–42. doi: 10.2139/ssrn.3605155. - DOI
    1. Atlas of Economic Complexity, 2020. Export and Import Basket - Mexico. https://atlas.cid.harvard.edu/countries/138.
    1. Battiston S., Billio M., Monasterolo I. In: A New World Post COVID-19 Lessons for Business, the Finance Industry and Policy Makers. Billio M., Varotto S., editors. E-book; 2020. Pandemics, climate and public finance: how to strengthen socio-economic resilience across policy domains. - DOI

LinkOut - more resources