. 2023 May 15:14:1082078.
doi: 10.3389/fimmu.2023.1082078. eCollection 2023.

Cx3cr1 controls kidney resident macrophage heterogeneity

Affiliations

Cx3cr1 controls kidney resident macrophage heterogeneity

Alex Yashchenko et al. Front Immunol. .

Abstract

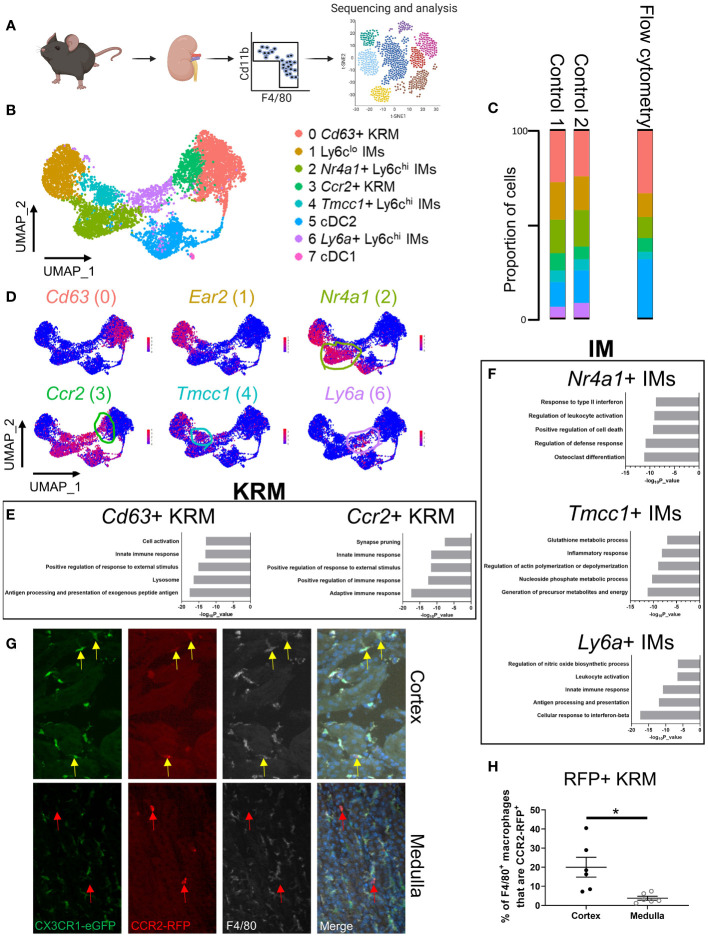
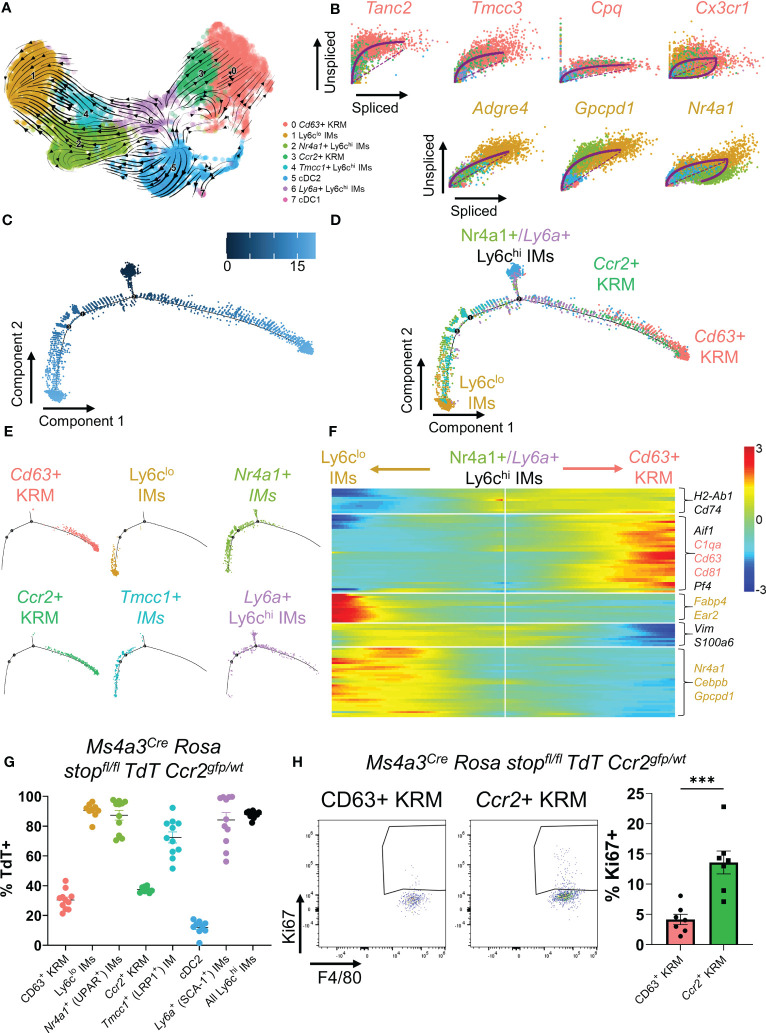
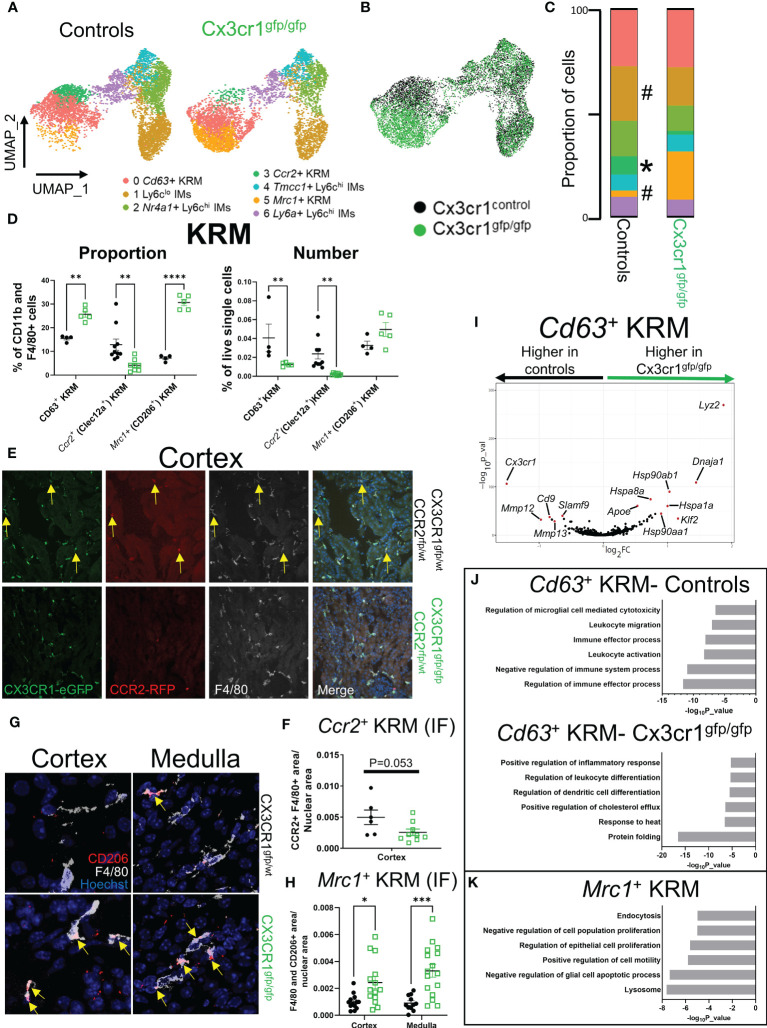
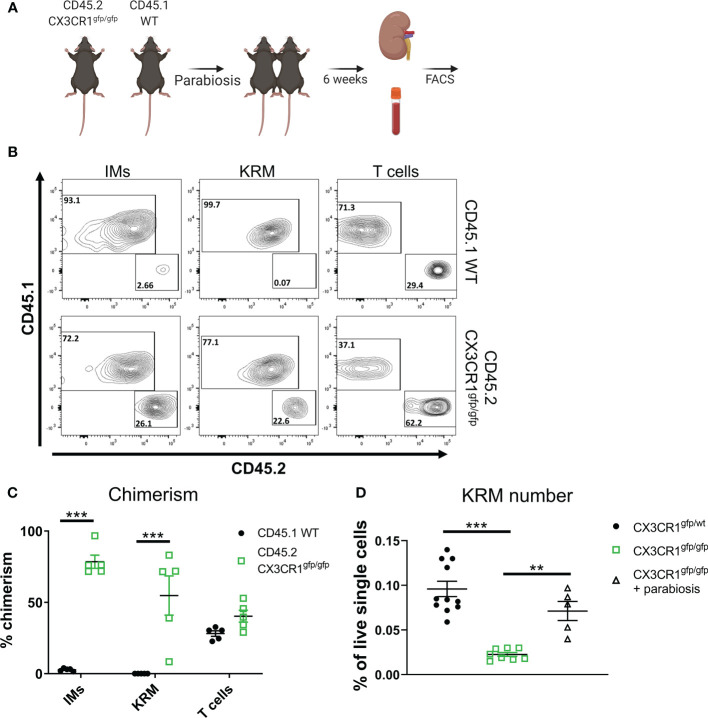
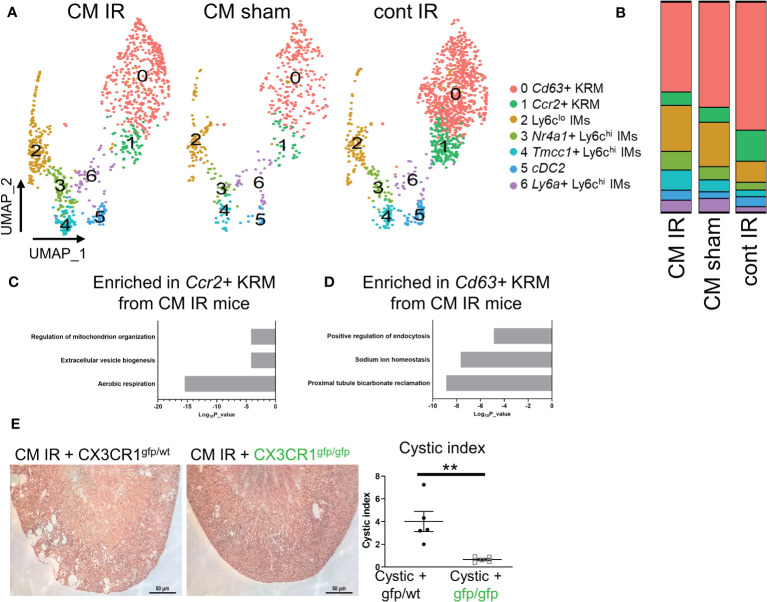
Kidney macrophages are comprised of both monocyte-derived and tissue resident populations; however, the heterogeneity of kidney macrophages and factors that regulate their heterogeneity are poorly understood. Herein, we performed single cell RNA sequencing (scRNAseq), fate mapping, and parabiosis to define the cellular heterogeneity of kidney macrophages in healthy mice. Our data indicate that healthy mouse kidneys contain four major subsets of monocytes and two major subsets of kidney resident macrophages (KRM) including a population with enriched Ccr2 expression, suggesting monocyte origin. Surprisingly, fate mapping data using the newly developed Ms4a3Cre Rosa Stopf/f TdT model indicate that less than 50% of Ccr2+ KRM are derived from Ly6chi monocytes. Instead, we find that Ccr2 expression in KRM reflects their spatial distribution as this cell population is almost exclusively found in the kidney cortex. We also identified Cx3cr1 as a gene that governs cortex specific accumulation of Ccr2+ KRM and show that loss of Ccr2+ KRM reduces the severity of cystic kidney disease in a mouse model where cysts are mainly localized to the kidney cortex. Collectively, our data indicate that Cx3cr1 regulates KRM heterogeneity and niche-specific disease progression.

Keywords: CCR2; CX3CR1; cystic kidney disease; fate mapping; kidney macrophages; macrophage heterogeneity; parabiosis; single cell RNA sequencing (scRNAseq).


Conflict of interest statement

The authors declare that the research was conducted in the absence of any commercial or financial relationships that could be construed as a potential conflict of interest.

Figures

Figure 1
Figure 1
scRNAseq reveals the cellular diversity of monocytes and tissue resident macrophages in the kidney. (A) Schematic of the strategy used to perform scRNAseq on CD11b+ and F4/80+ immune cells isolated from control mice. The control mice for this study were littermates of the Cx3cr1 gfp/gfp knockout mice shown in Figure 3 . (B) UMAP of myeloid cells identified via single cell RNA sequencing. (C) Quantification of cluster abundance in scRNAseq and flow cytometry data. For flow cytometry, we used surrogate markers to identify Nr4a1+ IMs (UPAR), Tmcc1+ IMs (LRP1), and Ccr2+ KRM (Clec12a). N=5 mice. (D) Feature plot showing top DEGs in each cell cluster. (E, F) Metascape pathway analysis of genes that were significantly enriched (adjusted p value < 0.05) in (E) KRM or (F) IM subsets. (G) Representative confocal microscopy images of kidneys harvested from Ccr2 rfp/wt Cx3cr1 gfp/wt mice that were stained with a pan-macrophage marker, F4/80. Yellow arrows depict Ccr2+ KRM while red arrows depict Ccr2+ cells that lacked Cx3cr1 and F4/80 expression. Images from both the cortex and medulla are shown. Images were taken with a 20X objective. N=3 mice. (H) Quantification of RFP, F4/80 double positive macrophages in the cortex and medulla. T-test. *P< 0.05.
Figure 2
Figure 2
Ccr2+ KRM are partially derived from Ly6chi monocytes. (A) RNA velocity plot of myeloid cells from Figure 1 . (B) List of the top predicted genes that are upregulated as IMs differentiate into Ccr2+/Cd63+ KRM (top) or Ly6clo IMs (bottom). Monocle data showing (C) pseudotime and (D) cluster composition of myeloid cells from Figure 1 . (E) Branched Monocle2 data showing individual clusters of cells. (F) Heatmap showing a list of genes that change as a function of pseudotime (Monocle). (G) Quantification of the proportion of each IM and KRM subset that was TdT+ in Ms4a3Cre Rosa stopfl/fl TdT Ccr2 gfp/wt knock-in fate mapping mice. N=8-11 mice. One-way ANOVA. (H) Representative FACS plots and quantification of the percentage of Ccr2+ or Cd63+ KRM that were Ki67 positive. T-test. ***P<0.001.
Figure 3
Figure 3
Cx3cr1 is required for accumulation of Ccr2+ KRM in the kidney cortex. (A) UMAP of cell clusters in control (N=2 mice; both female) and Cx3cr1 gfp/gfp knockout (N=2 mice; both female) mice. The control group shown in this figure is the same as the data shown in Figure 1 . (B) Composite UMAP of cells from control and Cx3cr1 gfp/gfp mice. (C) Quantification of cluster composition. T-test. (D) Quantification of flow cytometry data analyzing KRM subsets as a percentage of CD11b and F4/80 positive cells or as a percentage of live single cells in the kidney. Two-way ANOVA. (E) Representative confocal microscopy images of kidney sections isolated from the cortex of Cx3cr1 gfp/wt Ccr2 rfp/wt (top) or Cx3cr1 gfp/gfp Ccr2 rfp/wt (bottom) stained with the pan macrophage marker F4/80. Mice were 6-8 weeks of age at harvest. N=2-4 mice per group. (F) Quantification of RFP+ F4/80+ area normalized to total nuclear area in Cx3cr1 control or knockout mice. Each dot represents an individual image that was quantified from a combined 2-4 mice per group. T-test. (G) Representative confocal microscopy images of kidney sections isolated from the cortex (left) or medulla (right) of Cx3cr1 gfp/wt (top) or Cx3cr1 gfp/gfp (bottom) mice stained with the pan macrophage marker F4/80 and CD206. Mice were 6-8 weeks of age at the time of harvest. N=3-4 mice per group. (H) Quantification of F4/80+ CD206+ area normalized to total nuclear area in the cortex or medulla of Cx3cr1 control or knockout mice. Each dot represents an individual image that was quantified from a combined 3-4 mice per group. Two-way ANOVA. (I) Volcano plot showing genes that were enriched in Cd63+ KRM isolated from control or Cx3cr1 gfp/gfp kidneys. (J) Metascape pathway analysis of genes that were significantly enriched (adjusted p value < 0.05) in Cd63+ KRM isolated from control or Cx3cr1 gfp/gfp kidneys. (K) Metascape pathway analysis of genes that were significantly enriched (adjusted p value < 0.05) in Mrc1+ KRM compared to Cd63+ KRM. #P <0.1, *P< 0.05, **P< 0.01, ***P< 0.001, ****P< 0.0001.
Figure 4
Figure 4
Monocyte intrinsic Cx3cr1 expression is required for KRM niche filling. (A) Schematic of parabiosis experiment. (B) Representative FACS plots of IMs, KRM, and T cells from wild type CD45.1 and CD45.2 Cx3cr1 gfp/gfp knockout mice 6 weeks post hook-up. (C, D) Quantification of (C) chimerism and (D) KRM number (graphed as a % of live single cells) in wild type CD45.1 and CD45.2 Cx3cr1 gfp/gfp knockout mice 6 weeks post parabiosis surgery. Significance was determined by a (C) Two-way ANOVA or (D) One-way ANOVA. **P< 0.01, ***P< 0.001.
Figure 5
Figure 5
Loss of Cx3cr1 reduces injury accelerated cystic disease. (A) UMAP showing clusters of macrophages and dendritic cells in cystic (CM IR) and control mice (CM sham, cont IR) mice 56 days post IR injury or sham surgery. (B) Quantification of cluster composition in biological duplicates. (C, D) Pathway analysis of genes that were enriched (adjusted P value < 0.05) in (C) Ccr2+ KRM or (D) Cd63+ KRM from cystic mice compared to control mice (CM sham and cont IR). (E) Representative H&E images and quantification of cystic index in CM IR mice on the Cx3cr1 gfp/wt or Cx3cr1 gfp/gfp background 56 days post injury. **P< 0.01.

References

    1. Schulz C, Gomez Perdiguero E, Chorro L, Szabo-Rogers H, Cagnard N, Kierdorf K, et al. . A lineage of myeloid cells independent of myb and hematopoietic stem cells. Science (2012) 336:86–90. doi: 10.1126/science.1219179 - DOI - PubMed
    1. Gomez Perdiguero E, Klapproth K, Schulz C, Busch K, Azzoni E, Crozet L, et al. . Tissue-resident macrophages originate from yolk-sac-derived erythro-myeloid progenitors. Nature (2015) 518:547–51. doi: 10.1038/nature13989 - DOI - PMC - PubMed
    1. Hoeffel G, Chen J, Lavin Y, Low D, Almeida FF, See P, et al. . C-myb(+) erythro-myeloid progenitor-derived fetal monocytes give rise to adult tissue-resident macrophages. Immunity (2015) 42:665–78. doi: 10.1016/j.immuni.2015.03.011 - DOI - PMC - PubMed
    1. Munro D, Hughes J. The origins and functions of tissue-resident macrophages in kidney development. Front Physiol (2017) 8:837. doi: 10.3389/fphys.2017.00837 - DOI - PMC - PubMed
    1. Yona S, Kim KW, Wolf Y, Mildner A, Varol D, Breker M, et al. . Fate mapping reveals origins and dynamics of monocytes and tissue macrophages under homeostasis. Immunity (2013) 38:79–91. doi: 10.1016/j.immuni.2012.12.001 - DOI - PMC - PubMed

Publication types

LinkOut - more resources