

A novel cell-based screen identifies chemical entities that reverse the immune-escape phenotype of metastatic tumours
- PMID: 37256225
- PMCID: PMC10225555
- DOI: 10.3389/fphar.2023.1119607
A novel cell-based screen identifies chemical entities that reverse the immune-escape phenotype of metastatic tumours
Erratum in
-
Erratum: A novel cell-based screen identifies chemical entities that reverse the immune-escape phenotype of metastatic tumours.Front Pharmacol. 2023 Jun 12;14:1233717. doi: 10.3389/fphar.2023.1233717. eCollection 2023. Front Pharmacol. 2023. PMID: 37377926 Free PMC article.
Abstract
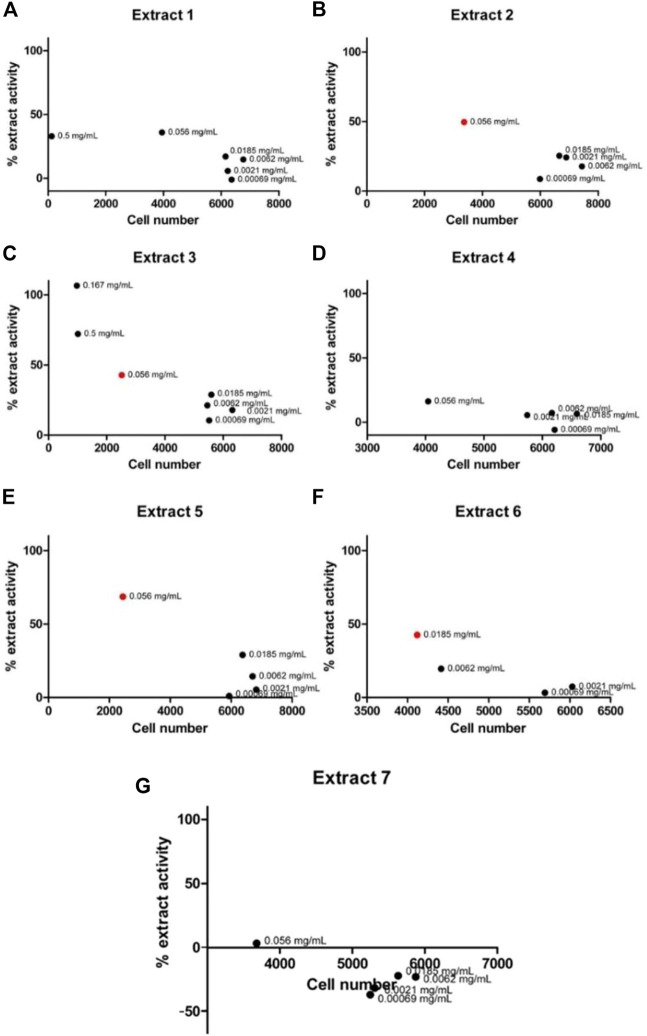
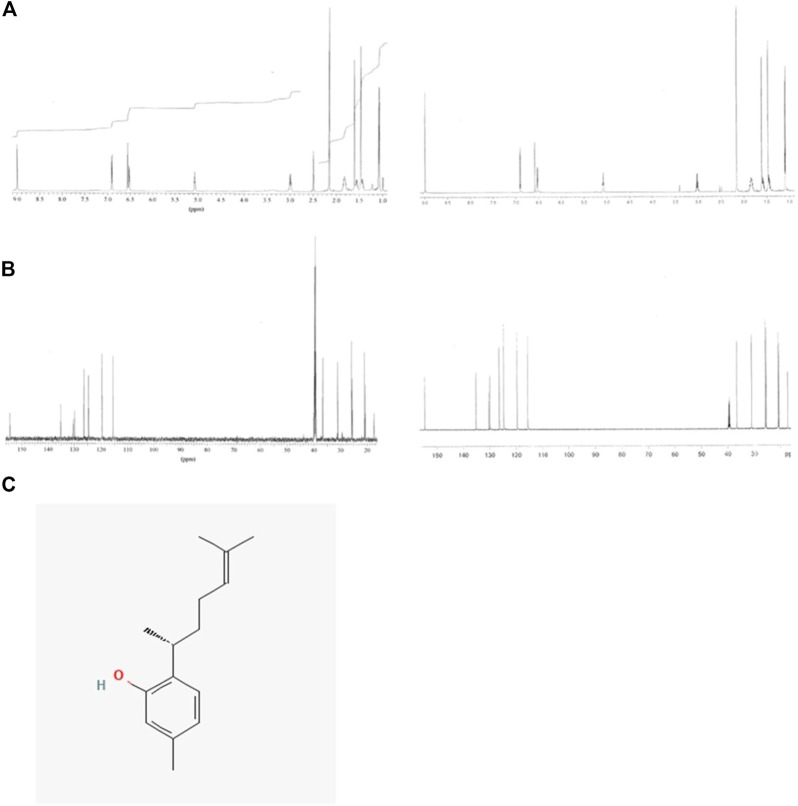
Genetic and epigenetic events have been implicated in the downregulation of the cellular antigen processing and presentation machinery (APM), which in turn, has been associated with cancer evasion of the immune system. When these essential components are lacking, cancers develop the ability to subvert host immune surveillance allowing cancer cells to become invisible to the immune system and, in turn, promote cancer metastasis. Here we describe and validate the first high-throughput cell-based screening assay to identify chemical extracts and unique chemical entities that reverse the downregulation of APM components in cell lines derived from metastatic tumours. Through the screening of a library of 480 marine invertebrate extracts followed by bioassay-guided fractionation, curcuphenol, a common sesquiterpene phenol derived from turmeric, was identified as the active compound of one of the extracts. We demonstrate that curcuphenol induces the expression of the APM components, TAP-1 and MHC-I molecules, in cell lines derived from both metastatic prostate and lung carcinomas. Turmeric and curcumins that contain curcuphenol have long been utilized not only as a spice in the preparation of food, but also in traditional medicines for treating cancers. The remarkable discovery that a common component of spices can increase the expression of APM components in metastatic tumour cells and, therefore reverse immune-escape mechanisms, provides a rationale for the development of foods and advanced nutraceuticals as therapeutic candidates for harnessing the power of the immune system to recognize and destroy metastatic cancers.
Keywords: antigen processing machinery; curcuphenol; drug discovery; high throughput cell-based assay; major histocompatibility complex class I; metastatic tumours; natural products.
Copyright © 2023 Nohara, Ellis, Dreier, Dada, Saranchova, Munro, Pfeifer, Coyle, Morrice, Shim, Ahn, De Voogd, Williams, Cheng, Garrovillas, Andersen and Jefferies.
Conflict of interest statement
WAJ is a founder and SLSE, LLN, SD, IS, KBC, CGP, PC, RJA and WAJ are equity holders in CaVa Healthcare Inc, the holder of UBC licenses and patents related to this work. The other authors declare no competing financial interests.
Figures


Similar articles
-
Curcuphenol possesses an unusual histone deacetylase enhancing activity that counters immune escape in metastatic tumours.Front Pharmacol. 2023 Aug 10;14:1119620. doi: 10.3389/fphar.2023.1119620. eCollection 2023. Front Pharmacol. 2023. PMID: 37637416 Free PMC article.
-
Erratum: A novel cell-based screen identifies chemical entities that reverse the immune-escape phenotype of metastatic tumours.Front Pharmacol. 2023 Jun 12;14:1233717. doi: 10.3389/fphar.2023.1233717. eCollection 2023. Front Pharmacol. 2023. PMID: 37377926 Free PMC article.
-
Specific cannabinoids revive adaptive immunity by reversing immune evasion mechanisms in metastatic tumours.Front Immunol. 2023 Feb 22;13:982082. doi: 10.3389/fimmu.2022.982082. eCollection 2022. Front Immunol. 2023. PMID: 36923728 Free PMC article.
-
Cancer Immune Evasion Through Loss of MHC Class I Antigen Presentation.Front Immunol. 2021 Mar 9;12:636568. doi: 10.3389/fimmu.2021.636568. eCollection 2021. Front Immunol. 2021. PMID: 33767702 Free PMC article. Review.
-
HLA Class I Antigen Processing Machinery Defects in Cancer Cells-Frequency, Functional Significance, and Clinical Relevance with Special Emphasis on Their Role in T Cell-Based Immunotherapy of Malignant Disease.Methods Mol Biol. 2020;2055:325-350. doi: 10.1007/978-1-4939-9773-2_15. Methods Mol Biol. 2020. PMID: 31502159 Review.
Cited by
-
Comparative Analysis of Volatile Compounds and Biochemical Activity of Curcuma xanthorrhiza Roxb. Essential Oil Extracted from Distinct Shaded Plants.Plants (Basel). 2024 Sep 25;13(19):2682. doi: 10.3390/plants13192682. Plants (Basel). 2024. PMID: 39409552 Free PMC article.
-
Curcuphenol possesses an unusual histone deacetylase enhancing activity that counters immune escape in metastatic tumours.Front Pharmacol. 2023 Aug 10;14:1119620. doi: 10.3389/fphar.2023.1119620. eCollection 2023. Front Pharmacol. 2023. PMID: 37637416 Free PMC article.
-
Curcuminoids as Anticancer Drugs: Pleiotropic Effects, Potential for Metabolic Reprogramming and Prospects for the Future.Pharmaceutics. 2023 May 29;15(6):1612. doi: 10.3390/pharmaceutics15061612. Pharmaceutics. 2023. PMID: 37376060 Free PMC article. Review.
-
A diversity of novel type-2 innate lymphoid cell subpopulations revealed during tumour expansion.Commun Biol. 2024 Jan 3;7(1):12. doi: 10.1038/s42003-023-05536-0. Commun Biol. 2024. PMID: 38172434 Free PMC article.
-
APM-Related gene signature model to predict prognosis and immunotherapy response in hepatocellular carcinoma.Hum Genet. 2025 Jul;144(7):741-759. doi: 10.1007/s00439-025-02753-x. Epub 2025 May 27. Hum Genet. 2025. PMID: 40423787
References
-
- Almeida L., Dhillon-LaBrooy A., Castro C. N., Adossa N., Carriche G. M., Guderian M., et al. (2021). Ribosome-targeting antibiotics impair T cell effector function and ameliorate autoimmunity by blocking mitochondrial protein synthesis. Immunity 54, 68–83.e6. 10.1016/j.immuni.2020.11.001 - DOI - PMC - PubMed
-
- Alpan R. S., Zhang M., Pardee A. B. (1996). Cell cycle-dependent expression of TAP1, TAP2, and HLA-B27 messenger RNAs in a human breast cancer cell line. Cancer Res. 56, 4358–4361. - PubMed
LinkOut - more resources
Full Text Sources
Research Materials
Miscellaneous