. 2023 Aug;12(4):1235-1255.
doi: 10.1007/s40120-023-00498-1. Epub 2023 May 31.

Estimating Transition Probabilities Across the Alzheimer's Disease Continuum Using a Nationally Representative Real-World Database in the United States

Affiliations

Estimating Transition Probabilities Across the Alzheimer's Disease Continuum Using a Nationally Representative Real-World Database in the United States

Amir Abbas Tahami Monfared et al. Neurol Ther. 2023 Aug.

Abstract

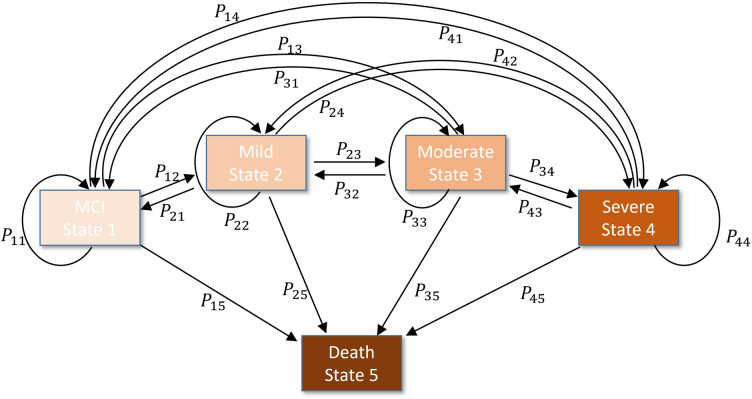
Introduction: Clinical Alzheimer's disease (AD) begins with mild cognitive impairment (MCI) and progresses to mild, moderate, or severe dementia, constituting a disease continuum that eventually leads to death. This study aimed to estimate the probabilities of transitions across those disease states.

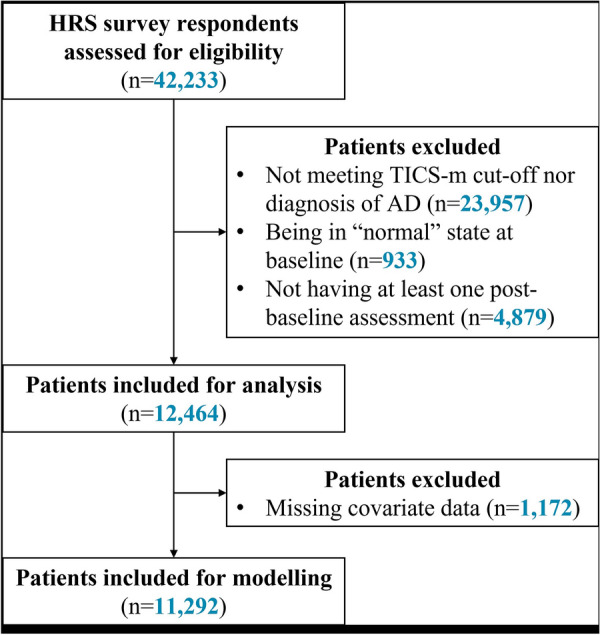
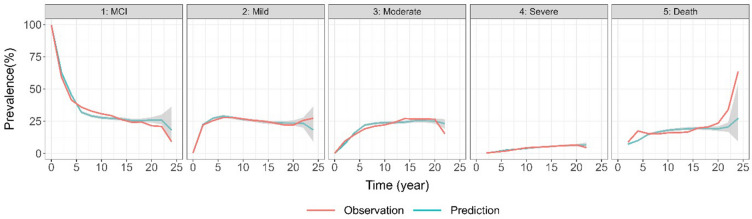
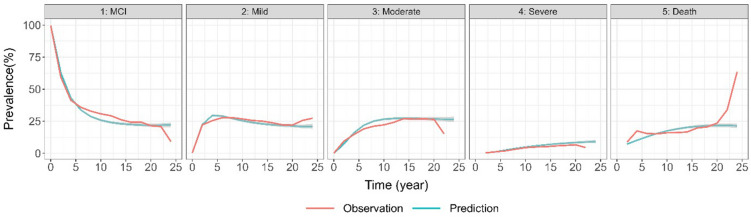
Methods: We developed a mixed-effects multi-state Markov model to estimate the transition probabilities, adjusted for 5 baseline covariates, using the Health and Retirement Study (HRS) database. HRS surveys older adults in the United States bi-annually. Alzheimer states were defined using the modified Telephone Interview of Cognitive Status (TICS-m).

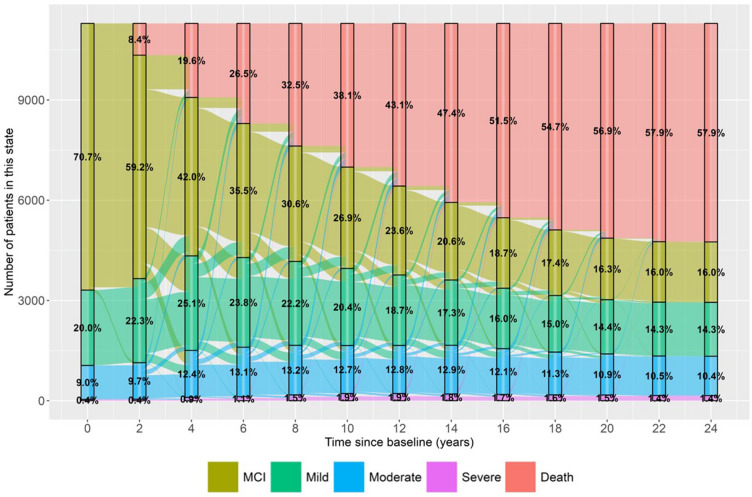
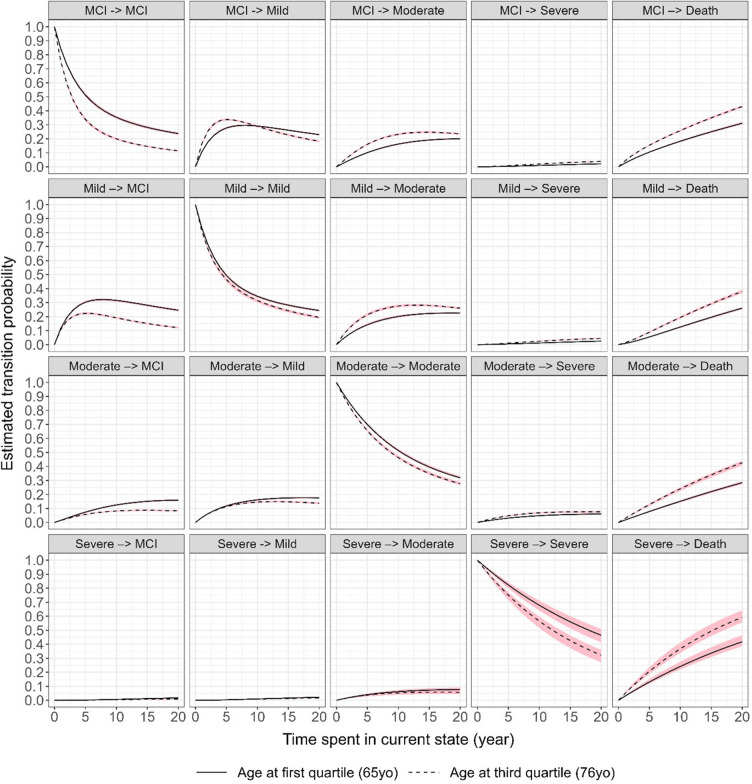
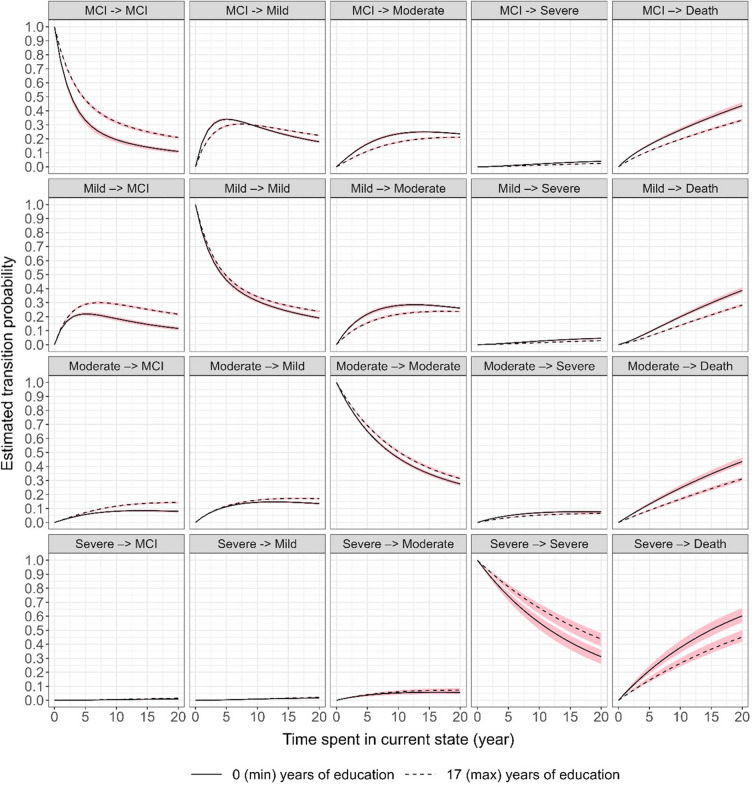
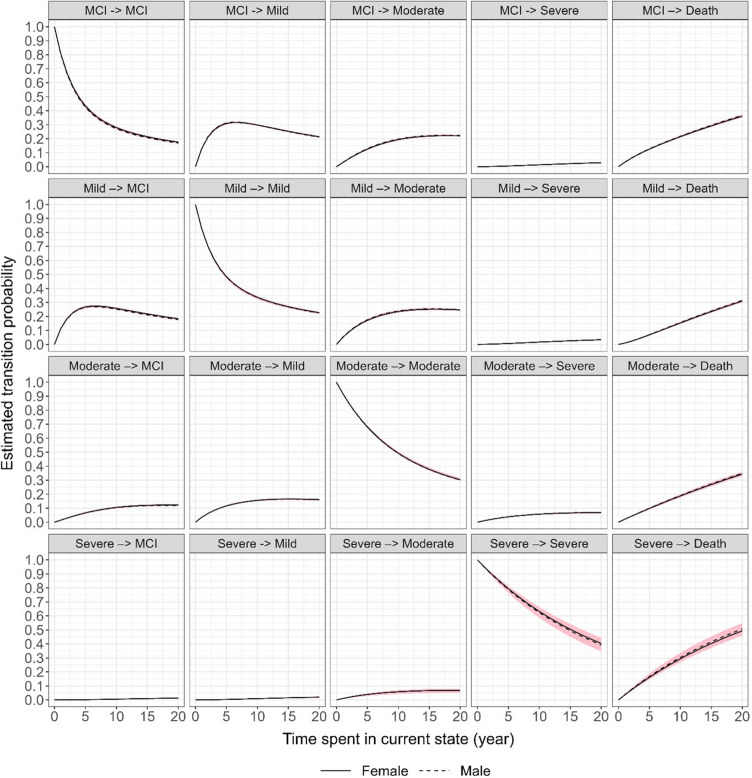
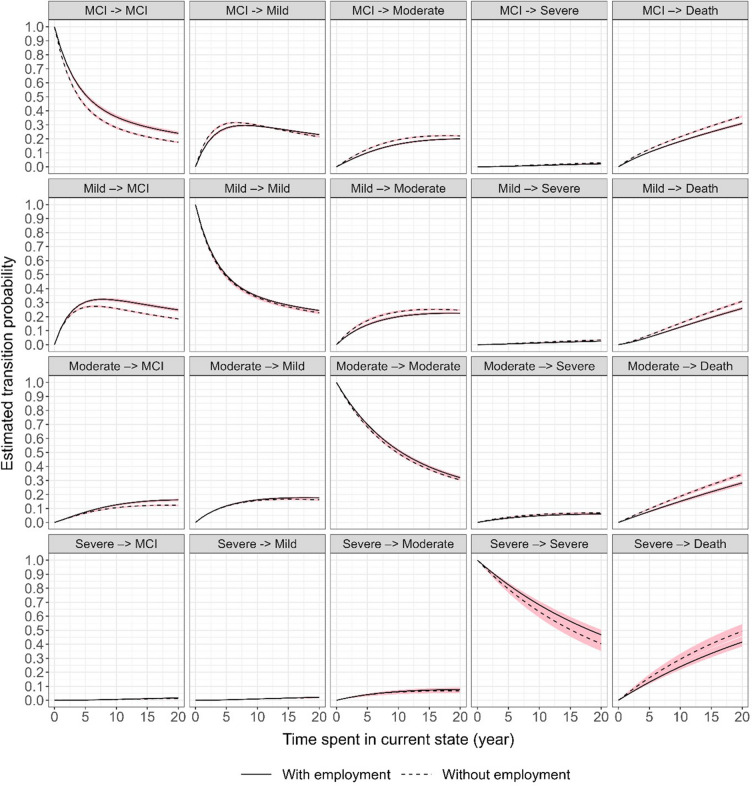
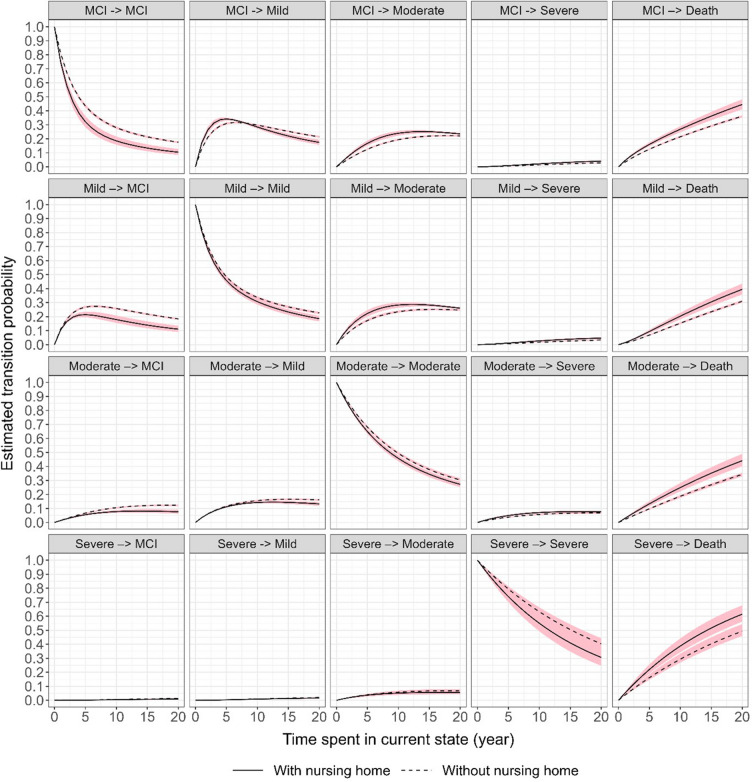
Results: A total of 11,292 AD patients were analyzed. Patients were 70.8 ± 9.0 years old, 54.9% female, and with 12.0 ± 3.3 years of education. Within 1 year from the initial state, the model estimated a higher probability of transition to the next AD state in earlier disease: 12.8% from MCI to mild AD and 5.0% from mild to moderate AD, but < 1% from moderate to severe AD. After 10 years, the probability of transition to the next state was markedly higher for all states, but still higher in earlier disease: 29.8% from MCI to mild AD, 23.5% from mild to moderate AD, and 5.7% from moderate to severe AD. Across all AD states, the probability of transition to death was < 5% after 1 year and > 15% after 10 years. Older age, fewer years of education, unemployment, and nursing home stay were associated with a higher risk of disease progression (p < 0.01).

Conclusions: This analysis shows that the risk of progression is greater in earlier AD states, increases over time, and is higher in patients who are older, with fewer years of education, unemployed, or in a nursing home at baseline. The estimated transition probabilities can provide guidance for future disease management and clinical trial design optimization, and can be used to refine existing cost-effectiveness frameworks.

Keywords: Alzheimer’s disease; Disease progression; Mixed-effects model; Multi-state Markov model; TICS-m; Transition probability.


Conflict of interest statement

Amir Abbas Tahami Monfared is an employee of Eisai Inc. He serves as Associate Editor for the Journal of Alzheimer's Disease and did not receive any fees or honoraria. Raymond Zhang and Quanwu Zhang are employees of Eisai Inc. Shuai Fu, Noemi Hummel, Luyuan Qi and Aastha Chandak are or were employees of Certara at the time of writing the manuscript. Luyuan Qi is now affiliated with Novartis Pharma AG, Basel, Switzerland. Kulvinder K Singh received funding from Eisai for providing medical writing support. Min-ge Xie received consultancy fees from Eisai for providing statistical advice.

Figures

Fig. 1
Fig. 1
Five-state Markov model. Pij(i,j=1,2,5) are the transition probabilities from state I to state j. Arrows depict transition direction between states. MCI mild cognitive impairment
Fig. 2
Fig. 2
Flow chart. AD Alzheimer’s disease, HRS Health and Retirement Study, TICS-m modified telephone interview for cognitive status
Fig. 3
Fig. 3
Patient counts and percentages per disease state over time. This Sankey plot shows the number and percentage of patients in a particular disease state at baseline (time = 0 years) and subsequent bi-annual surveys (time = 2, 4, 6,… years). MCI is represented in olive green, mild AD in green, moderate AD in blue, severe AD in violet, and the absorbing death state in red. The colored curves between the time points indicate the number of patients transitioning from one state to another, e.g., from time = 0 to time = 2, approximately 290 patients transition from MCI to mild AD, approximately 90 to moderate AD, and approximately 1050 to death, while none transition to severe AD. AD Alzheimer’s disease, MCI mild cognitive impairment
Fig. 4
Fig. 4
One-step predicted vs. observed prevalence per disease state over time. The red lines denote the observed prevalence over time, the blue lines denote the one-step predicted prevalence over time, while the shaded area is the 95% credible interval of the prediction. MCI mild cognitive impairment
Fig. 5
Fig. 5
Longitudinal predicted vs. observed prevalence per disease state over time. The red lines denote the observed prevalence over time, the blue lines denote the one-step predicted prevalence over time, while the shaded area is the 95% credible interval of the prediction. MCI mild cognitive impairment
Fig. 6
Fig. 6
Estimated transition probabilities over time. The results are based on the population level parameter estimates (i.e., fixed effects) of the model with median values for all 5 baseline covariates. The shaded area is the 95% credible interval of the prediction. MCI mild cognitive impairment
Fig. 7
Fig. 7
Estimated transition probabilities over time by age subgroups. The results are based on the population level parameter estimates (i.e., fixed effects) of the model, with the other 4 baseline covariates set to their median values. The shaded area is the 95% credible interval of the predictions, solid lines denote age at first quartile (65 years old), and dotted lines denote age at third quartile (76 years old). MCI mild cognitive impairment
Fig. 8
Fig. 8
Estimated transition probabilities over time by years of education subgroups. The results are based on the population level parameter estimates (i.e., fixed effects) of the model, with the other 4 baseline covariates set to their median values. The shaded area is the 95% credible interval of the predictions, solid lines denote 0 (minimal) year of education and dotted lines denote 17 (maximal) years of education. MCI mild cognitive impairment
Fig. 9
Fig. 9
Estimated transition probabilities over time by sex. The results are based on the population level parameter estimates (i.e., fixed effects) of the model, with the other 4 baseline covariates set to their median values. The shaded area is the 95% credible interval of the predictions, solid lines denote female and dotted lines denote male. MCI mild cognitive impairment
Fig. 10
Fig. 10
Estimated transition probabilities over time by employment status. The results are based on the population level parameter estimates (i.e., fixed effects) of the model, with the other 4 baseline covariates set to their median values. The shaded area is the 95% credible interval of the predictions, solid lines denote with employment and dotted lines denote without employment. MCI mild cognitive impairment
Fig. 11
Fig. 11
Estimated transition probabilities over time by nursing home status. The results are based on the population level parameter estimates (i.e., fixed effects) of the model, with the other 4 baseline covariates set to their median values. The shaded area is the 95% credible interval of the predictions, solid lines denote with nursing home, and dotted lines denote without nursing home. MCI mild cognitive impairment

References

    1. Rajan KB, Weuve J, Barnes LL, McAninch EA, Wilson RS, Evans DA. Population estimate of people with clinical Alzheimer's disease and mild cognitive impairment in the United States (2020–2060) Alzheimers Dement. 2021;17(12):1966–1975. doi: 10.1002/alz.12362. - DOI - PMC - PubMed
    1. Wimo A, Guerchet M, Ali GC, et al. The worldwide costs of dementia 2015 and comparisons with 2010. Alzheimers Dement. 2017;13(1):1–7. doi: 10.1016/j.jalz.2016.07.150. - DOI - PMC - PubMed
    1. Jutkowitz E, Kane RL, Gaugler JE, MacLehose RF, Dowd B, Kuntz KM. Societal and family lifetime cost of dementia: implications for policy. J Am Geriatr Soc. 2017;65(10):2169–2175. doi: 10.1111/jgs.15043. - DOI - PMC - PubMed
    1. 2022 Alzheimer's disease facts and figures. Alzheimers Dement. 2022;18(4):700–789. 10.1002/alz.12638. - PubMed
    1. Tahami Monfared AA, Byrnes MJ, White LA, Zhang Q. The humanistic and economic burden of Alzheimer's disease. Neurol Ther. 2022 doi: 10.1007/s40120-022-00335-x. - DOI - PMC - PubMed

LinkOut - more resources