

Phylogenetic and biogeographical traits predict unrecognized hosts of zoonotic leishmaniasis
- PMID: 37256857
- PMCID: PMC10231829
- DOI: 10.1371/journal.pntd.0010879
Phylogenetic and biogeographical traits predict unrecognized hosts of zoonotic leishmaniasis
Abstract
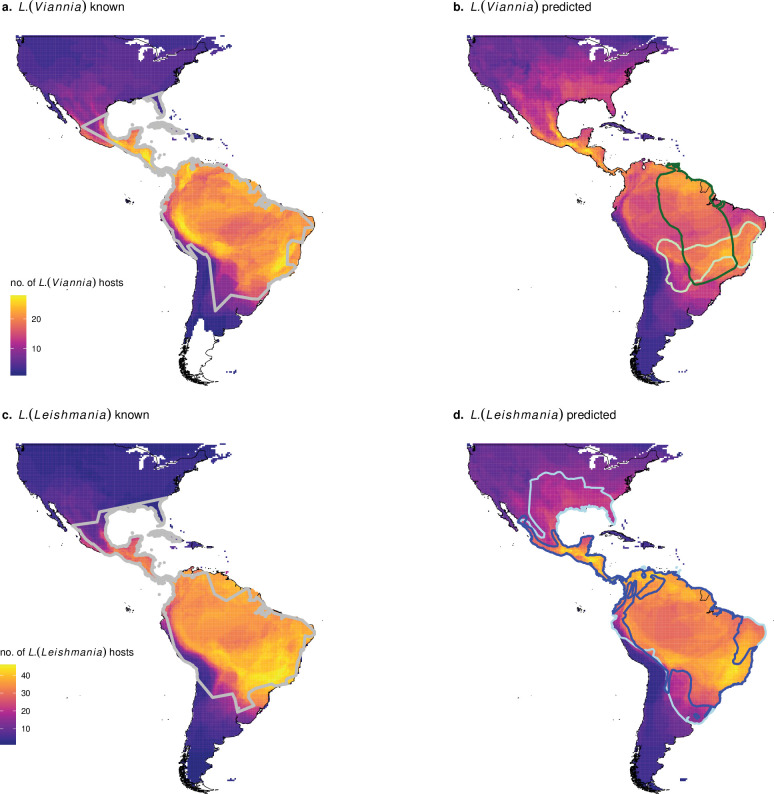
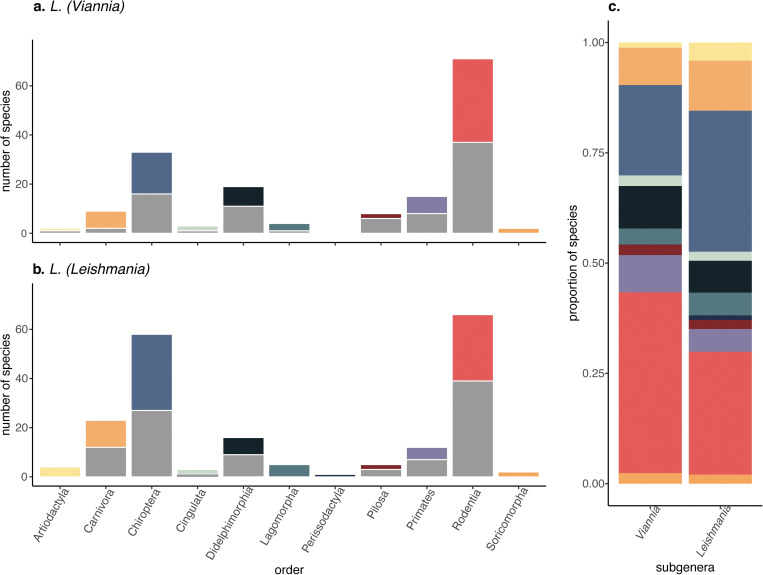
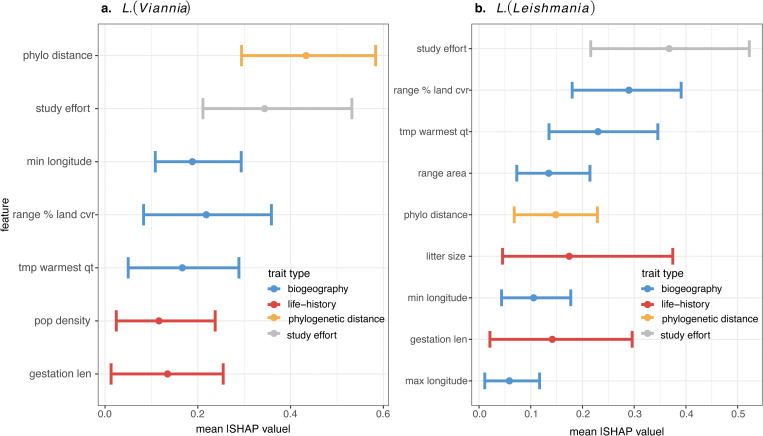
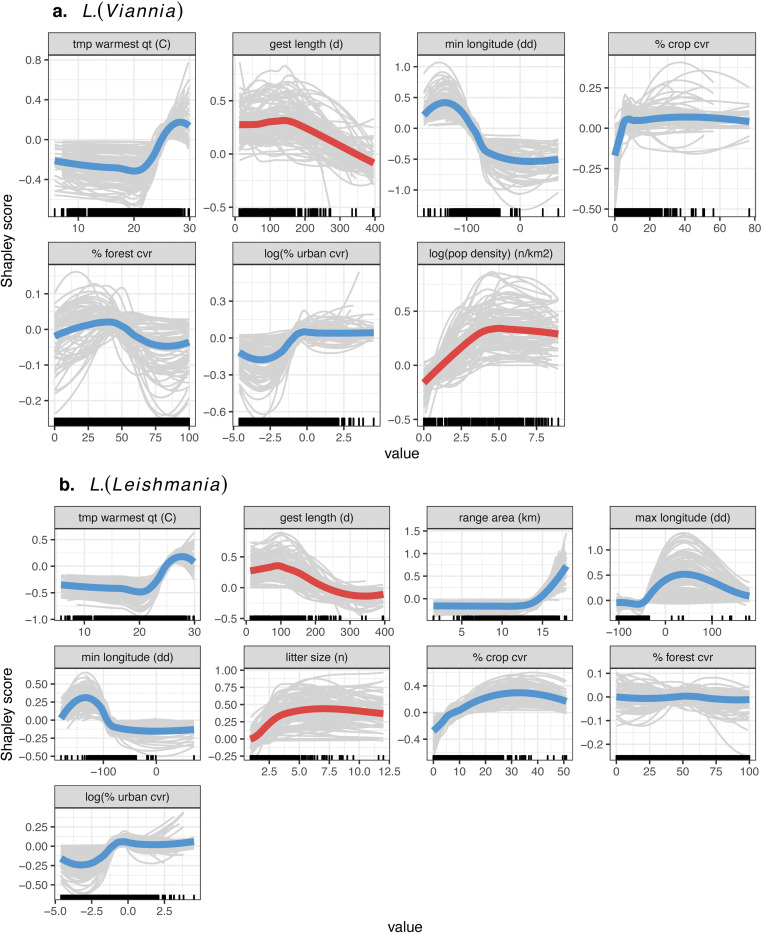
The spatio-temporal distribution of leishmaniasis, a parasitic vector-borne zoonotic disease, is significantly impacted by land-use change and climate warming in the Americas. However, predicting and containing outbreaks is challenging as the zoonotic Leishmania system is highly complex: leishmaniasis (visceral, cutaneous and muco-cutaneous) in humans is caused by up to 14 different Leishmania species, and the parasite is transmitted by dozens of sandfly species and is known to infect almost twice as many wildlife species. Despite the already broad known host range, new hosts are discovered almost annually and Leishmania transmission to humans occurs in absence of a known host. As such, the full range of Leishmania hosts is undetermined, inhibiting the use of ecological interventions to limit pathogen spread and the ability to accurately predict the impact of global change on disease risk. Here, we employed a machine learning approach to generate trait profiles of known zoonotic Leishmania wildlife hosts (mammals that are naturally exposed and susceptible to infection) and used trait-profiles of known hosts to identify potentially unrecognized hosts. We found that biogeography, phylogenetic distance, and study effort best predicted Leishmania host status. Traits associated with global change, such as agricultural land-cover, urban land-cover, and climate, were among the top predictors of host status. Most notably, our analysis suggested that zoonotic Leishmania hosts are significantly undersampled, as our model predicted just as many unrecognized hosts as unknown hosts. Overall, our analysis facilitates targeted surveillance strategies and improved understanding of the impact of environmental change on local transmission cycles.
Copyright: © 2023 Glidden et al. This is an open access article distributed under the terms of the Creative Commons Attribution License, which permits unrestricted use, distribution, and reproduction in any medium, provided the original author and source are credited.
Conflict of interest statement
The authors have declared that no competing interests exist.
Figures
Similar articles
-
Data-driven predictions of potential Leishmania vectors in the Americas.PLoS Negl Trop Dis. 2023 Feb 21;17(2):e0010749. doi: 10.1371/journal.pntd.0010749. eCollection 2023 Feb. PLoS Negl Trop Dis. 2023. PMID: 36809249 Free PMC article.
-
Interactions between Leishmania parasite and sandfly: a review.Parasitol Res. 2023 Dec 6;123(1):6. doi: 10.1007/s00436-023-08043-7. Parasitol Res. 2023. PMID: 38052752 Review.
-
Using iDNA to determine impacts of Amazonian deforestation on Leishmania hosts, vectors, and their interactions.PLoS Negl Trop Dis. 2025 Mar 27;19(3):e0012925. doi: 10.1371/journal.pntd.0012925. eCollection 2025 Mar. PLoS Negl Trop Dis. 2025. PMID: 40146697 Free PMC article.
-
Seasonal phenology, host-blood feeding preferences and natural Leishmania infection of Phlebotomus perniciosus (Diptera, Psychodidae) in a high-endemic focus of canine leishmaniasis in Rome province, Italy.Acta Trop. 2008 Feb;105(2):158-65. doi: 10.1016/j.actatropica.2007.10.005. Epub 2007 Oct 18. Acta Trop. 2008. PMID: 18035329
-
[Prevention and control of leishmaniasis vectors: current approaches].Parassitologia. 2004 Jun;46(1-2):211-5. Parassitologia. 2004. PMID: 15305719 Review. Italian.
Cited by
-
Enzootic transmission of Leishmania spp. in gallery forests of the Brazilian Cerrado.Rev Bras Parasitol Vet. 2024 Dec 6;33(4):e011624. doi: 10.1590/S1984-29612024073. eCollection 2024. Rev Bras Parasitol Vet. 2024. PMID: 39661812 Free PMC article.
-
Nationwide cross-sectional surveillance of Leishmania donovani in phlebotomine sand flies and its impact on national kala-azar elimination in India.Sci Rep. 2024 Nov 18;14(1):28455. doi: 10.1038/s41598-024-78915-0. Sci Rep. 2024. PMID: 39557939 Free PMC article.
References
-
- WHO. The road map targets for 2030 [Internet]. The road map targets for 2030. 2022. [cited 2022 Jun 12]. Available from: https://www.who.int/teams/control-of-neglected-tropical-diseases/ending-....
-
- PAHO. Leishmaniasis—PAHO/WHO | Pan American Health Organization [Internet]. 2022. [cited 2022 Jun 12]. Available from: https://www.paho.org/en/topics/leishmaniasis.
-
- Bayles BR, Rusk A, Christofferson R, Agar G, Pineda MA, Chen B, et al.. Spatiotemporal dynamics of vector-borne disease risk across human land-use gradients: examining the role of agriculture, indigenous territories, and protected areas in Costa Rica. Lancet Glob Health. 2020. Apr 1;8:S32.
MeSH terms
Grants and funding
LinkOut - more resources
Full Text Sources
Medical
Research Materials
