Genetic diversity and population structure analysis in cultivated soybean (Glycine max [L.] Merr.) using SSR and EST-SSR markers
- PMID: 37256876
- PMCID: PMC10231820
- DOI: 10.1371/journal.pone.0286099
Genetic diversity and population structure analysis in cultivated soybean (Glycine max [L.] Merr.) using SSR and EST-SSR markers
Abstract
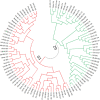
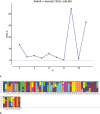
Soybean (Glycine max) is an important legume that is used to fulfill the need of protein and oil of large number of population across the world. There are large numbers of soybean germplasm present in the USDA germplasm resources. Finding and understanding genetically diverse germplasm is a top priority for crop improvement programs. The current study used 20 functional EST-SSR and 80 SSR markers to characterize 96 soybean accessions from diverse geographic backgrounds. Ninety-six of the 100 markers were polymorphic, with 262 alleles (average 2.79 per locus). The molecular markers had an average polymorphic information content (PIC) value of 0.44, with 28 markers ≥ 0.50. The average major allele frequency was 0.57. The observed heterozygosity of the population ranged from 0-0.184 (average 0.02), while the expected heterozygosity ranged from 0.20-0.73 (average 0.51). The lower value for observed heterozygosity than expected heterozygosity suggests the likelihood of a population structure among the germplasm. The phylogenetic analysis and principal coordinate analysis (PCoA) divided the total population into two major groups (G1 and G2), with G1 comprising most of the USA lines and the Australian and Brazilian lines. Furthermore, the phylogenetic analysis and PCoA divided the USA lines into three major clusters without any specific differentiation, supported by the model-based STRUCTURE analysis. Analysis of molecular variance (AMOVA) showed 94% variation among individuals in the total population, with 2% among the populations. For the USA lines, 93% of the variation occurred among individuals, with only 2% among lines from different US states. Pairwise population distance indicated more similarity between the lines from continental America and Australia (189.371) than Asia (199.518). Overall, the 96 soybean lines had a high degree of genetic diversity.
Copyright: © 2023 Rani et al. This is an open access article distributed under the terms of the Creative Commons Attribution License, which permits unrestricted use, distribution, and reproduction in any medium, provided the original author and source are credited.
Conflict of interest statement
The authors have declared that no competing interests exist.
Figures


Similar articles
-
Genetic diversity and population structure analysis of Kala bhat (Glycine max (L.) Merrill) genotypes using SSR markers.Hereditas. 2017 Apr 27;154:9. doi: 10.1186/s41065-017-0030-8. eCollection 2017. Hereditas. 2017. PMID: 28461811 Free PMC article.
-
Molecular characterization and genetic diversity studies of Indian soybean (Glycine max (L.) Merr.) cultivars using SSR markers.Mol Biol Rep. 2022 Mar;49(3):2129-2140. doi: 10.1007/s11033-021-07030-4. Epub 2021 Dec 11. Mol Biol Rep. 2022. PMID: 34894334 Free PMC article.
-
Determination of the genetic diversity of vegetable soybean [Glycine max (L.) Merr.] using EST-SSR markers.J Zhejiang Univ Sci B. 2013 Apr;14(4):279-88. doi: 10.1631/jzus.B1200243. J Zhejiang Univ Sci B. 2013. PMID: 23549845 Free PMC article.
-
Genetic diversity and population structure among accessions of Perilla frutescens (L.) Britton in East Asia using new developed microsatellite markers.Genes Genomics. 2018 Dec;40(12):1319-1329. doi: 10.1007/s13258-018-0727-8. Epub 2018 Aug 13. Genes Genomics. 2018. PMID: 30105737
-
Molecular characterization and genetic diversity analysis of soybean (Glycine max (L.) Merr.) germplasm accessions in India.Physiol Mol Biol Plants. 2015 Jan;21(1):101-7. doi: 10.1007/s12298-014-0266-y. Epub 2014 Oct 25. Physiol Mol Biol Plants. 2015. PMID: 25649315 Free PMC article.
Cited by
-
Genetic Diversity Analysis of Soybean Collection Using Simple Sequence Repeat Markers.Plants (Basel). 2023 Sep 30;12(19):3445. doi: 10.3390/plants12193445. Plants (Basel). 2023. PMID: 37836185 Free PMC article.
-
Microsatellite marker-based analysis of the genetic diversity and population structure of three Arnebiae Radix in western China.J Genet Eng Biotechnol. 2024 Jun;22(2):100379. doi: 10.1016/j.jgeb.2024.100379. Epub 2024 May 3. J Genet Eng Biotechnol. 2024. PMID: 38797554 Free PMC article.
-
Genome-wide association study of soybean (Glycine max [L.] Merr.) germplasm for dissecting the quantitative trait nucleotides and candidate genes underlying yield-related traits.Front Plant Sci. 2023 Aug 11;14:1229495. doi: 10.3389/fpls.2023.1229495. eCollection 2023. Front Plant Sci. 2023. PMID: 37636105 Free PMC article.
-
Identification of potential auxin response candidate genes for soybean rapid canopy coverage through comparative evolution and expression analysis.Front Plant Sci. 2024 Oct 3;15:1463438. doi: 10.3389/fpls.2024.1463438. eCollection 2024. Front Plant Sci. 2024. PMID: 39421145 Free PMC article.
-
Assessing population structure and morpho-molecular characterization of sunflower (Helianthus annuus L.) for elite germplasm identification.PeerJ. 2024 Oct 31;12:e18205. doi: 10.7717/peerj.18205. eCollection 2024. PeerJ. 2024. PMID: 39494282 Free PMC article.
References
-
- Pembele Ibanda A, Karungi J, Malinga GM, Adjumati Tanzito G, Ocan D, Badji A, et al. Influence of environment on soybean [Glycine max (L.) Merr.] resistance to groundnut leaf miner, Aproaerema modicella (Deventer) in Uganda. Journal of Plant Breeding and Crop Science. 2018;10(12):336–46. 10.5897/JPBCS2018.0764. - DOI
-
- Kumar SJ, Kumar A, Ramesh K, Singh C, Agarwal DK, Pal G, et al. Wall bound phenolics and total antioxidants in stored seeds of soybean (Glycine max) genotypes. Indian Journal of Agricultural Sciences. 2020;90:118–222.
-
- Hartman GL, Hill CB. 13 Diseases of Soybean and Their Management. The soybean: botany, production and uses: CABI Publishing Cambridge, USA; 2010.
-
- Singh G. The soybean: botany, production and uses: CABI; 2010.
-
- Gupta S, Manjaya J. Genetic diversity and population structure of Indian soybean [Glycine max (L.) Merr.] revealed by simple sequence repeat markers. Journal of Crop Science and Biotechnology. 2017;20(3):221–31. 10.1007/s12892-017-0023-0. - DOI
MeSH terms
LinkOut - more resources
Full Text Sources
Research Materials

