. 2023 May 31;15(698):eabn0736.
doi: 10.1126/scitranslmed.abn0736. Epub 2023 May 31.

Indian Hedgehog release from TNF-activated renal epithelia drives local and remote organ fibrosis

Affiliations

Indian Hedgehog release from TNF-activated renal epithelia drives local and remote organ fibrosis

Eoin D O'Sullivan et al. Sci Transl Med. .

Abstract

Progressive fibrosis is a feature of aging and chronic tissue injury in multiple organs, including the kidney and heart. Glioma-associated oncogene 1 expressing (Gli1+) cells are a major source of activated fibroblasts in multiple organs, but the links between injury, inflammation, and Gli1+ cell expansion and tissue fibrosis remain incompletely understood. We demonstrated that leukocyte-derived tumor necrosis factor (TNF) promoted Gli1+ cell proliferation and cardiorenal fibrosis through induction and release of Indian Hedgehog (IHH) from renal epithelial cells. Using single-cell-resolution transcriptomic analysis, we identified an "inflammatory" proximal tubular epithelial (iPT) population contributing to TNF- and nuclear factor κB (NF-κB)-induced IHH production in vivo. TNF-induced Ubiquitin D (Ubd) expression was observed in human proximal tubular cells in vitro and during murine and human renal disease and aging. Studies using pharmacological and conditional genetic ablation of TNF-induced IHH signaling revealed that IHH activated canonical Hedgehog signaling in Gli1+ cells, which led to their activation, proliferation, and fibrosis within the injured and aging kidney and heart. These changes were inhibited in mice by Ihh deletion in Pax8-expressing cells or by pharmacological blockade of TNF, NF-κB, or Gli1 signaling. Increased amounts of circulating IHH were associated with loss of renal function and higher rates of cardiovascular disease in patients with chronic kidney disease. Thus, IHH connects leukocyte activation to Gli1+ cell expansion and represents a potential target for therapies to inhibit inflammation-induced fibrosis.


Conflict of interest statement

JVB is an advisor with equity in Oisin Biotherapeutics, an advisor to Serepta, Stugen and Sareptou, and has been a consultant to Janssen and AstraZeneca. JVB is an inventor on KIM-1 patents that are assigned to MassGeneralBrigham. DAF has received research funding from Argenx, undertaken consultancy work for Rejuvenon Life Sciences and is on the scientific advisory board of Dorian Therapeutics. All other authors have no competing interests.

Figures
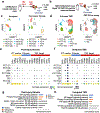
Figure 1.
Figure 1.. Identification of inflammatory proximal tubular cells in injured and aging mouse kidneys.
(A-B) Schema of single cell analyses of renal epithelia performed in young murine kidneys with fibrosis 42 days post ischemia reperfusion injury (A, n=3/group) and healthy young and aged kidneys from the Tabula Muris Senis (TMS) dataset (B, total n=14, n=2–4/timepoint). (C-D, PCT – proximal convoluted tubule, LoH – loop of Henle, CD – collecting duct, IC – intercalated cell, iPT – inflammatory proximal tubule). Analysis using Seurat demonstrated additional clusters absent from healthy young epithelia but present in previously injured kidneys (C) and aged kidneys (D) indicated by black circles on each Uniform Manifold Approximation and Projection (UMAP) plot. (E-F) A subset of cell identity, fibrosis and TNF signaling related genes are shown for injured kidneys (E), and aged kidneys (F). Over representation analysis (ORA) of the inflammatory proximal tubule cluster is shown in previously injured kidneys (G) and aged kidneys (H). Blue bars indicate analyses from KEGG enrichment, orange indicates Wikipathway enrichment and grey indicates Reactome enrichment. False discovery rate <0.05.
Figure 2.
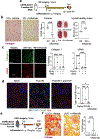
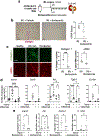
Figure 2.. Profibrotic inflammatory proximal tubular cells increase in response to TNF in mice in vivo.
(A) Schema of TNF inhibition studies using Infliximab (10mg/kg) after unilateral IRI (n=8/group). (B) %Picrosirius Red (PSR) staining for renal fibrosis after ischaemic injury, including the ratio of weights of the injured kidney relative to the contralateral uninjured kidney (IRI:CLK weight ratio:n=8/group, unpaired t-test). (C) Immunofluorescence staining and quantification of Collagen I deposition (green) and αSMA+ myofibroblast expansion (red) after uIRI (n=7–8/group, one way ANOVA with Tukey’s test) (D) ISH and quantification of Ubd+ iPT cells in uIRI kidney (Blue=DAPI, Red=Ubd, Green=Col1a1, n=8/group, Kruskal-Wallis test). I Schema of Infliximab studies with unilateral ureteric obstruction in aged mice (n=6–7/group). (F) PSR staining and quantification of fibrosis after UUO in aged mice (n=6–7/group, unpaired t-test). Scale bars: 100microns (B-C), 50microns (E), 10microns (D). Each image is representative of image acquisition and analysis performed from all experimental subjects. *p<0.05, **p<0.01, ***p<0.001, ****p<0.0001.
Figure 3.
Figure 3.. Profibrotic inflammatory proximal tubular activation is inhibited by blockade of NFκB signalling.
(G) Schematic of Bortezomib studies after uIRI in the murine kidney (H) PSR staining of kidney tissue after IRI ± Bortezomib treatment (n=6–8/group, unpaired t-test) (I) Immunofluorescence staining and quantification of Collagen I deposition and αSMA+ myofibroblast expansion after uIRI (n=6–8/group, unpaired t and Mann-Whitney tests). (J) mRNA expression of Icam1, Sox9, Ihh, Tgfb1 and Col1a1 after injury, normalized to housekeeping genes and expressed relative to naïve, vehicle treated kidneys (n=12–14/group, ANOVA with Tukey’s test or Kruskal-Wallis test). (K) mRNA expression of Icam1, Ihh, Col1a1 and Ubd after injury, normalized to housekeeping genes and expressed relative to naïve, vehicle treated kidneys (n=6–8/group, ANOVA, Kruskal-Wallis and unpaired t-tests). Scale bars: 100microns (A). Each image is representative of image acquisition and analysis performed from all experimental subjects. *p<0.05, **p<0.01, ***p<0.001, ****p<0.0001.
Figure 4.
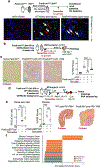
Figure 4.. Indian Hedgehog is associated with renal fibrosis in mice and humans.
(A) Schema of breeding strategy used to generate Pax8-creERT2; Ihhfl/fl mice and confocal images of Col1a1, Ubd and Ihh transcripts in healthy and injured kidneys from wild-type (WT) and Pax8-creERT2; Ihhfl/fl transgenic (TG) mice. White arrows: Ubd transcripts. Red arrows: Ihh transcripts. Blue staining represents nuclei (DAPI). (B) Schema of experiments testing the Ihh deletion in unilateral ureteric obstruction in mice. (C) Picrosirius Red staining and %PSR in Pax8-creERT2; Ihhfl/fl mice after UUO (n=8/group, ANOVA with Sidak’s test). (D) Schematic of experiments using Pax8-creERT2; Ihhfl/fl mice to test the role of Ihh during renal uIRI. (E) Quantification of kidney mass and fibrosis (%PSR) in Pax8-creERT2; Ihhfl/fl mice with representative images (right) post uIRI (n=4–9/group, ANOVA with Tukey’s test, and Kruskal-Wallis tests) (F) Over-representation analysis illustrates up and downregulated pathways in Ihh deleted kidneys post-uIRI. Orange = Wikipathway, Grey = Reactome, Pink = Panther. Scale bars: 100microns (C), 10 microns (A): Each image is representative of image acquisition and analysis performed from all experimental subjects. *p<0.05, **p<0.01, ***p<0.001, ****p<0.0001.
Figure 5.
Figure 5.. iPT cells and circulating IHH are increased in human chronic kidney disease
(A) Schema of studies in human tissue looking for evidence of iPT cells in human ageing and CKD. ISH for UBD (red arrows to red dots) and IHH (grey arrows to green dots) mRNA in aged (>75 years old) and diseased (IgA nephropathy) human kidneys. (B) Serum IHH, renal functional loss and cardiovascular disease in patients with high and low risk CKD (n=7–18/group, Mann-Whitney tests). Scale bars: 10 microns (A): Each image is representative of image acquisition and analysis performed from all experimental subjects. *p<0.05, **p<0.01, ***p<0.001, ****p<0.0001.
Figure 6.
Figure 6.. Pharmacological modulation of TNF and IHH signalling regulates renal fibrosis in mice.
(A) Schema of experiments for Smoothened Agonist (SAG) administration in healthy young mice. (B) Images of Picrosirius Red staining and quantification of collagen (fibrosis) in the kidney and perivascular regions of the heart after SAG (n=8/group, unpaired t-test and Mann-Whitney tests). (C) Schema of experiments examining GANT61 treatment in Gli1-Cre TdTomato reporter mice with uIRI. (D) PSR staining and quantification of fibrosis after uIRI in the presence and absence of GANT61 (n=7–10/group, ANOVA with Tukey’s test). (E) Fluorescent imaging and quantification of TdTomato+ labelled Gli1+ derived cells in mouse kidney after IRI and GANT61 treatment. (n=6–7/group, Kruskal-Wallis test). DAPI (blue) denotes nuclei. (F) Schematic of experiments testing renal epithelial Ihh deletion and GANT61 or Infliximab treatment in mice with bilateral renal IRI. (G) Representative images of Picrosirius red staining of collagen in post-bIRI kidneys ± treatment. (H) Quantification of PSR fibrosis seen in panel H (n=7–8/group, Kruskal-Wallis test). Scale bars: 100microns. (I). Quantification of serum Cystatin C levels (n=7–8/group, ANOVA with Sidak’s test). Each image is representative of image acquisition and analysis performed from all experimental subjects. *p<0.05, **p<0.01, ***p<0.001, ****p<0.0001.
Figure 7.
Figure 7.. Inhibition of Ihh signaling limits perivascular cardiac fibrosis and Gli1+ cell expansion after uIRI in mice.
(A) Schematic of experiments to examine cardiac fibrosis after conditional deletion of Ihh in Pax8-creERT2; Ihhfl/fl mice after renal uIRI. (B) Quantification of blood pressure, cardiac weight/tibia length and perivascular cardiac fibrosis after uIRI (n=4–10/group, ANOVA with Tukey’s or Dunnett’s or Kruskal Wallis tests) Quantification of fibrosis based on Picrosirius Red staining (representative images on right). (C) Schematic of experiments with Gli1-Cre TdTomato reporter mice and GANT61 treatment to examine contralateral kidneys and hearts after nephrectomy or uIRI. (D) Images and quantification of Picrosirius Red in the contralateral kidney after uIRI or nephrectomy (n=6–10/group, Kruskal-Wallis Test). (E) Images and quantification of Picrosirius Red in the heart after kidney injury (n=6–7/group, ANOVA with Dunnett’s test). (F) Imaging and quantification of Gli1+ derived cells using AF488-conjugated antibody labelling in the heart after renal uIRI compared to nephrectomy alone (n=4–7/group, ANOVA with Dunnett’s test, white arrows indicate cells derived from cells expressing Gli at the time of recombination). Scale bars: 100microns. n=6–10/group with each image representative of image acquisition and analysis performed from all experimental subjects. *p<0.05, **p<0.01.

Comment in

References

    1. Hearps AC, Martin GE, Angelovich TA, Cheng WJ, Maisa A, Landay AL, Jaworowski A, Crowe SM, Aging is associated with chronic innate immune activation and dysregulation of monocyte phenotype and function. Aging cell 11, 867–875 (2012). - PubMed
    1. Santos Morais G Junior, Ignacio Valenzuela Perez D, Cecilia Tonet-Furioso A, Gomes L, Coelho Vilaca KH, Paulo Alves V, Franco Moraes C, Toledo Nobrega O, Circulating Interleukin-6 (but Not Other Immune Mediators) Associates with Criteria for Fried’s Frailty among Very Old Adults. J Aging Res 2020, 6831791 (2020). - PMC - PubMed
    1. Gencer S, Evans BR, van der Vorst EPC, Doring Y, Weber C, Inflammatory Chemokines in Atherosclerosis. Cells 10, (2021). - PMC - PubMed
    1. Kurts C, Panzer U, Anders HJ, Rees AJ, The immune system and kidney disease: basic concepts and clinical implications. Nat Rev Immunol 13, 738–753 (2013). - PubMed
    1. Sato Y, Yanagita M, Immunology of the ageing kidney. Nat Rev Nephrol 15, 625–640 (2019). - PubMed

Publication types