. 2023 May 31;15(698):eade8732.
doi: 10.1126/scitranslmed.ade8732. Epub 2023 May 31.

Gene-edited and -engineered stem cell platform drives immunotherapy for brain metastatic melanomas

Affiliations

Gene-edited and -engineered stem cell platform drives immunotherapy for brain metastatic melanomas

Nobuhiko Kanaya et al. Sci Transl Med. .

Erratum in

Abstract

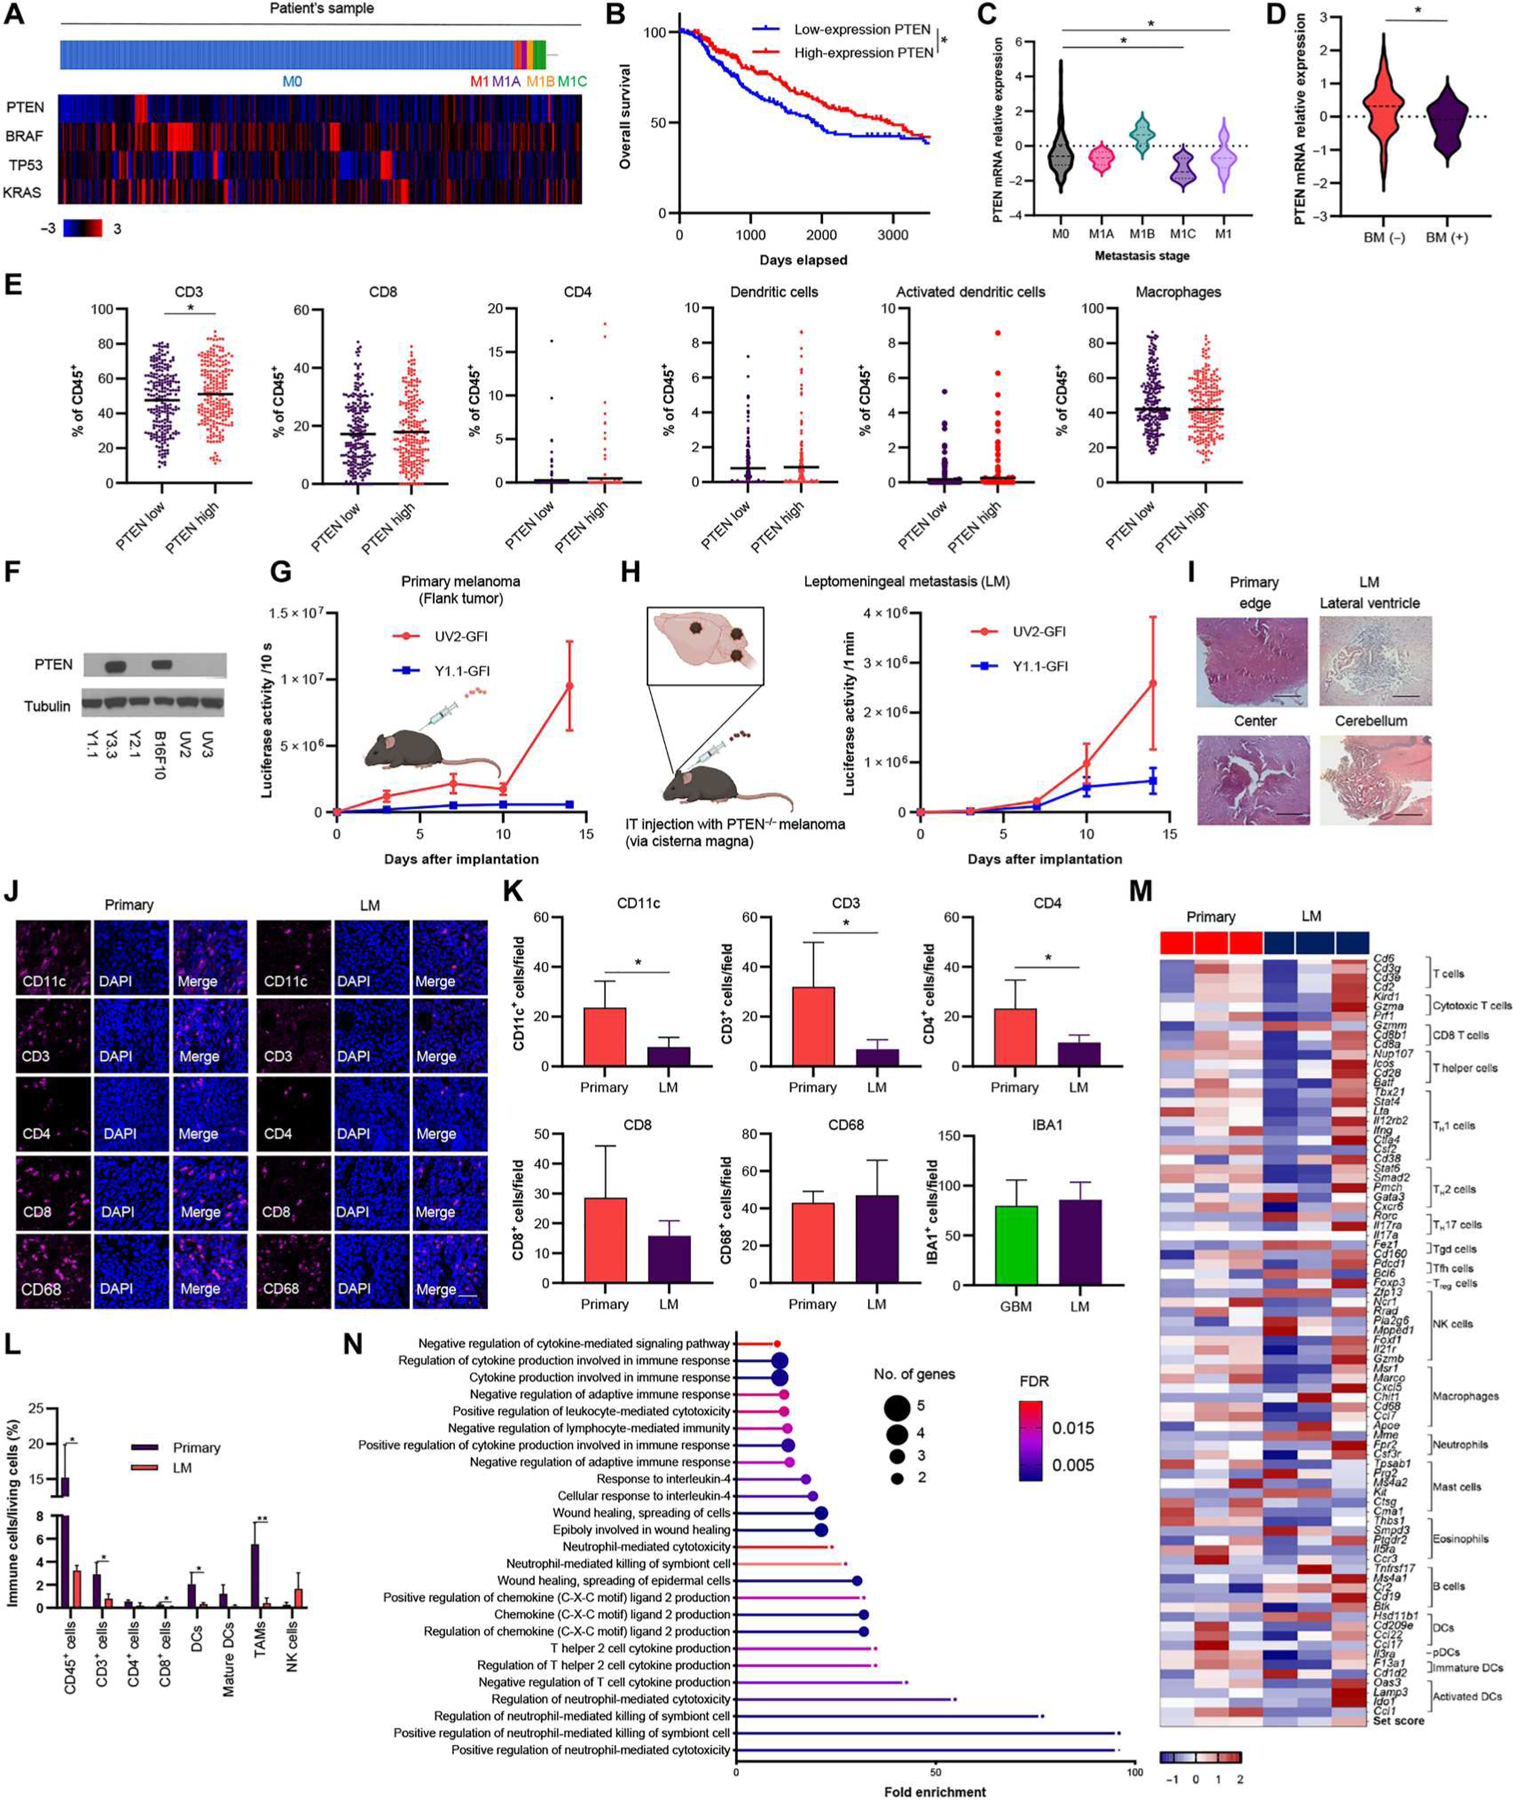
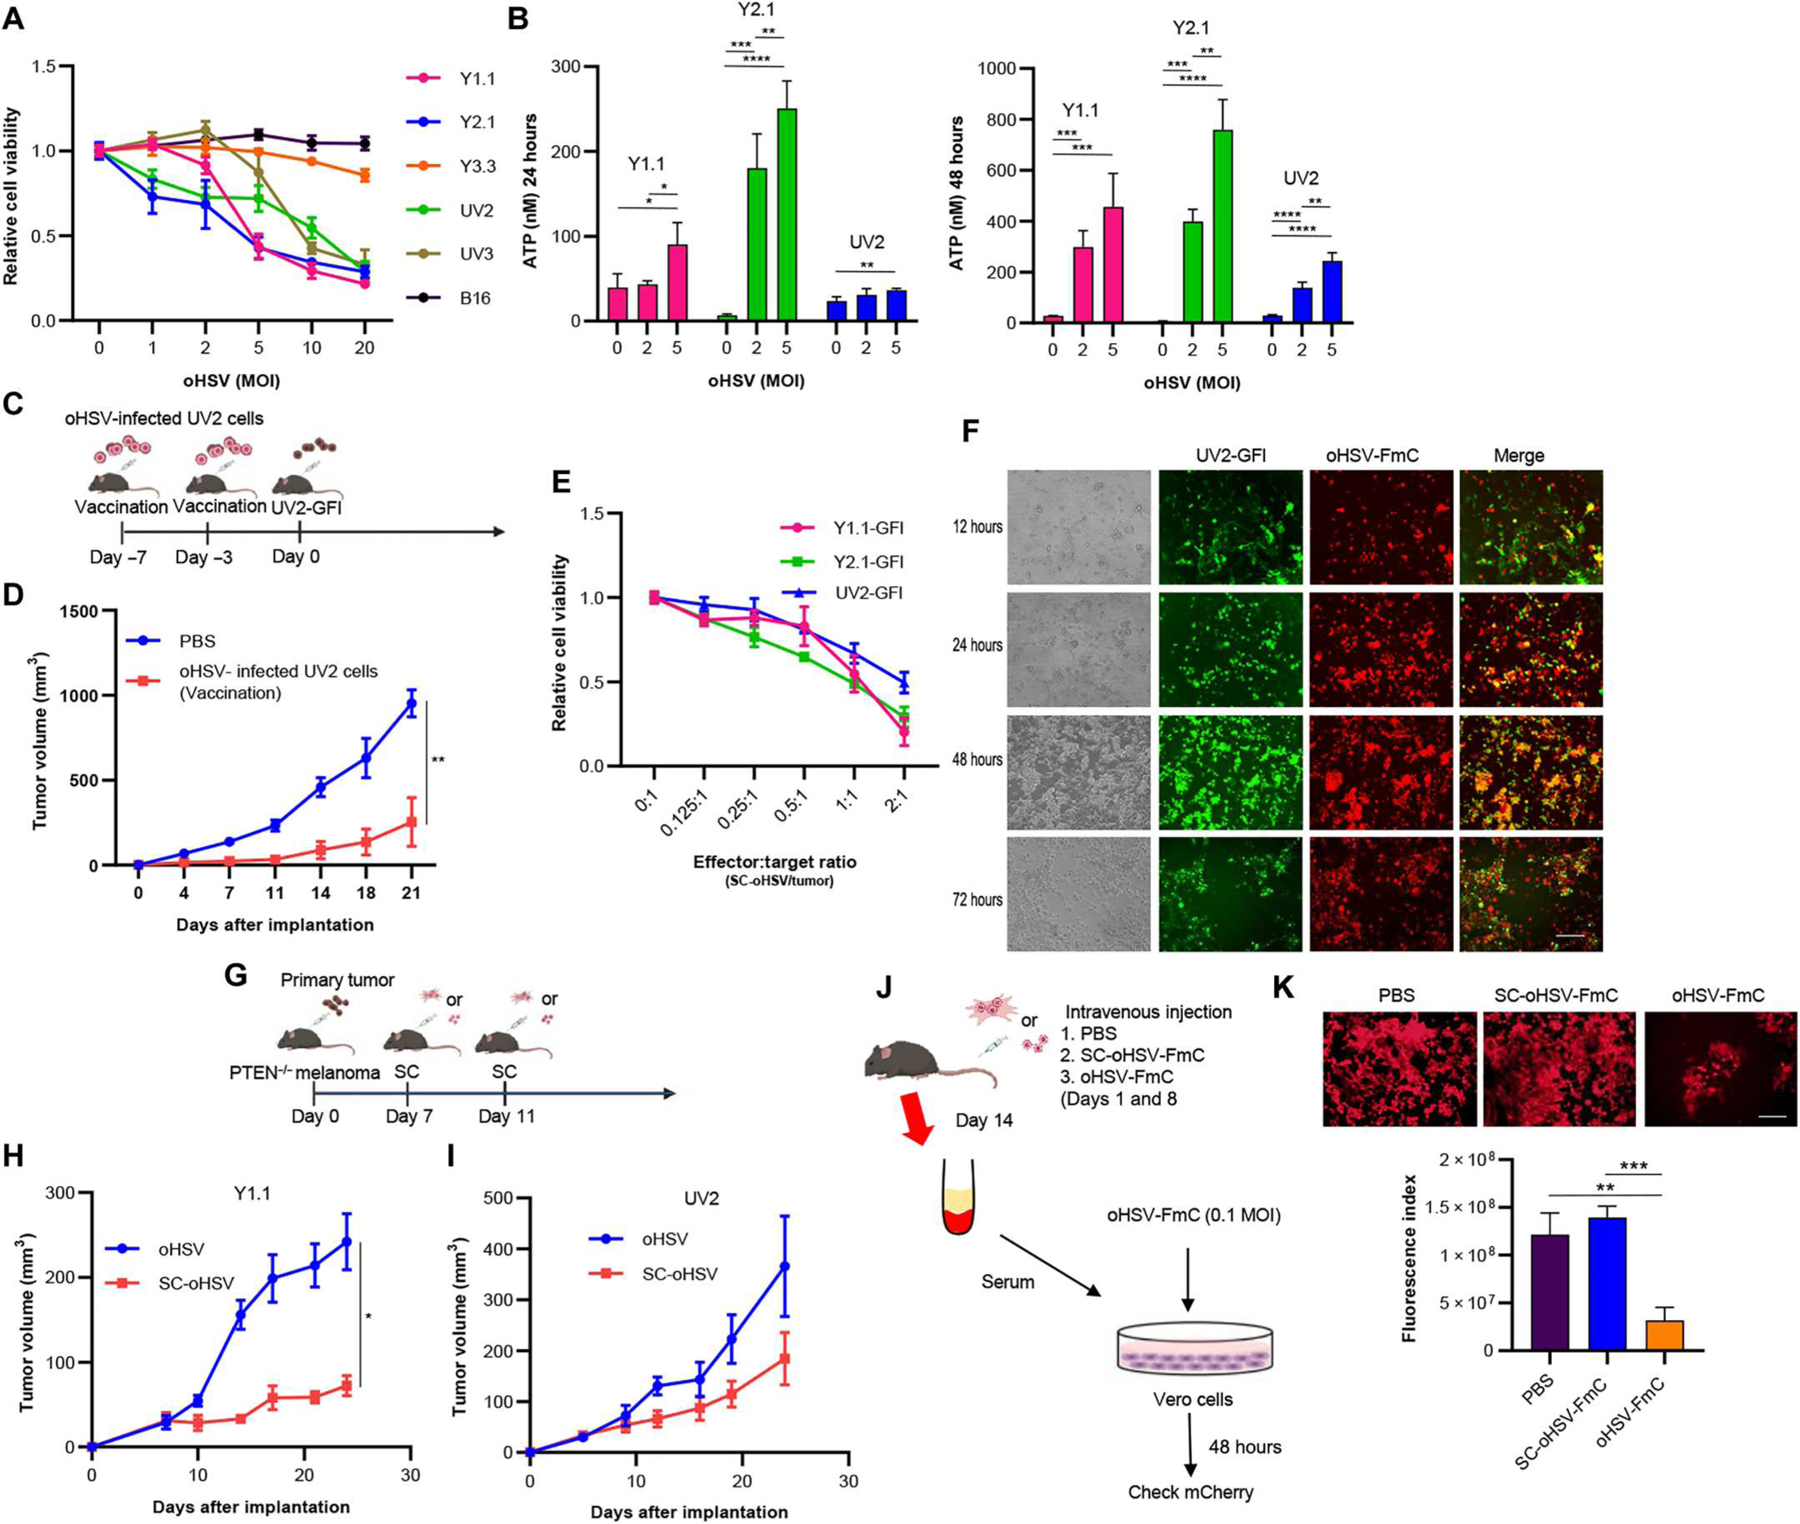
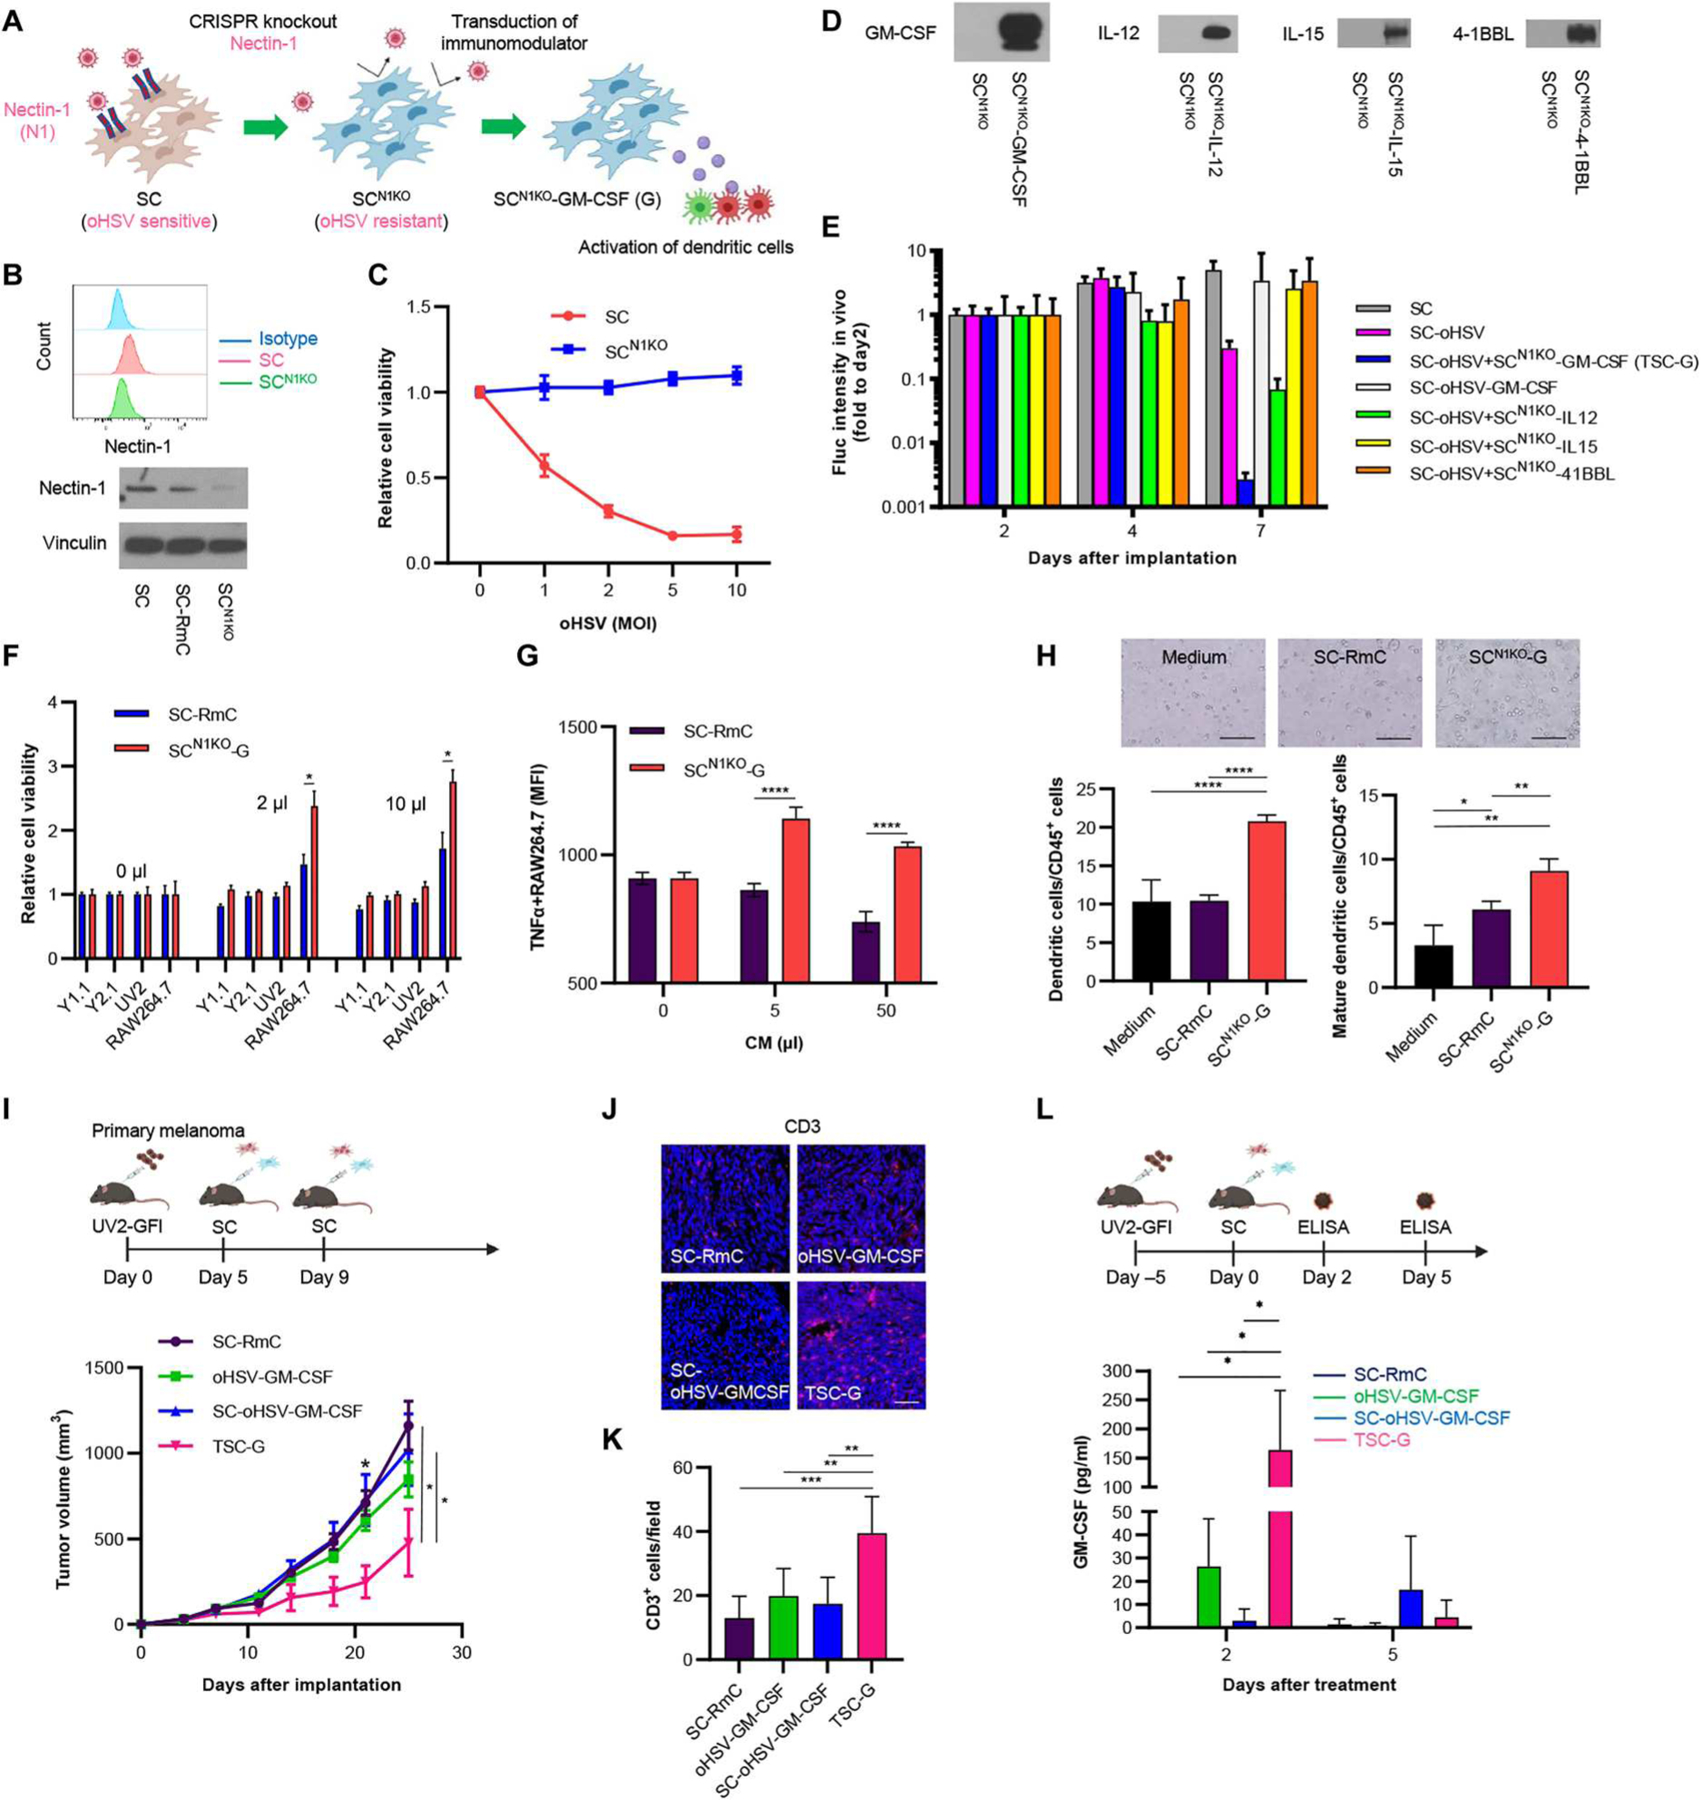
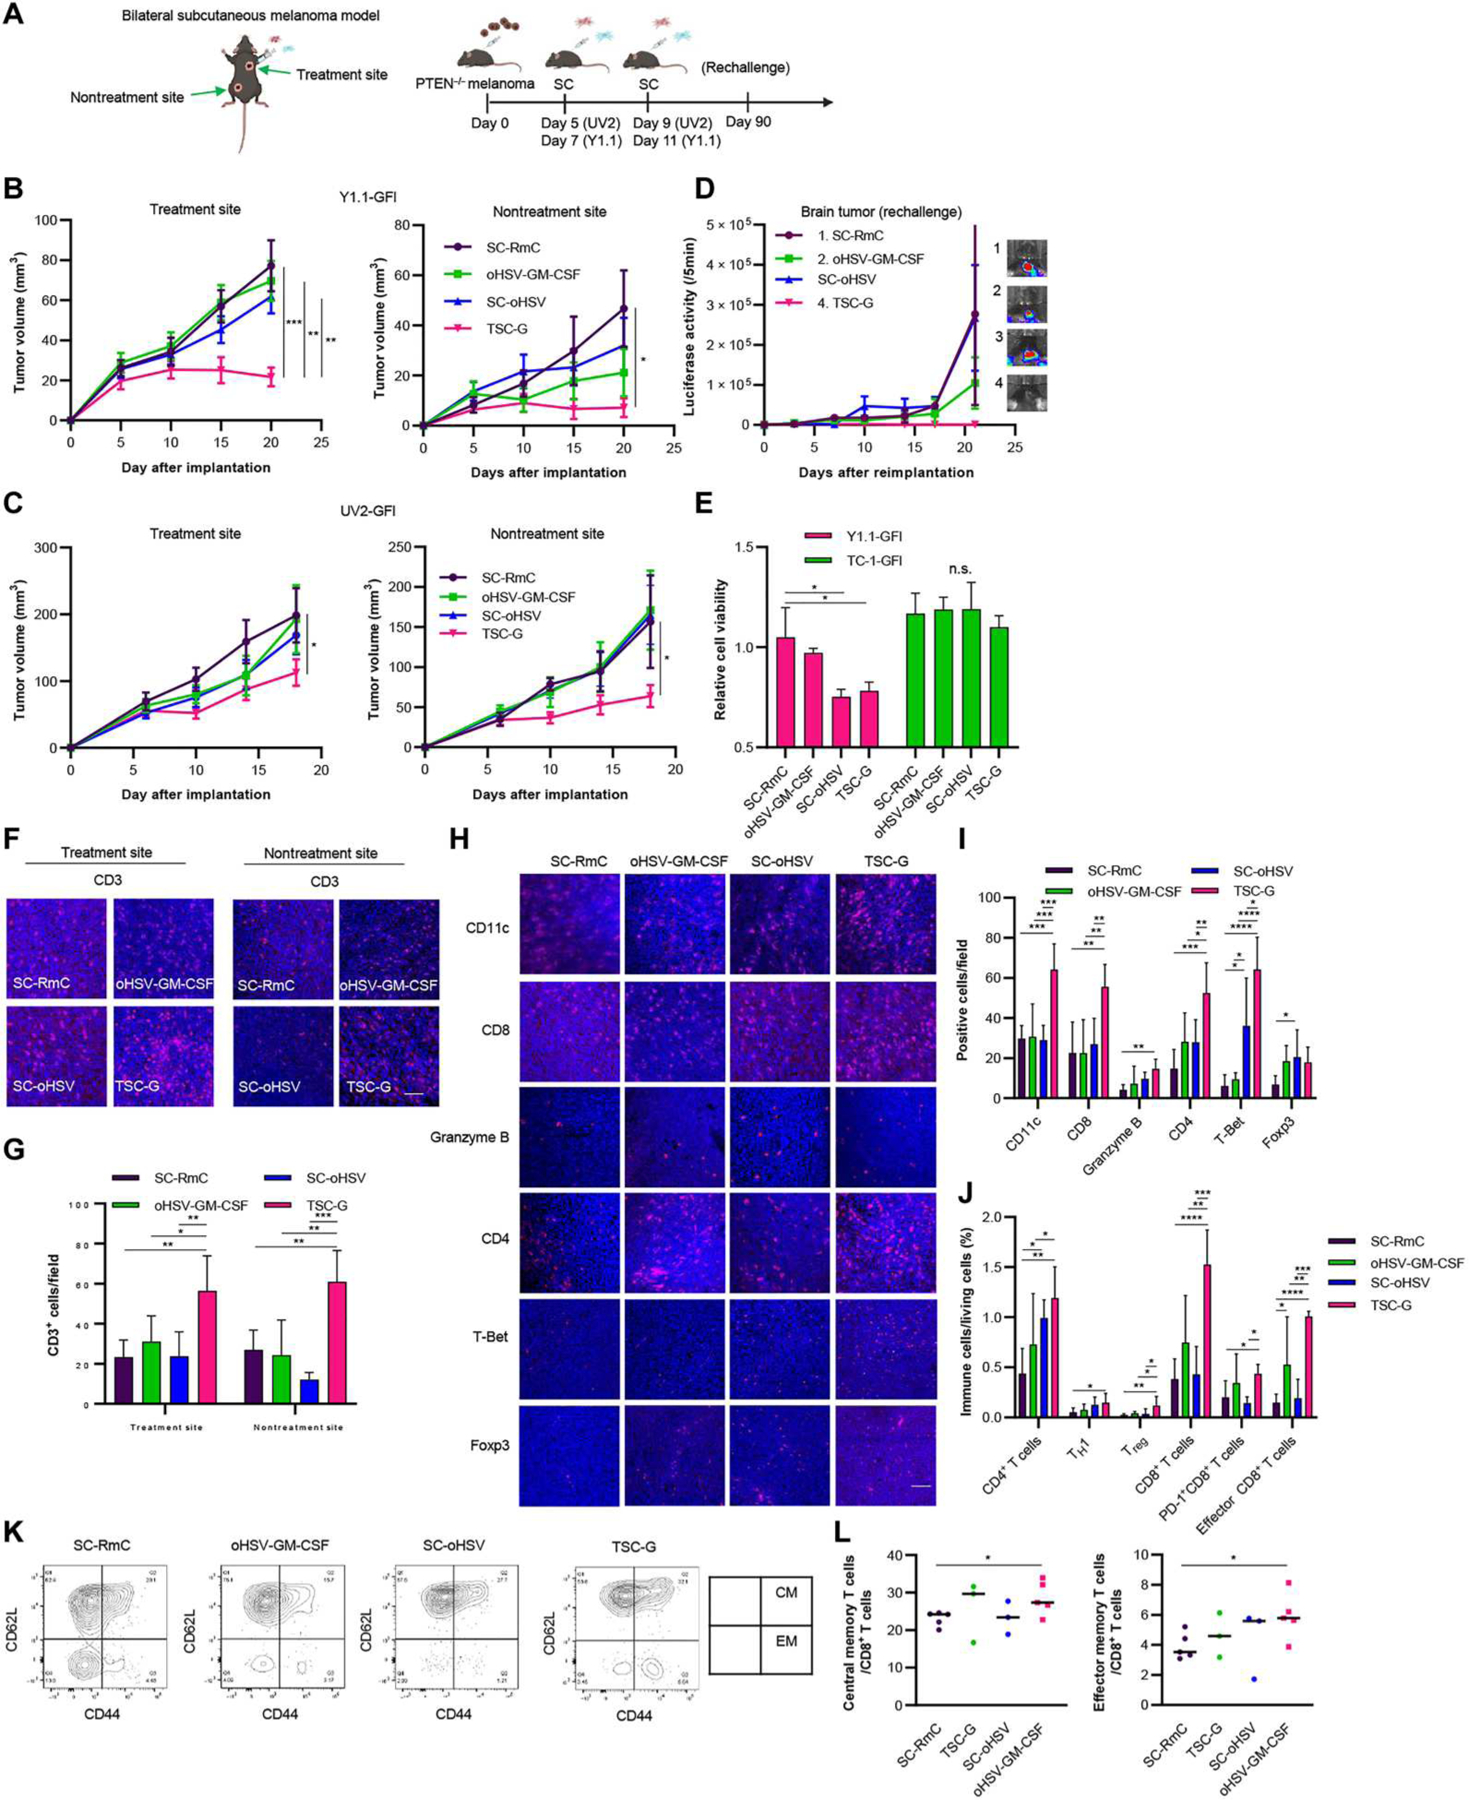
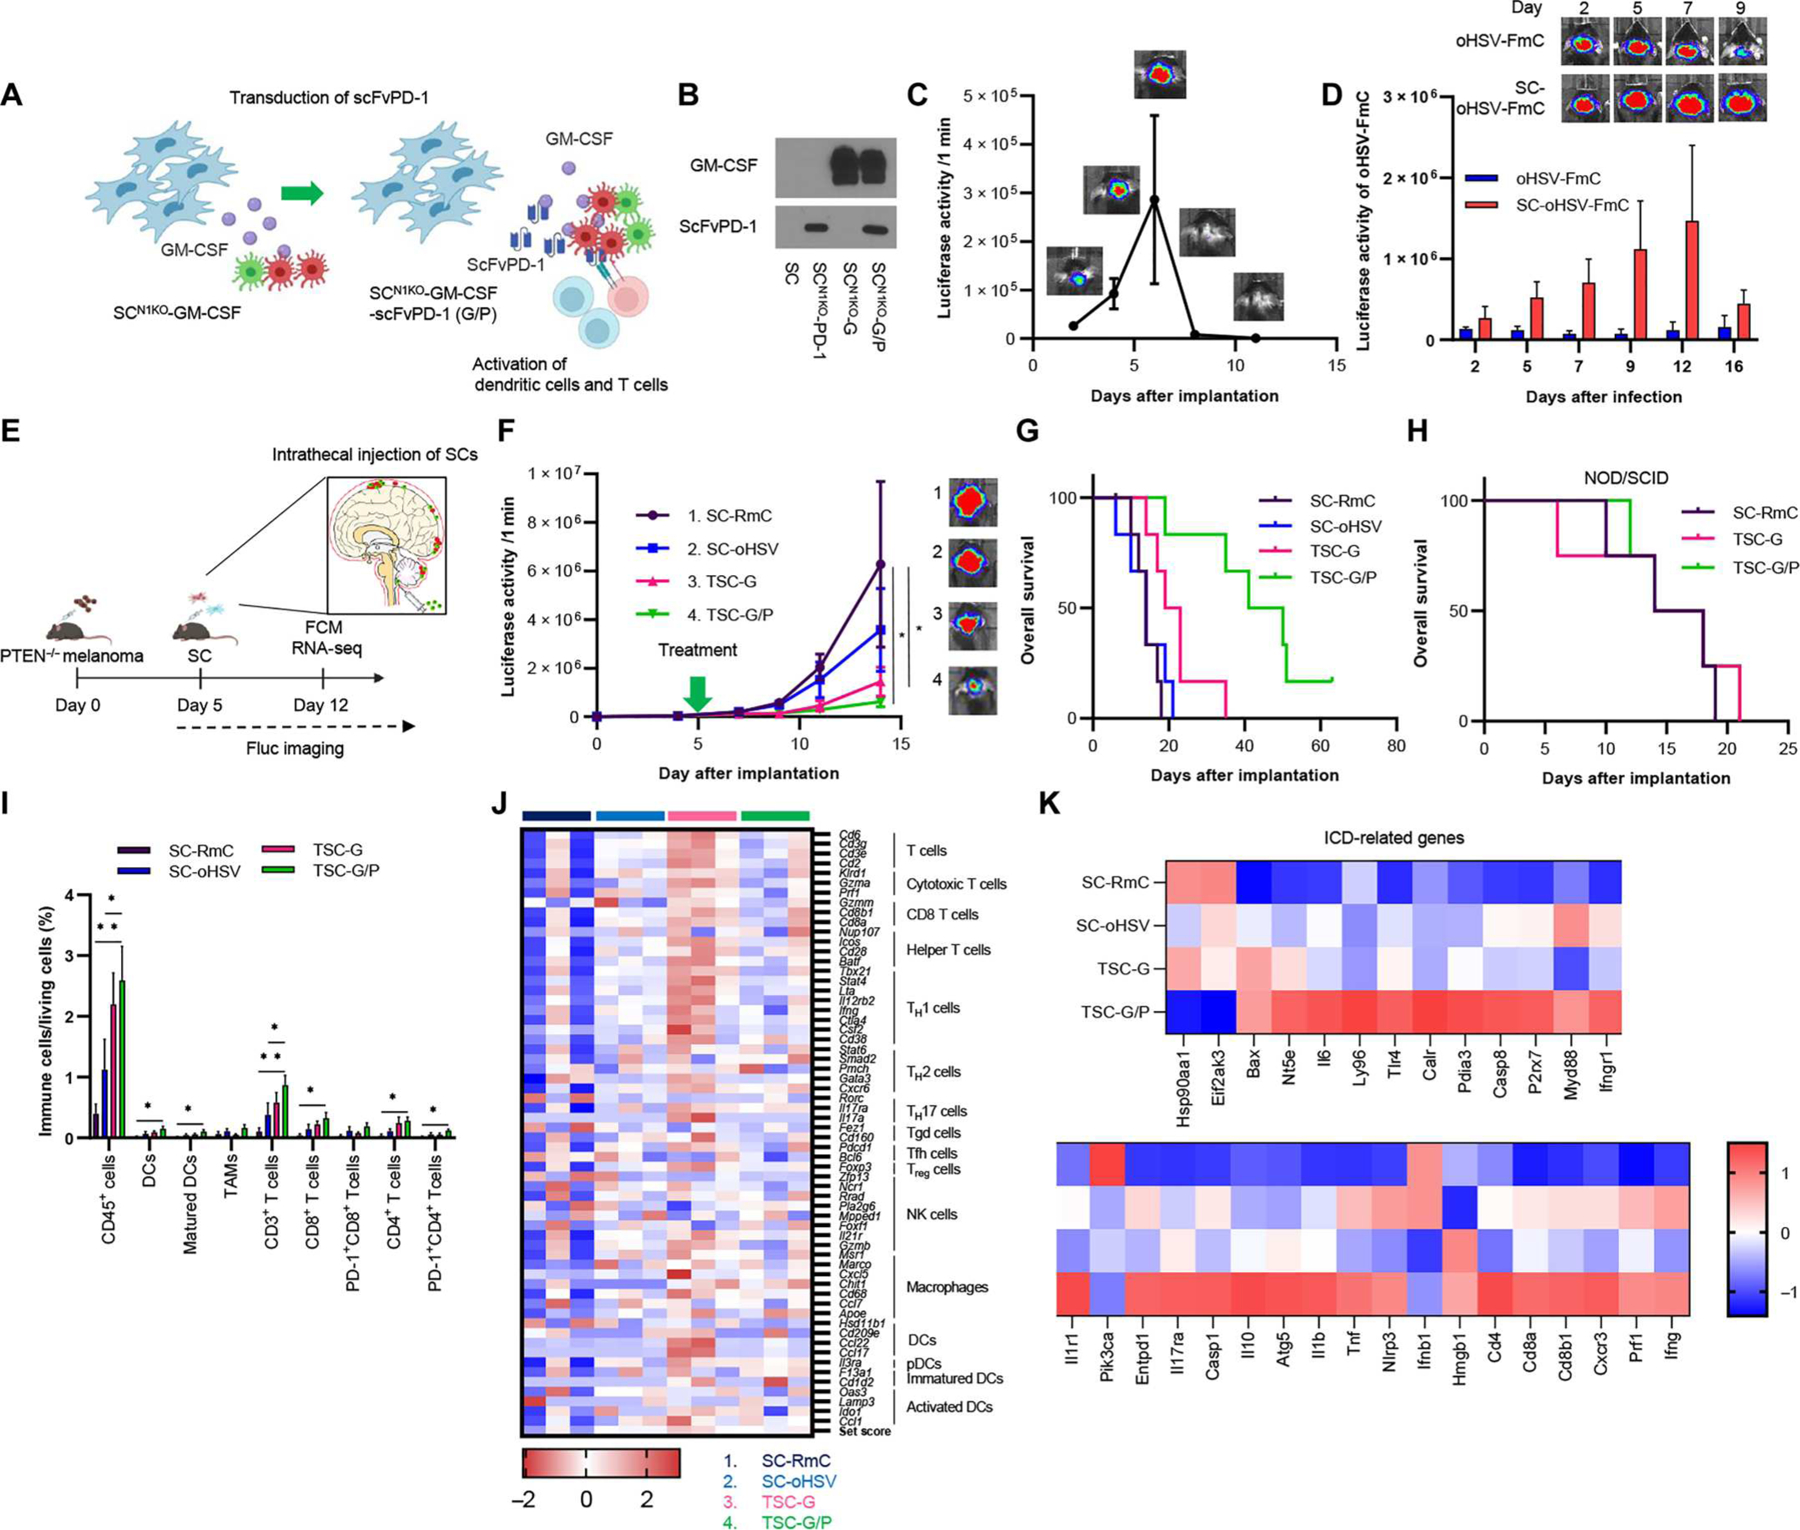
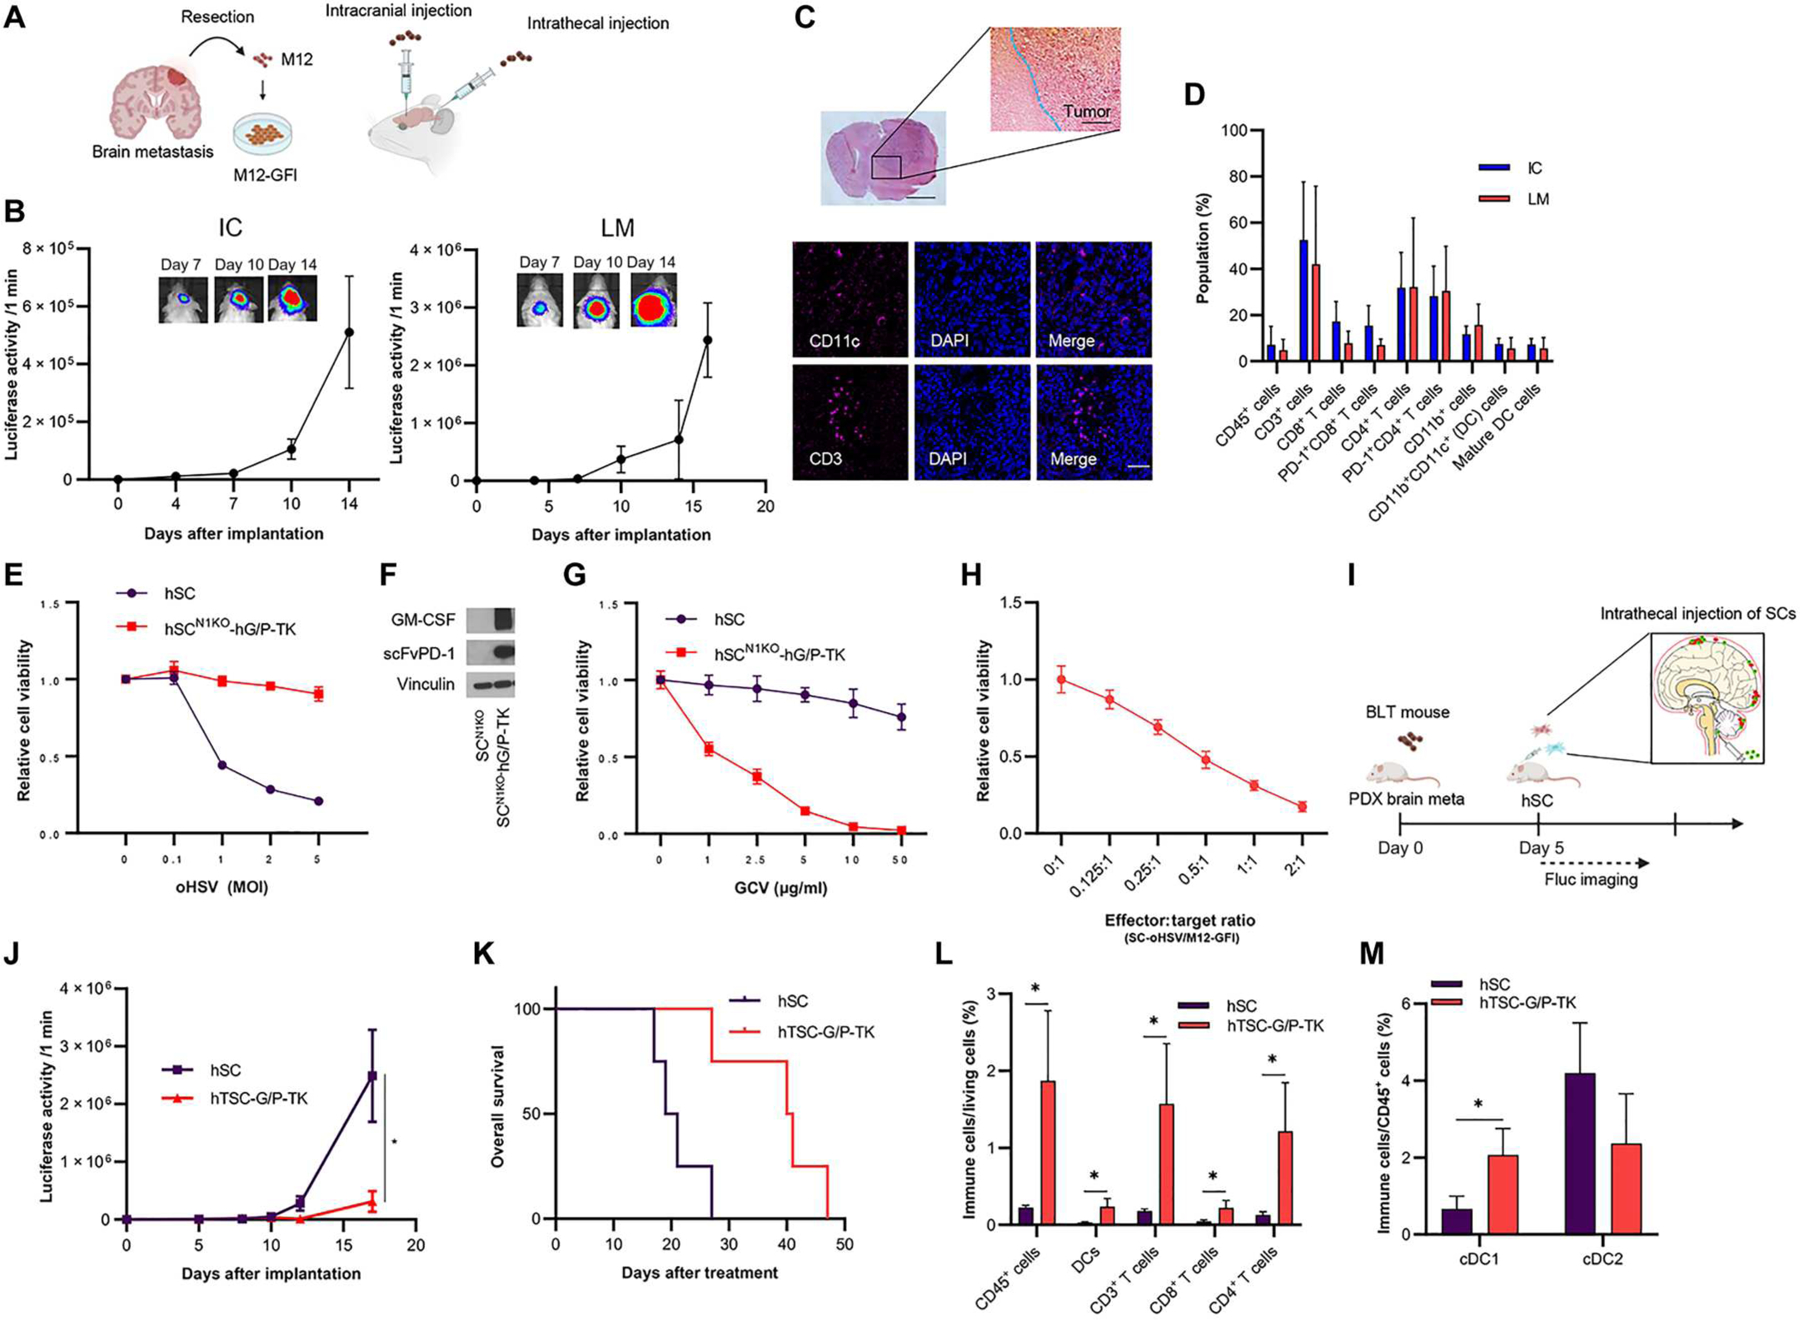
Oncolytic virus therapy has shown activity against primary melanomas; however, its efficacy in brain metastases remains challenging, mainly because of the delivery and immunosuppressive nature of tumors in the brain. To address this challenge, we first established PTEN-deficient melanoma brain metastasis mouse models and characterized them to be more immunosuppressive compared with primary melanoma, mimicking the clinical settings. Next, we developed an allogeneic twin stem cell (TSC) system composed of two tumor-targeting stem cell (SC) populations. One SC was loaded with oncolytic herpes simplex virus (oHSV), and the other SC was CRISPR-Cas9 gene-edited to knock out nectin 1 (N1) receptor (N1KO) to acquire resistance to oHSV and release immunomodulators, such as granulocyte-macrophage colony-stimulating factor (GM-CSF). Using mouse models of brain metastatic BRAFV600E/PTEN-/- and BRAFV600E/wt/PTEN-/- mutant melanomas, we show that locoregional delivery of TSCs releasing oHSV and GM-CSF (TSC-G) activated dendritic cell- and T cell-mediated immune responses. In addition, our strategy exhibited greater therapeutic efficacy when compared with the existing oncolytic viral therapeutic approaches. Moreover, the TSCs composed of SC-oHSV and SCN1KO-releasing GM-CSF and single-chain variable fragment anti-PD-1 (TSC-G/P) had therapeutic efficacy in both syngeneic and patient-derived humanized mouse models of leptomeningeal metastasis. Our findings provide a promising allogeneic SC-based immunotherapeutic strategy against melanomas in the CNS and a road map toward clinical translation.


Conflict of interest statement

Competing interests: K.S. owns equity in and is a member of the Board of Directors of AMASA Therapeutics, a company developing stem cell–based therapies for cancer. D.F. has a financial interest in Soltego. K.S.’s and D.F.’s interests were reviewed by Brigham and Women’s Hospital and Mass General Brigham in accordance with their conflict-of-interest policies. The other authors declare that they have no competing interests. The patent application entitled “Gene editing and engineering stem cell for drug delivery” (PCT/US22/49523) has been filed.

Figures

Fig. 1.
Fig. 1.. PTEN deficiency is correlated with MBM and immune suppression.
(A) Heatmap of mRNA expression of PTEN, BRAF, TP53, and KRAS in patient samples of metastatic stage from the TCGA database (n = 337). M0, no distant metastasis; M1, distant metastasis (unknown lesions); M1A, distant skin metastasis; M1B, lung metastasis; M1C, other distant metastasis including brain mRNA expression z scores relative to all samples (≧1.5) was defined as positive expression. (B) Kaplan-Meier curves of overall survival for high PTEN melanoma and low PTEN melanoma of patients from TCGA (the threshold cutoff was median). *P < 0.05. (C) Comparison of PTEN expression between metastatic stages from the TCGA database. *P < 0.05. (D) Comparison of PTEN expression in BM and other metastasis (n = 144) from the dbGaP study (phs000452.v3.p1). *P < 0.05. (E) Immune profile analysis of high–PTEN expression melanoma and low–PTEN expression melanoma from the TCGA database. *P < 0.05. (F) Western blotting of PTEN and tubulin in six murine melanoma cell lines. (G) Schematic of primary melanoma mouse models. BLI signal curve of primary UV2-GFl (n = 4)– or Y1.1-GFl (n = 3)–bearing mice. Data are presented as means + SEM. BLI, bioluminescence imaging. (H) Schematic of leptomeningeal metastasis (LM) mouse models (left). BLI signal curve of flank and IT-injected UV2-GFl (n = 3)– or Y1.1-GFl (n = 3)–bearing mice (right). Data are presented as means + SEM. (I) Representative hematoxylin and eosin (H&E) staining of primary melanoma (edge and central area) and LM mouse model (lateral ventricle and cerebellum area). Scale bar, 100 μm. (J) IF analysis of CD11c, CD3, CD4, CD8, and CD68 in UV2-GFl primary (n = 4) and LM (n = 3) mouse models. Scale bar, 6 mm. (K) Mean number of TILs expressing CD11c, CD3, CD4, CD8, CD68, and IBA1 was statistically assessed from three selected fields. IBA1 was compared with UV2-GFl LM– and glioblastoma (GBM) (CT2A-mCherry-Fluc)–bearing mice (n = 3 per group). Data are presented as means + SD. *P < 0.05. (L) Flow cytometry showing the difference of immune profiles between UV2-GFI primary (n = 4) and LM (n = 3) mouse models. Data are presented as means + SD. *P < 0.05 and **P < 0.01. (M) Heatmap of differential expression of genes associated with immune cell types in UV2-GFI flank and LM melanoma plotted as z score of normalized gene expression for each gene. (N) GO analysis for down-regulated immune-related pathway enrichment [UV2-GFI primary (n = 3) versus LM (n = 3) mouse models].
Fig. 2.
Fig. 2.. Stem cells are efficient carriers of oHSV.
(A) Cell viability assay of six melanoma cells was assessed 3 days after oHSV treatment at the indicated doses (MOI) (n = 5 per group, technical replicates). Data are presented as means ± SD. (B) Extracellular ATP secreted from Y1.1, Y2.1, and UV2 cells was measured using a luminescence assay 24 and 48 hours after oHSV treatment (0, 2, and 5 MOI, n = 4 per group). Data are presented as means + SD. *P < 0.05. **P < 0.01, ***P < 0.001, ****P < 0.0001. (C) In the vaccination study, UV2-GFI cells treated with oHSV (5 MOI) for 2 days were administered subcutaneously into the flanks of C57/BL6 mice on days −7 and −3 for vaccination, and UV2-GFI cells (1 × 10⁶ cells) were inoculated subcutaneously on day 0. (D) Tumor volume was monitored and compared between PBS (n = 5) and vaccinated mice (n = 5). Data are presented as means ± SEM. **P < 0.01. (E) PTEN mutant melanoma cells were investigated by cell viability assay 3 days after SC-oHSV treatment in vitro (n = 5 per group, technical replicates). Data are presented as means ± SD. (F) Coculture showing killing of melanoma cells (green) infected with oHSV-FmC (red) released from SCs for 12, 24, 48, and 72 hours, respectively. Scale bar, 100 μm. (G) Experimental design. Y1.1-GFI or UV2-GFl subcutaneous melanoma tumors were treated with oHSV (4 × 10⁵ PFU per mouse) or SC-oHSV (4 × 10⁵ cells per mouse) intratumorally 7 and 11 days after tumor inoculation. Tumor volumes were measured every 3 to 4 days after implantation. (H) Plots showing subcutaneous Y1.1-GFI tumor growth in mice treated with oHSV (n = 8) or SC-oHSV (n = 8). Data are presented as means ± SEM. *P < 0.05. (I) Plots showing subcutaneous UV2-GFI tumor growth in mice treated with oHSV (n = 5) or SC-oHSV (n = 5). Data are presented as means ± SEM. (J) Stealth effect (reduction of antiviral Ab) of SC-oHSV providing protection from the immune system in vivo. Experimental design: PBS, SC-oHSV-FmC, or oHSV-FmC was systemically injected in C57BL/6 mice twice every week (days 1 and 8), and the blood was collected from each mouse at day 14. Vero cells were infected with oHSV-FmC for 2 days with the serum collected from the mice. (K) mCherry spots observed on fluorescence microscopy and the intensity of mCherry spots measured by ImageJ (n = 3 per group). Data are represented as means + SD. Scale bar, 100 μm. **P < 0.01 and ***P < 0.001.
Fig. 3.
Fig. 3.. oHSV-resistant stem cells secreting GM-CSF target DCs and macrophages.
(A) Scheme showing the creation of SCN1KO-expressing immunomodulators. To establish oHSV-resistant SC-GM-CSF, nectin-1 on SCs was deleted by CRISPR-Cas9 gene editing, and SCN1KO was subsequently transduced with GM-CSF. (B) Flow cytometry (FCM, top) and Western blotting (bottom) showing expression of nectin-1 in SCs. (C) Cell viability assays showing SCN1KO resistance to oHSV compared with SCs. Data are presented as means ± SD (n = 5 per group). (D) Expression of immunomodulators in SCN1KO by Western blotting). (E) In vivo screening showing the antitumor activity of SCN1KO-secreting immunomodulators combined with SCs loaded with oHSV in Y1.1-GFI–bearing primary melanoma mouse tumors. Data are presented as means + SEM. (n = 5 per group). (F) Cell viability assays showing the influence of SCN1KO-G and SC-Rluc-mCherry (RmC) on murine macrophages (RAW264.7) and melanoma (Y1.1-GFl, Y2.1-GFl, and UV2-GFl). (n = 5 per group, technical replicates). Data are presented as means + SD. *P < 0.05. (G) Plot showing the effect of SCN1KO-G conditioned medium (CM) on TNF-α–positive RAW264.7 cells by FCM after incubation for 4 days. Data are presented as means + SD (n = 3 per group). ****P < 0.0001. (H) Plot showing the effect of SCN1KO-G CM on differentiation to dendritic cells (DCs) and mature DCs from murine bone marrow cells (CD45+ cells) by FCM after incubation for 4 days (n = 3 or 4 per group). Data are presented as means + SD. Scale bar, 100 μm. *P < 0.05. **P < 0.01, and ****P < 0.0001. (I) Experimental design (top). In brief, in the UV2-GFl subcutaneous melanoma mouse model, the tumor was treated with SC-oHSV and SCN1KO-G intratumorally 5 and 9 days after tumor cell inoculation. Then, tumor volumes were measured every 3 to 4 days after implantation. Plots showing subcutaneous UV2-GFl tumor growth in mice (bottom) treated with control SC-RmC (n = 6), oHSV-GM-CSF (n = 6), SC-oHSV-GM-CSF (n = 7), or SC-oHSV and SCN1KO-G (n = 7). Data are presented as means ± SEM. *P < 0.05. (J) Representative images of immunofluorescence (IF) analysis for CD3+ TILs in tumor tissues harvested 30 days after UV2-GFl tumor cell inoculation. Scale bar, 6 μm. (K) Mean number of TILs expressing CD3 was statistically assessed from three selected fields as represented in (J) (n = 5 per group). Data are presented as means + SD. **P < 0.01 and ***P < 0.001. (L) In vivo concentrations of GM-CSF after treatment with SC-RmC (n = 3), oHSV-GM-CSF (n = 3 or 4), SC-oHSV-GM-CSF (n = 3), or SC-oHSV and SCN1KO-G (n = 4). The tumors were collected on days 2 and 5 after treatment. Data are presented as means + SD. *P < 0.05.
Fig. 4.
Fig. 4.. TSC-G therapy generates systemic immunity against bilateral flank PTEN-deficient melanoma in vivo.
(A) Experimental design. In brief, in the bilateral Y1.1-GFl and UV2-GFl subcutaneous melanoma mouse model, one tumor was treated with SC-oHSV and SCN1KO-GM-CSF (TSC-G) intratumorally twice starting 5 days after inoculation, and the other tumor was left untreated. Tumor volumes were measured every 3 to 5 days after implantation. (B) Plots showing subcutaneous Y1.1-GFl tumor growth in mice treated with control RmC (n = 7), oHSV-GM-CSF (n = 7), SC-oHSV (n = 8), or TSC-G (n = 8). (Left) Subcutaneous tumor growth in treated tumors. (Right) Subcutaneous tumor growth in untreated tumors. Data are represented as means ± SEM. *P < 0.05, **P < 0.01, and ***P < 0.001. (C) Plots showing subcutaneous UV2-GFl tumor growth in mice treated with control SC-RmC (n = 7), oHSV-GM-CSF (n = 7), SC-oHSV (n = 8), or TSC-G (n = 8). (Left) Subcutaneous tumor growth in treated tumors. (Right) Subcutaneous tumor growth in untreated tumors. Data are represented as means ± SEM. *P < 0.05. (D) Y1.1-GFl–bearing mice after treatment (n = 4 per group) were rechallenged with Y1.1-GFI cells on day 90 into the brain. Plot showing brain metastatic tumor growth measured by in vivo Fluc bioluminescence (representative images shown right). Data are represented as means ± SEM. (E) Splenocytes from mice on day 90 after treatment (n = 3 per group) were incubated at 37°C with either Y1.1-GFl melanoma cells or TC-1-GFl lung at effector cell:target cell ratios (8:1). Data are represented as means + SD. *P < 0.05. n.s., not significant. (F) Representative images of IF analysis of CD3 in UV2-GFl tumors 14 days after the indicated treatment (n = 4 or 5 per group). Scale bar, 6 μm. (G) Quantified mean number of TILs expressing CD3 was statistically assessed from three selected fields as represented in (F). Data are represented as means + SD. *P < 0.05, **P < 0.01, and ***P < 0.001. (H) Representative images of IF analysis of CD11c, CD8, granzyme B, CD4, T-Bet, and Foxp3 in UV2-GFl tumors 14 days after indicated treatment (n = 4 or 5 per group). Scale bar, 6 μm. (I) Quantified mean number of CD11c, CD8, granzyme B, CD4, T-Bet, and Foxp3. Data are represented as means + SD. *P < 0.05. **P < 0.01, ***P < 0.001, and ****P < 0.0001. (J) Flow cytometric analysis of immune cells collected from UV2-GFl–bearing subcutaneous tumor 7 days after treatment. Data are represented as means + SD (n = 4 to 6 per group). *P < 0.05. **P < 0.01, ***P < 0.001, and ****P < 0.0001. (K) Representative FCM plots of central memory (CM) CD8+ T cells and effector memory (EM) CD8+ T cells on splenocytes after treatment. (L) FCM analysis of CM and EM CD8+ T cells on splenocytes after treatment (n = 3 or 5 per group). Data are represented as means + SD. *P < 0.05.
Fig. 5.
Fig. 5.. SCs secreting dual immunomodulators with SC-oHSV (TSC) have therapeutic efficacy in immunosuppressive LM mouse models.
(A) Scheme showing creation of SCN1KO-GM-CSF/scFvPD-1 (G/P). SCN1KO-GM-CSF were transduced with scFvPD-1 for codelivery of GM-CSF and scFvPD-1 to immunosuppressive LM tumors. (B) Expression of GM-CSF and scFvPD-1 in supernatant from SCN1KO-G/P by Western blotting. (C) BLI signal and photographs of IT-injected SCN1KO-G/P-Fluc–bearing mice (n = 3). Data are represented as means ± SEM. (D) A representative bioluminescence plot (top) showing changes in Fluc activity as a measure of virally infected cells after IT injection of oHSV-Fluc (1 × 10⁵ PFU) and SC-oHSV-Fluc (2 × 10⁵ cells) (n = 4 per group) in a UV2-GFP-Rluc–bearing LM mouse model was quantified (bottom). Data are represented as means + SEM. (E) Experimental design. In brief, in the UV2-GFl LM mouse model, SCs were IT administrated one time 5 days after implantation of tumors. Tumor volumes were measured every 2 to 3 days by BLI. FCM and RNA sequencing (RNA-seq) analysis were performed day 12 after treatment. (F) Fluc signal curves (left) and representative BLI images (right) of mice bearing UV2-GFl tumors treated with SC-RmC (n = 6), SC-oHSV (n = 6), TSC-G, or TSC-G/P (n = 7). Data are represented as means ± SEM. *P < 0.05. (G) Kaplan-Meier curves of overall survival of mice. (H) Kaplan-Meier curves of overall survival of UV2-GFI–bearing NOD/SCID mice after treatment with SC-RmC (n = 4), TSC-G (n = 4), or TSC-G/P (n = 4). P < 0.001. (I) Flow cytometric analysis of TILs collected from UV2-GFl–bearing LM tumor 7 days after treatment. Data are represented as means + SD (n = 4 to 7 per group). *P < 0.05 and **P < 0.01. (J) Heatmap of differential expression of genes associated with immune cell types after treatment in LM mouse tumors by RNA-seq. (n = 3 per group). (K) Heatmap of differential expression of genes associated with ICD after treatment in an LM mouse model.
Fig. 6.
Fig. 6.. Allogeneic SCs releasing human GM-CSF/scFvPD-1-TK and SC-oHSV (hTSC-G/P-TK) have therapeutic efficacy in humanized patient-derived PTEN-deficient MBM mice.
(A) Scheme showing intracranial injection (IC) and intrathecal injection as LM with patient-derived MBM (M12-GFl) cells. M12 cells were isolated from a patient with melanoma metastasized to the brain, expanded in culture, and engineered to introduce an in vivo imaging marker, GFP-Luciferase (GFI). (B) BLI signal curve of intracranially (let) or intrathecally (right) injected M12-GFl–bearing BLT humanized mice (n = 3 or 4 per each group). Data are represented as means ± SEM. (C) Representative H&E staining of the brain M12-GFl mouse model (top). IF analysis of CD11c and CD3 in the brain M12-GFl tumor BLT humanized model (bottom). Scale bar, 6 μm. (D) Flow cytometric (FCM) analysis of immune profiling of the brain M12-GFI mouse tumor model (IC) and the LM mouse tumor model (LM) (n = 4 per group). Data are represented as means + SD. (E) Cell viability assays showing hSCN1KO-hG/P-TK resistance to oHSV compared with human SCs (hSC) in vitro (n = 5 per group). Data are represented as means ± SD. (F) Expression of human GM-CSF and scFvPD-1 in supernatant from hSCN1KO-G/P-TK by Western blotting. (G) Cell viability assay of SCN1KO-hG/P-TK in the absence or presence of ganciclovir (GCV) for 2 days (n = 5 per group, technical replicates). Data are represented as means ± SD. (H) M12-GFI cells were investigated by cell viability assay 3 days after hSC-oHSV treatment in vitro (n = 5 per group). Data are represented as means ± SD. (I) Experimental design. In brief, in the M12-GFl LM mouse model, SCs were intrathecally administrated one time 5 days after implantation of M12-GFl cells. Tumor volumes were measured every 2 to 4 days by BLI. (J) Fluc signal curves and representative BLI images of BLT humanized mice bearing M12-GFl tumors treated with hSCs (n = 4) or hTSC-G/P-TK (n = 4). Data are represented as means ± SEM. *P < 0.05. (K) Kaplan-Meier curves of overall survival of mice. *P < 0.05. (L) FCM analysis of immune cells collected from M12-GFl LM tumor 10 days after treatment (n = 3 per group). *P < 0.05. (M) FCM analysis of conventional (c) DC1 and cDC2 collected from M12-GFl LM tumor 10 days after treatment (n = 3 per group). *P < 0.05.

References

    1. Chamberlain MC, Brain metastases: A medical neuro-oncology perspective. Expert Rev. Neurother 10, 563–573 (2010). - PubMed
    1. Zakrzewski J, Geraghty LN, Rose AE, Christos PJ, Mazumdar M, Polsky D, Shapiro R, Berman R, Darvishian F, Hernando E, Pavlick A, Osman I, Clinical variables and primary tumor characteristics predictive of the development of melanoma brain metastases and post-brain metastases survival. Cancer 117, 1711–1720 (2011). - PMC - PubMed
    1. Bedikian AY, Wei C, Detry M, Kim KB, Papadopoulos NE, Hwu WJ, Homsi J, Davies M, McIntyre S, Hwu P, Predictive factors for the development of brain metastasis in advanced unresectable metastatic melanoma. Am. J. Clin. Oncol 34, 603–610 (2011). - PubMed
    1. Coit DG, Thompson JA, Albertini MR, Barker C, Carson WE, Contreras C, Daniels GA, DiMaio D, Fields RC, Fleming MD, Freeman M, Galan A, Gastman B, Guild V, Johnson D, Joseph RW, Lange JR, Nath S, Olszanski AJ, Ott P, Gupta AP, Ross MI, Salama AK, Skitzki J, Sosman J, Swetter SM, Tanabe KK, Wuthrick E, McMillian NR, Engh AM, Cutaneous melanoma, version 2.2019, NCCN clinical practice guidelines in oncology. J. Natl. Compr. Cancer Netw 17, 367–402 (2019). - PubMed
    1. Brahmer JR, Tykodi SS, Chow LQ, Hwu WJ, Topalian SL, Hwu P, Drake CG, Camacho LH, Kauh J, Odunsi K, Pitot HC, Hamid O, Bhatia S, Martins R, Eaton K, Chen S, Salay TM, Alaparthy S, Grosso JF, Korman AJ, Parker SM, Agrawal S, Goldberg SM, Pardoll DM, Gupta A, Wigginton JM, Safety and activity of anti-PD-L1 antibody in patients with advanced cancer. N. Engl. J. Med 366, 2455–2465 (2012). - PMC - PubMed

Publication types

Substances