. 2023 May 31;15(698):eabo3189.
doi: 10.1126/scitranslmed.abo3189. Epub 2023 May 31.

PSMC3 proteasome subunit variants are associated with neurodevelopmental delay and type I interferon production

Frédéric Ebstein  1 Sébastien Küry  2   3 Victoria Most  4 Cory Rosenfelt  5 Marie-Pier Scott-Boyer  6 Geeske M van Woerden  7   8   9 Thomas Besnard  2   3 Jonas Johannes Papendorf  1 Maja Studencka-Turski  1 Tianyun Wang  10   11   12 Tzung-Chien Hsieh  13 Richard Golnik  14 Dustin Baldridge  15 Cara Forster  16 Charlotte de Konink  7   8 Selina M W Teurlings  7   8 Virginie Vignard  2   3 Richard H van Jaarsveld  17 Lesley Ades  18   19 Benjamin Cogné  2   3 Cyril Mignot  20   21 Wallid Deb  2   3 Marjolijn C J Jongmans  17   22 F Sessions Cole  15 Marie-José H van den Boogaard  17 Jennifer A Wambach  15 Daniel J Wegner  15 Sandra Yang  16 Vickie Hannig  23 Jennifer Ann Brault  23 Neda Zadeh  24 Bruce Bennetts  19   25 Boris Keren  26 Anne-Claire Gélineau  26 Zöe Powis  27 Meghan Towne  27 Kristine Bachman  28 Andrea Seeley  28 Anita E Beck  29 Jennifer Morrison  30 Rachel Westman  31 Kelly Averill  32 Theresa Brunet  33   34 Judith Haasters  35 Melissa T Carter  36   37 Matthew Osmond  36 Patricia G Wheeler  30 Francesca Forzano  38   39 Shehla Mohammed  38   39 Yannis Trakadis  40 Andrea Accogli  40 Rachel Harrison  38   41 Yiran Guo  42   43 Hakon Hakonarson  42 Sophie Rondeau  44 Geneviève Baujat  44 Giulia Barcia  44 René Günther Feichtinger  45 Johannes Adalbert Mayr  45 Martin Preisel  45 Frédéric Laumonnier  46   47 Tilmann Kallinich  48   49 Alexej Knaus  13 Bertrand Isidor  2   3 Peter Krawitz  13 Uwe Völker  50 Elke Hammer  50 Arnaud Droit  6 Evan E Eichler  10   51 Ype Elgersma  8   9 Peter W Hildebrand  4   52   53 François Bolduc  5   54   55 Elke Krüger  1 Stéphane Bézieau  2   3
Affiliations

PSMC3 proteasome subunit variants are associated with neurodevelopmental delay and type I interferon production

Frédéric Ebstein et al. Sci Transl Med. .

Abstract

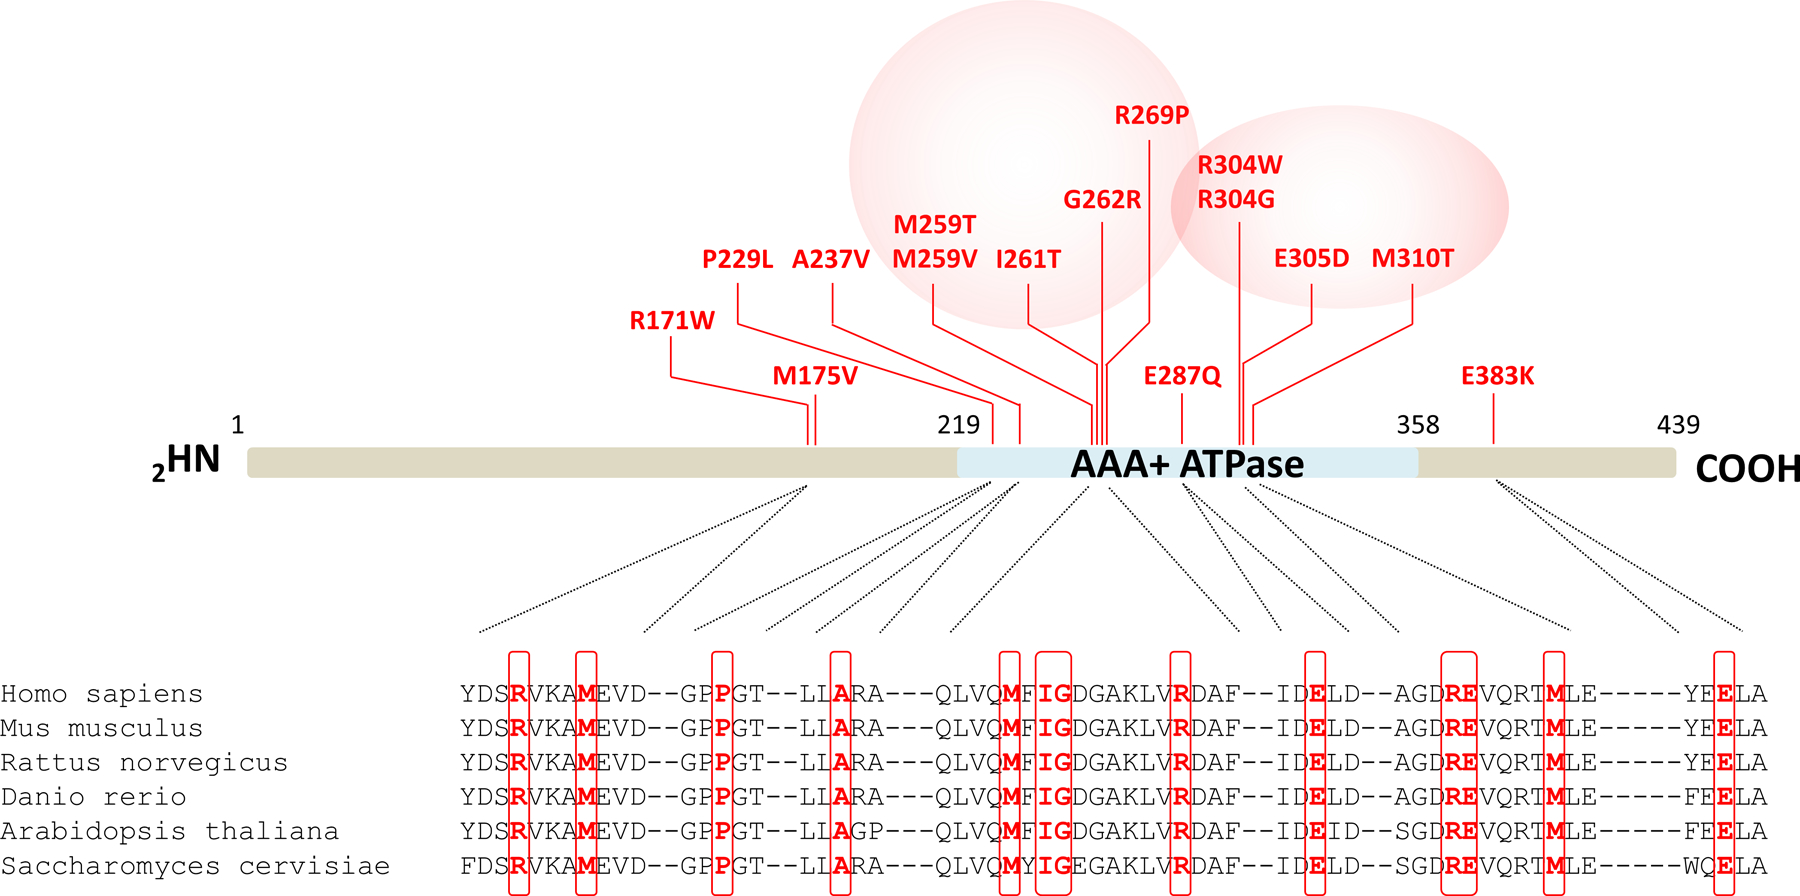
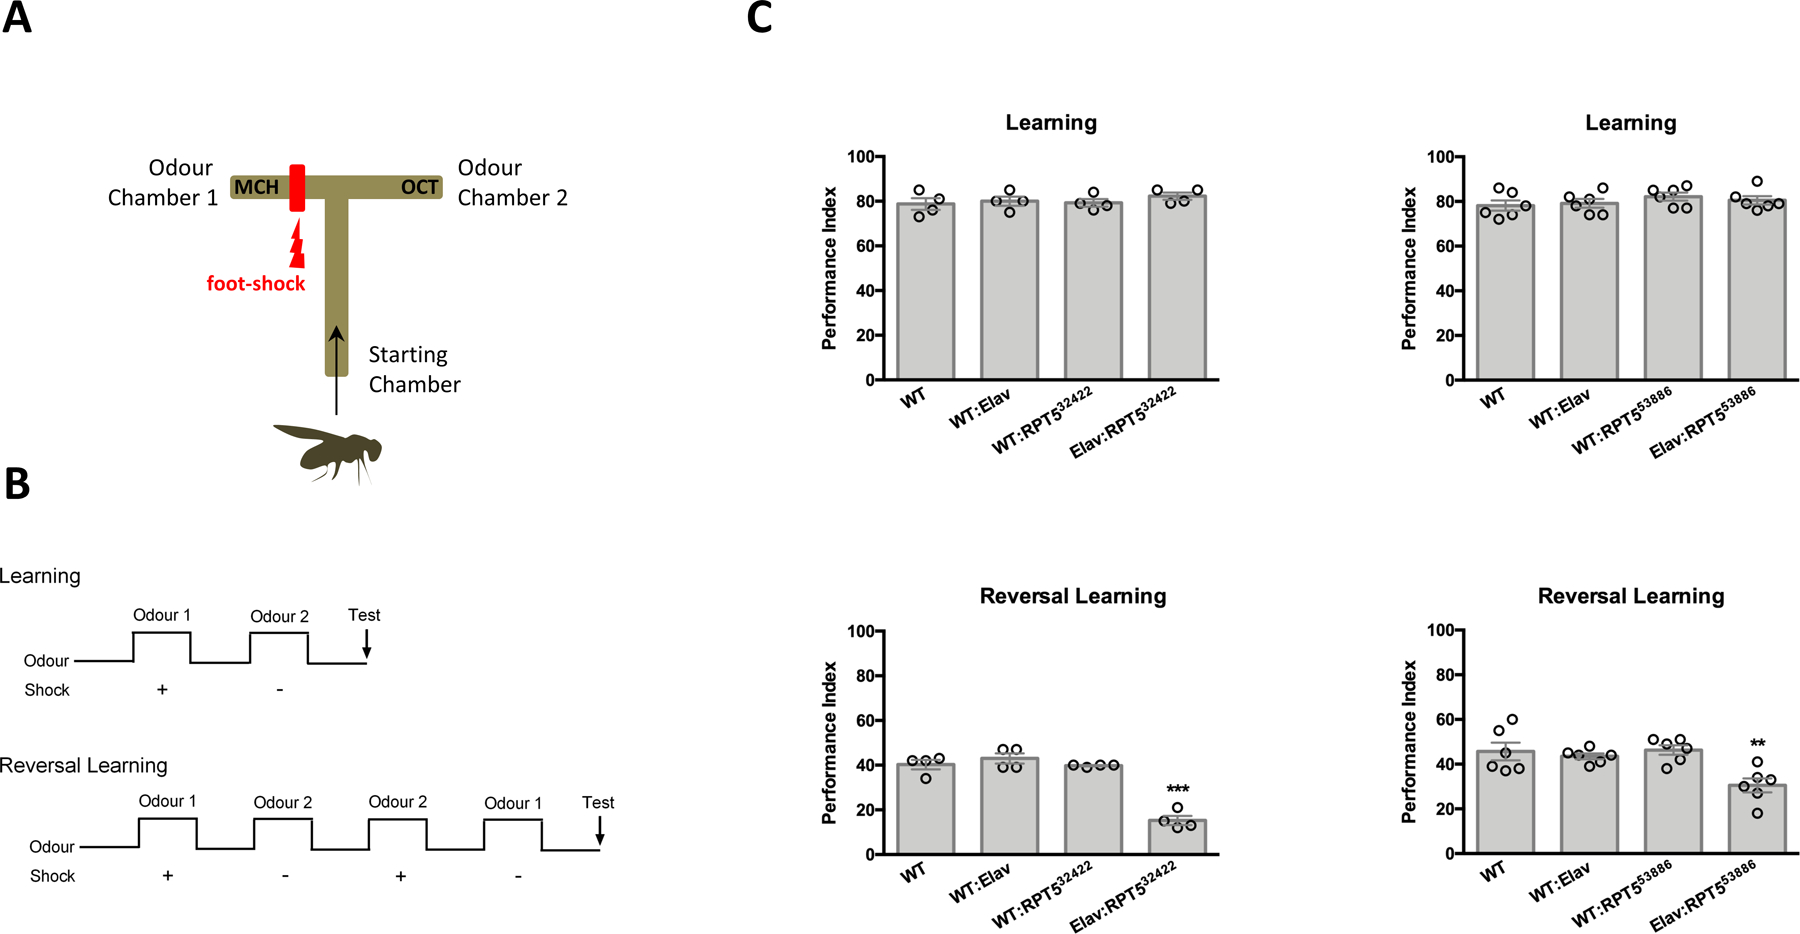
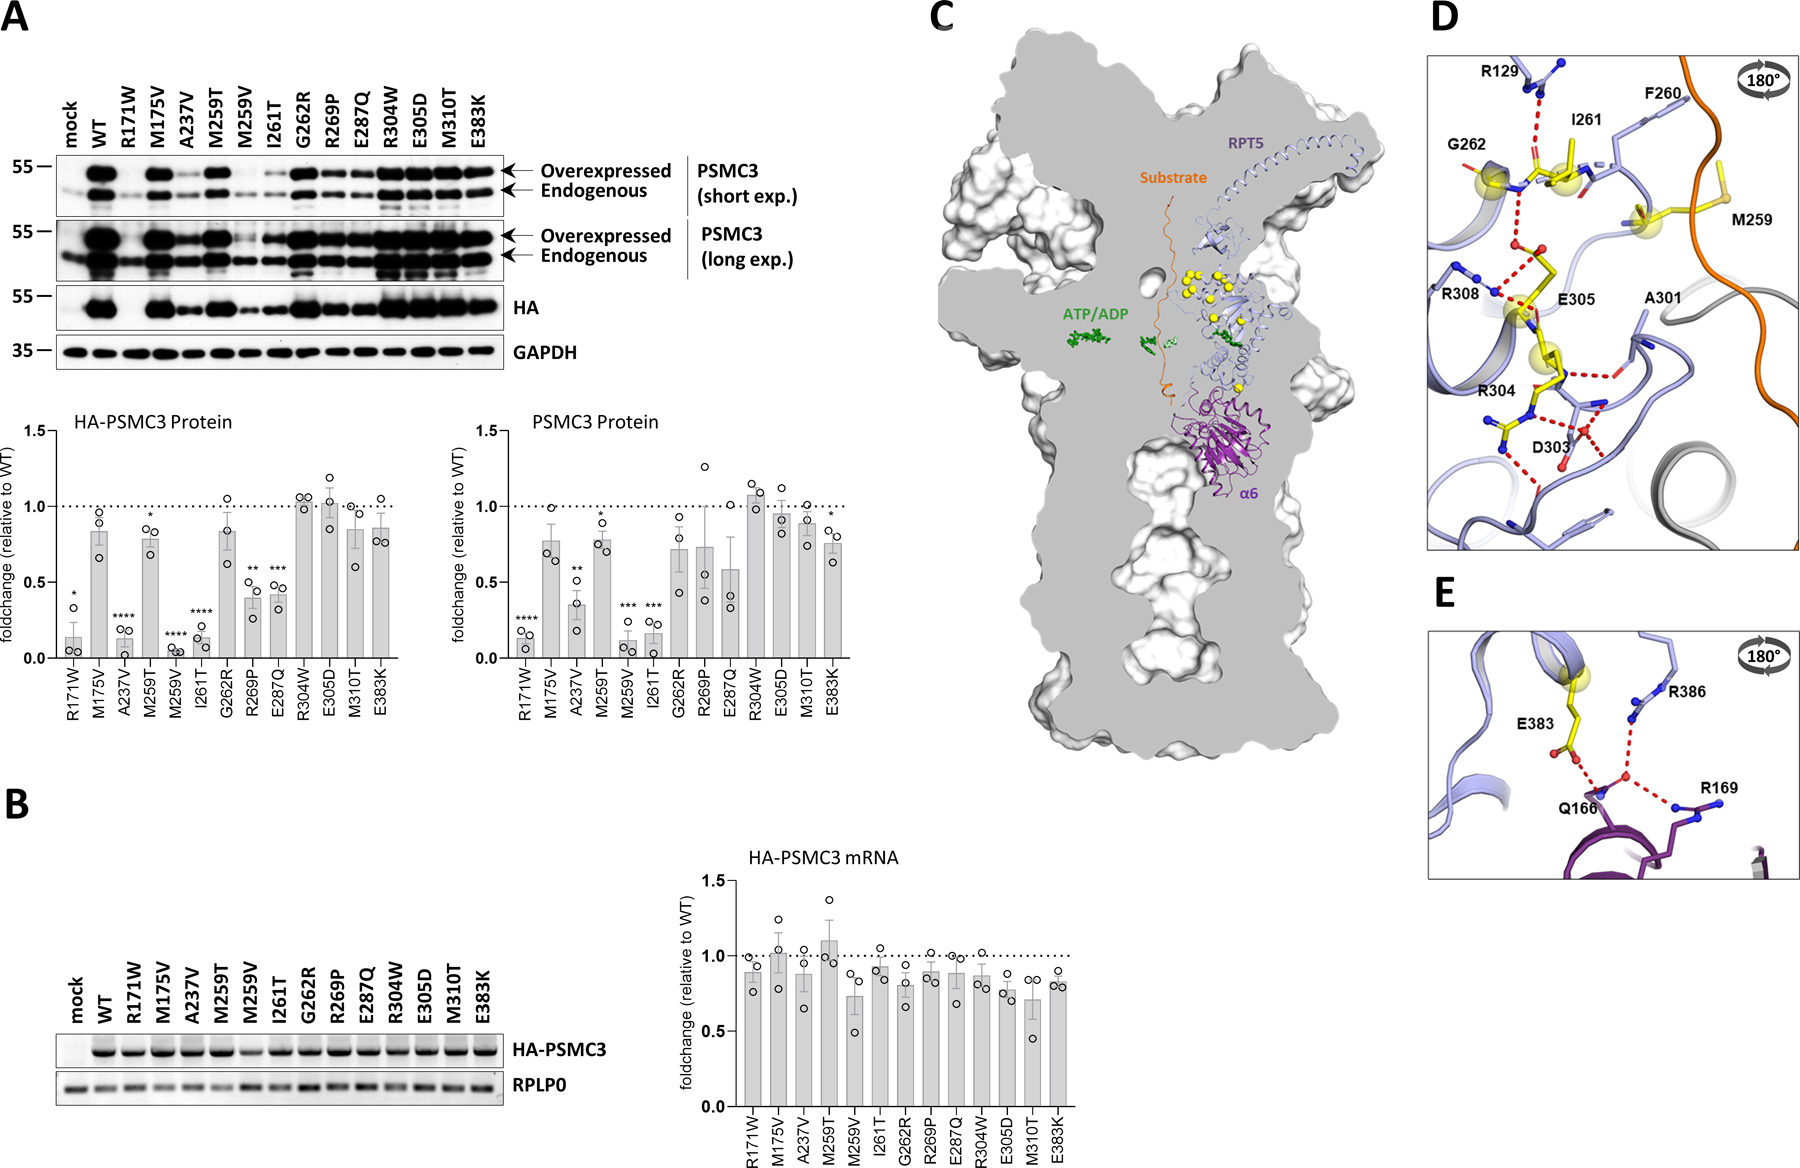
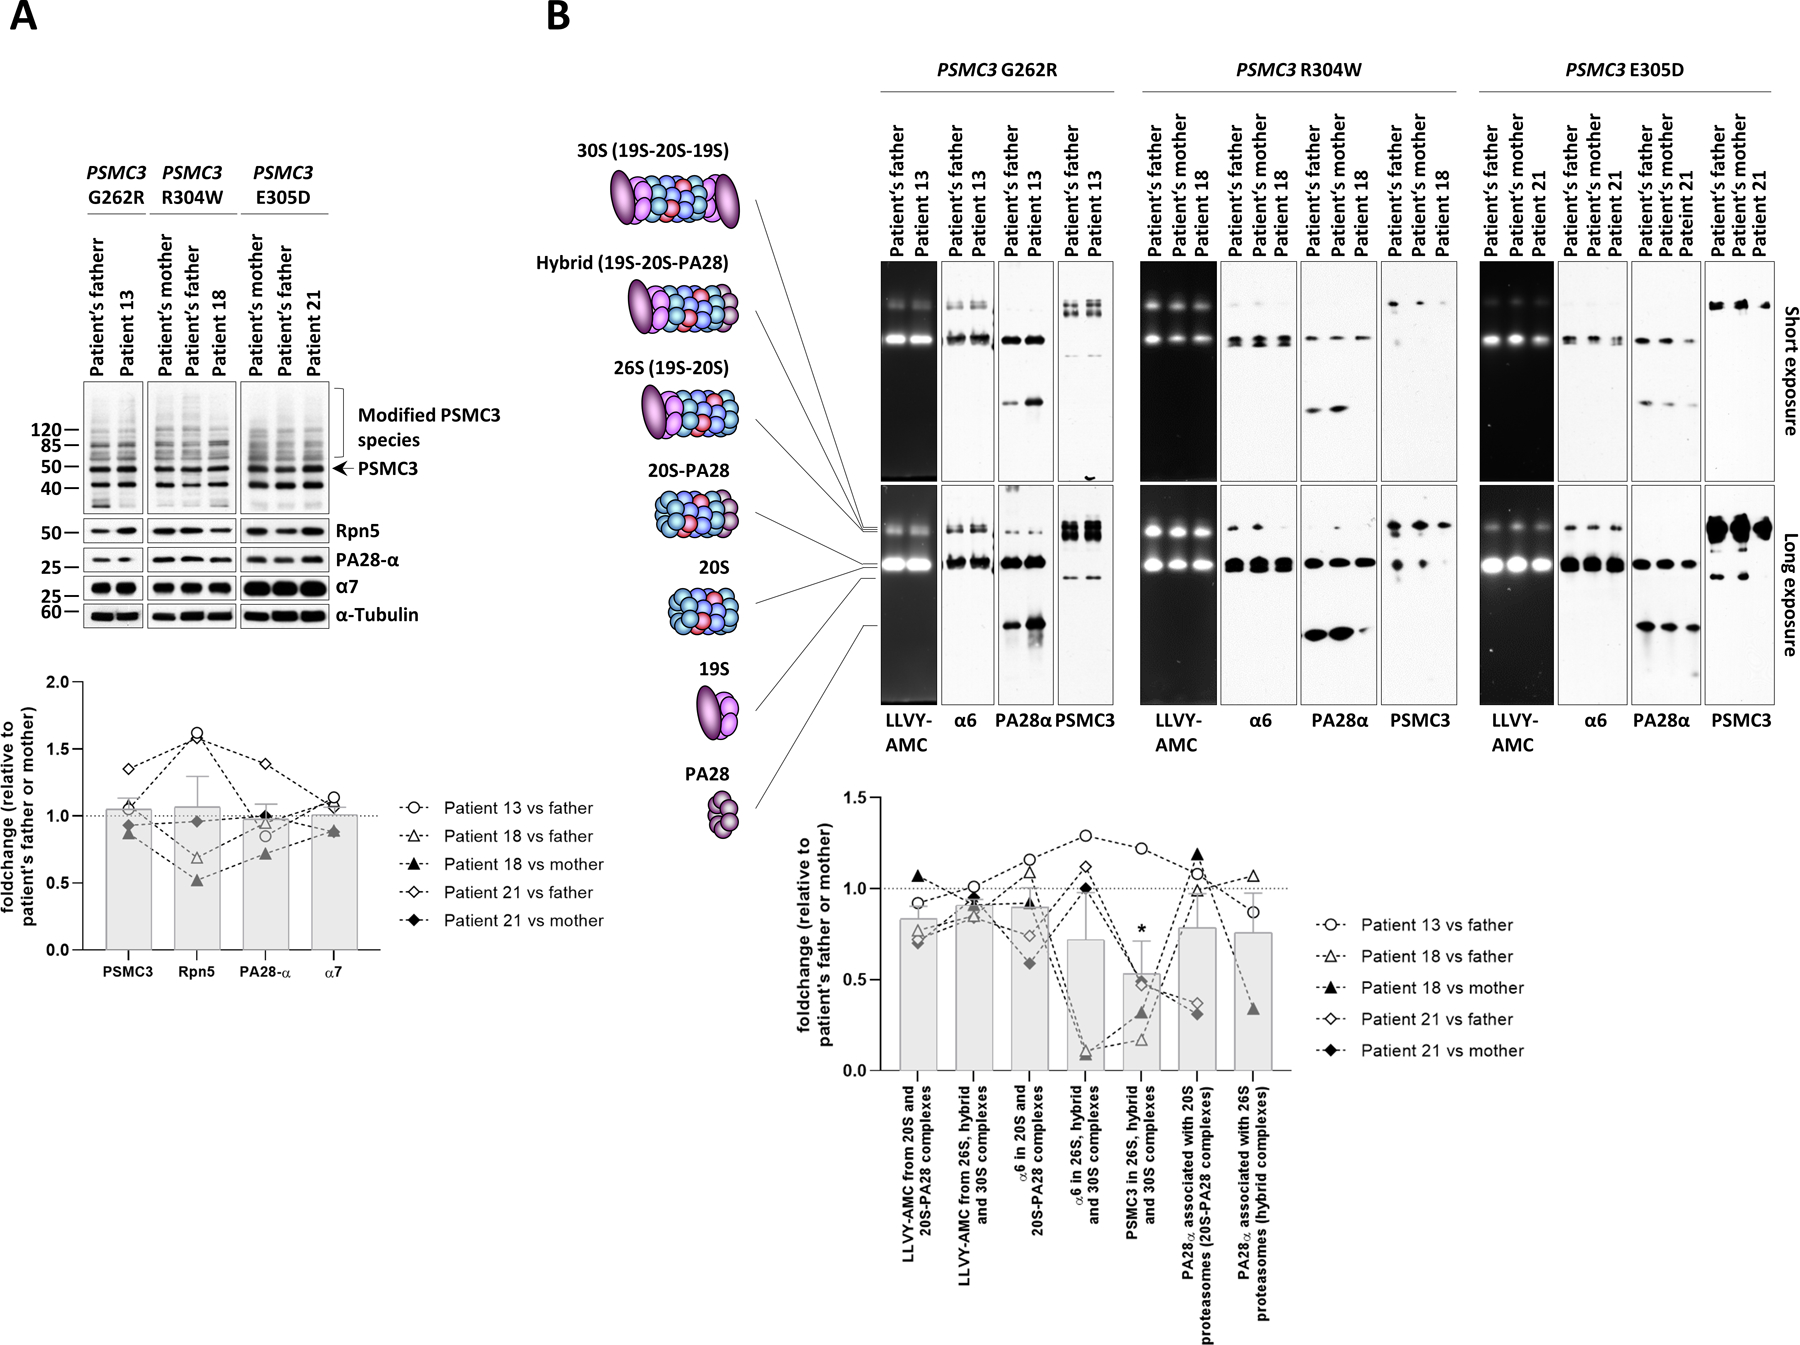
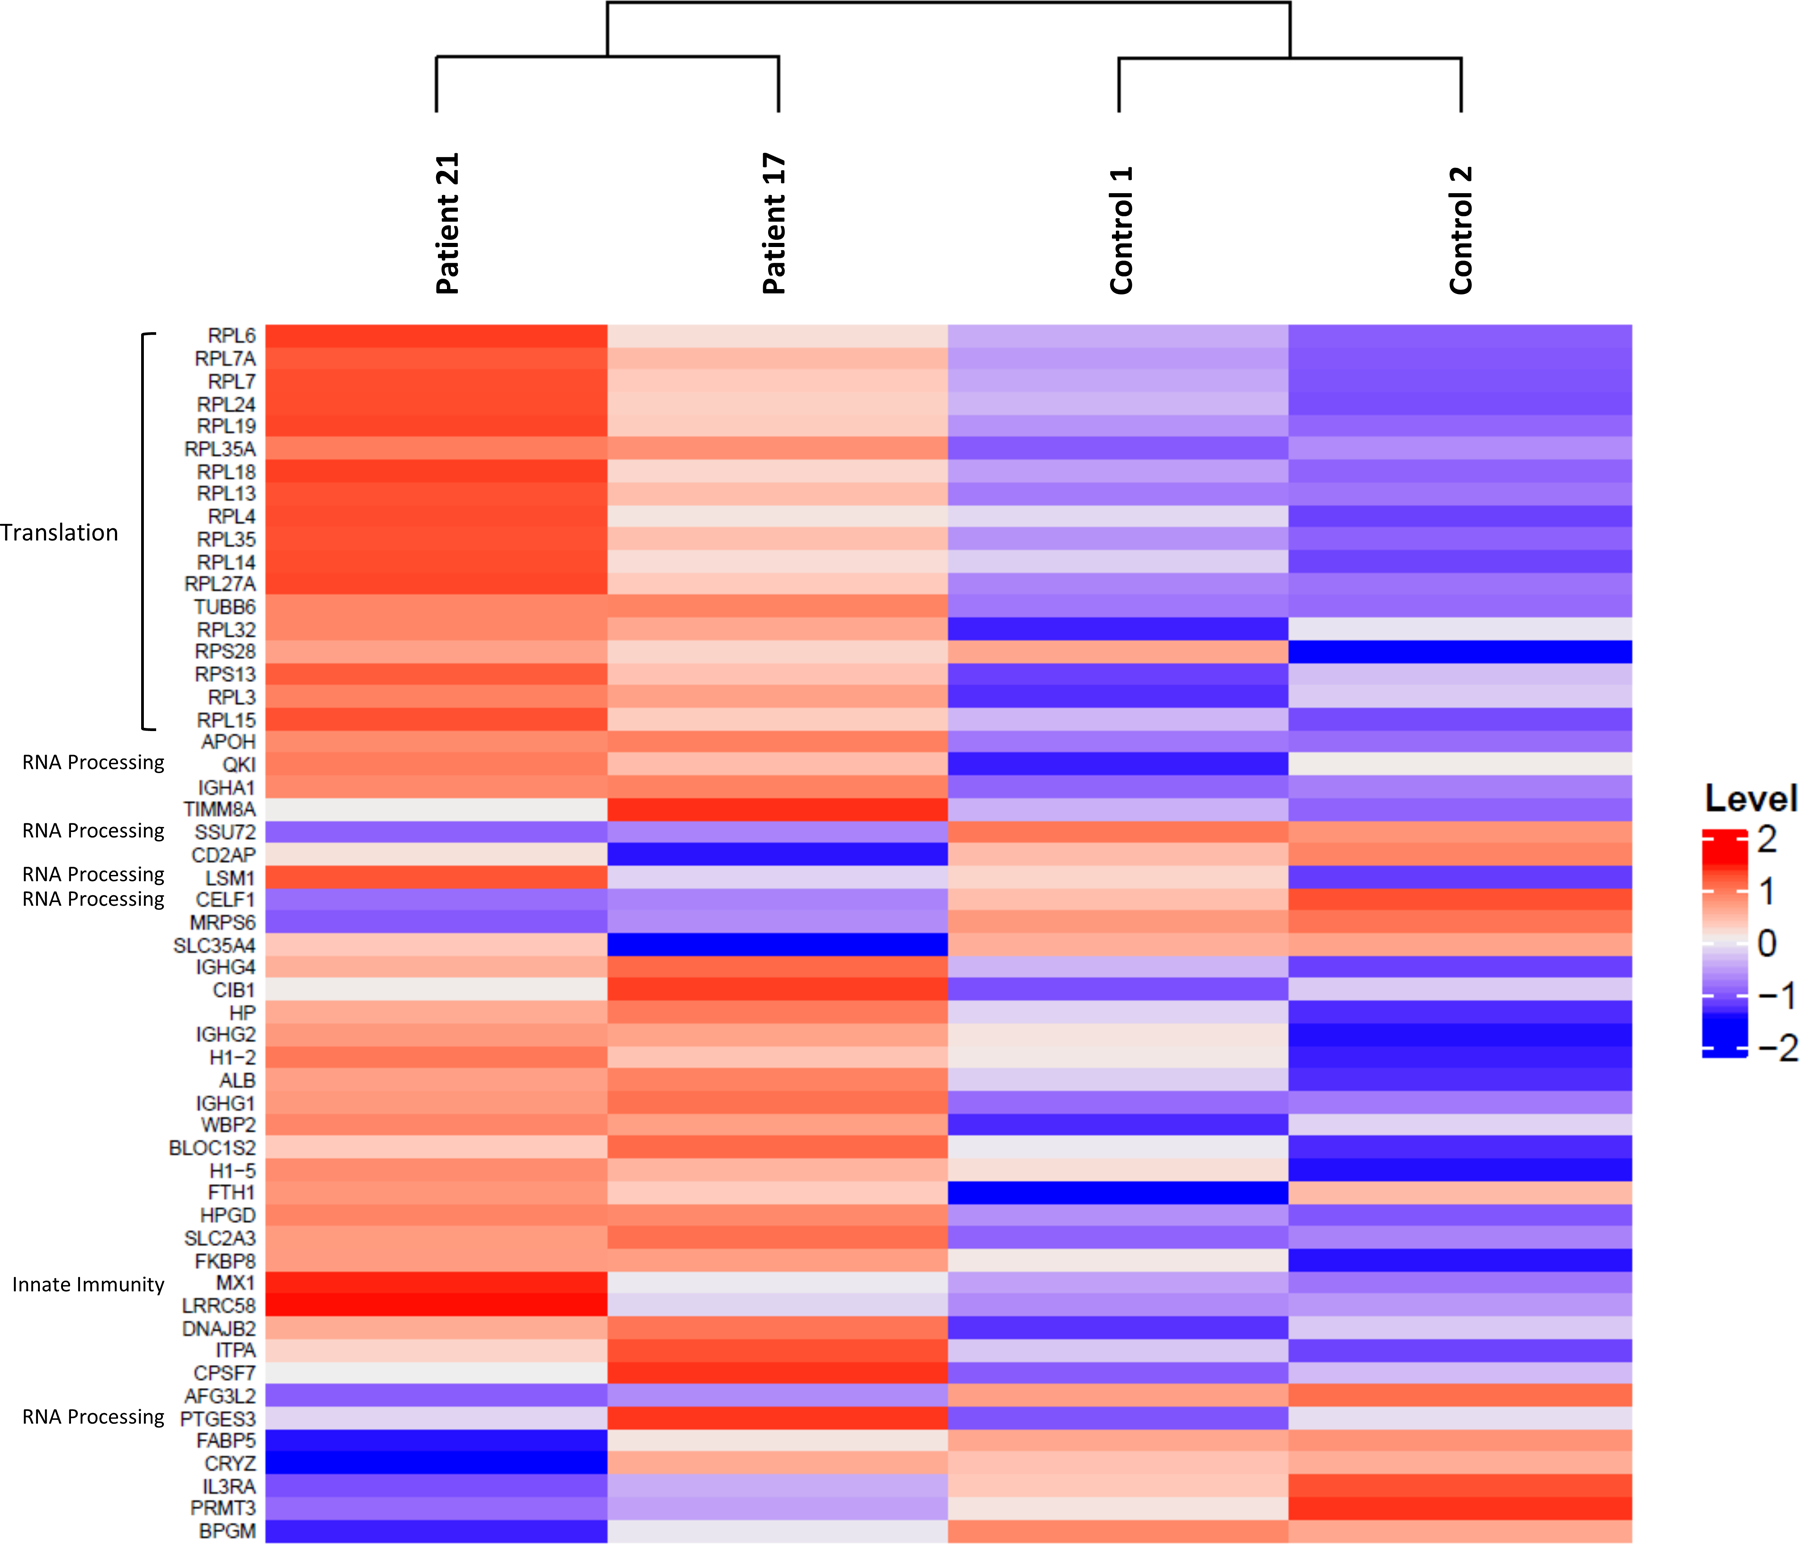
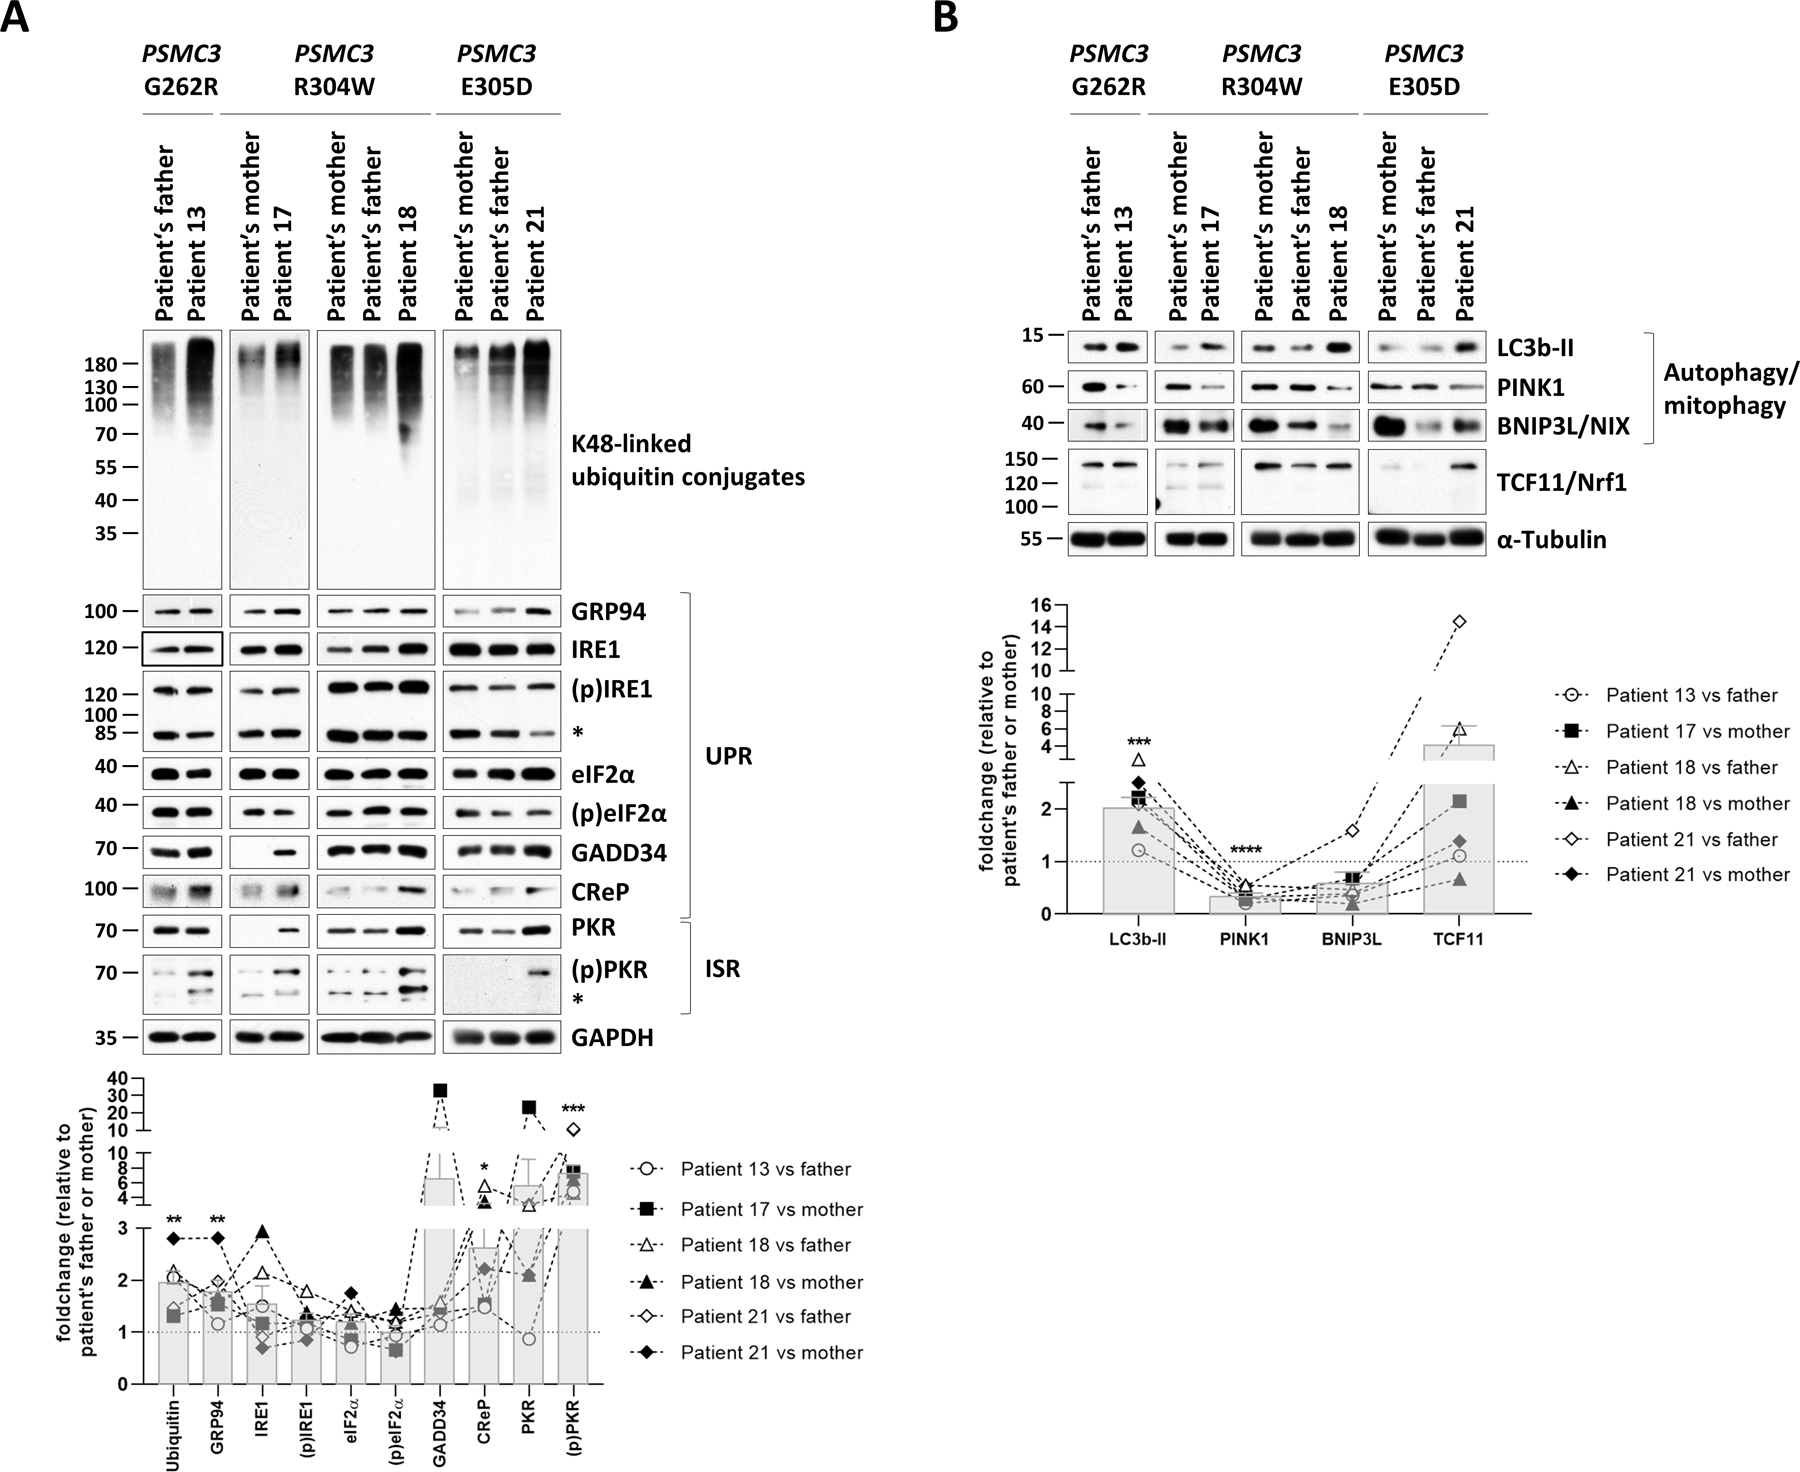
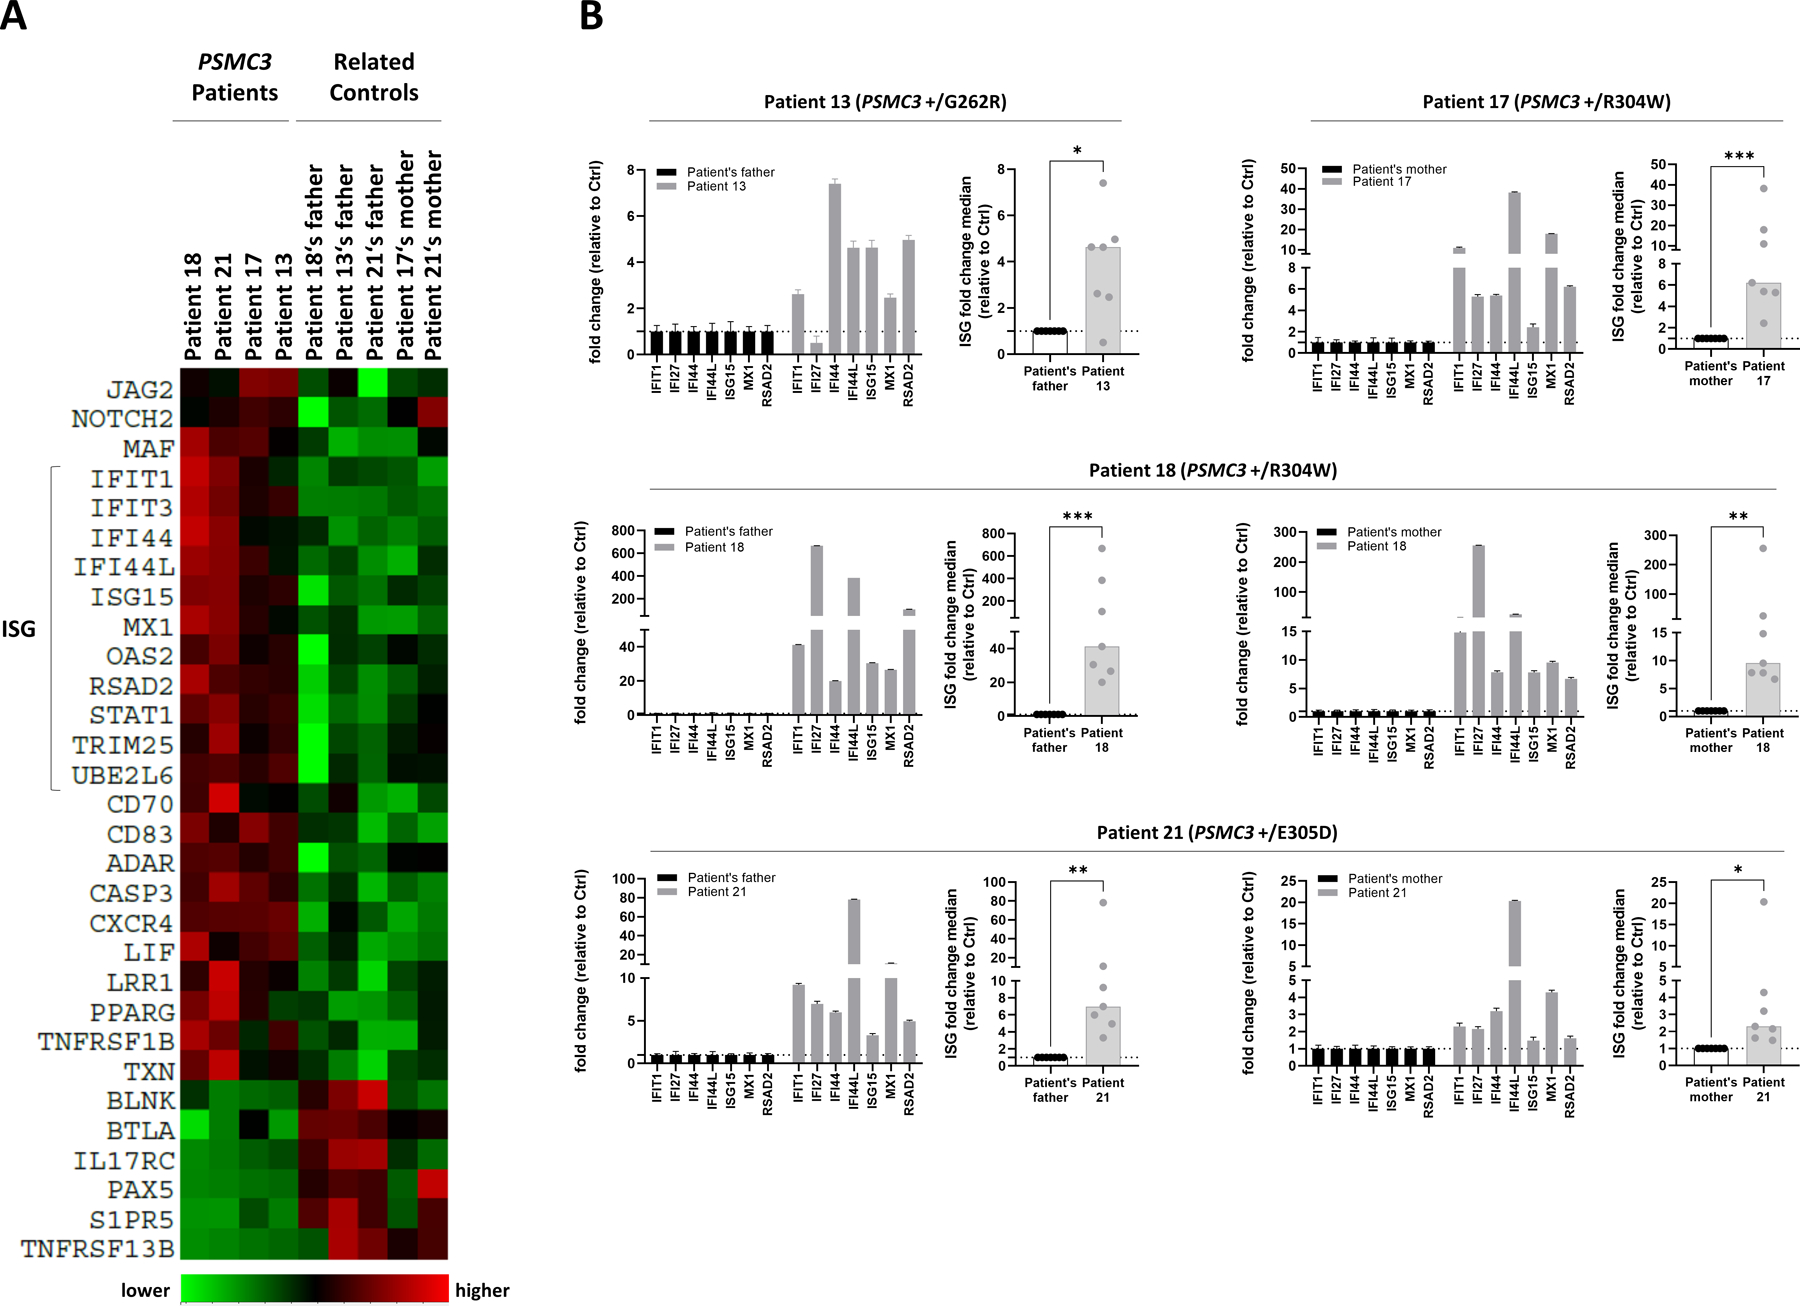
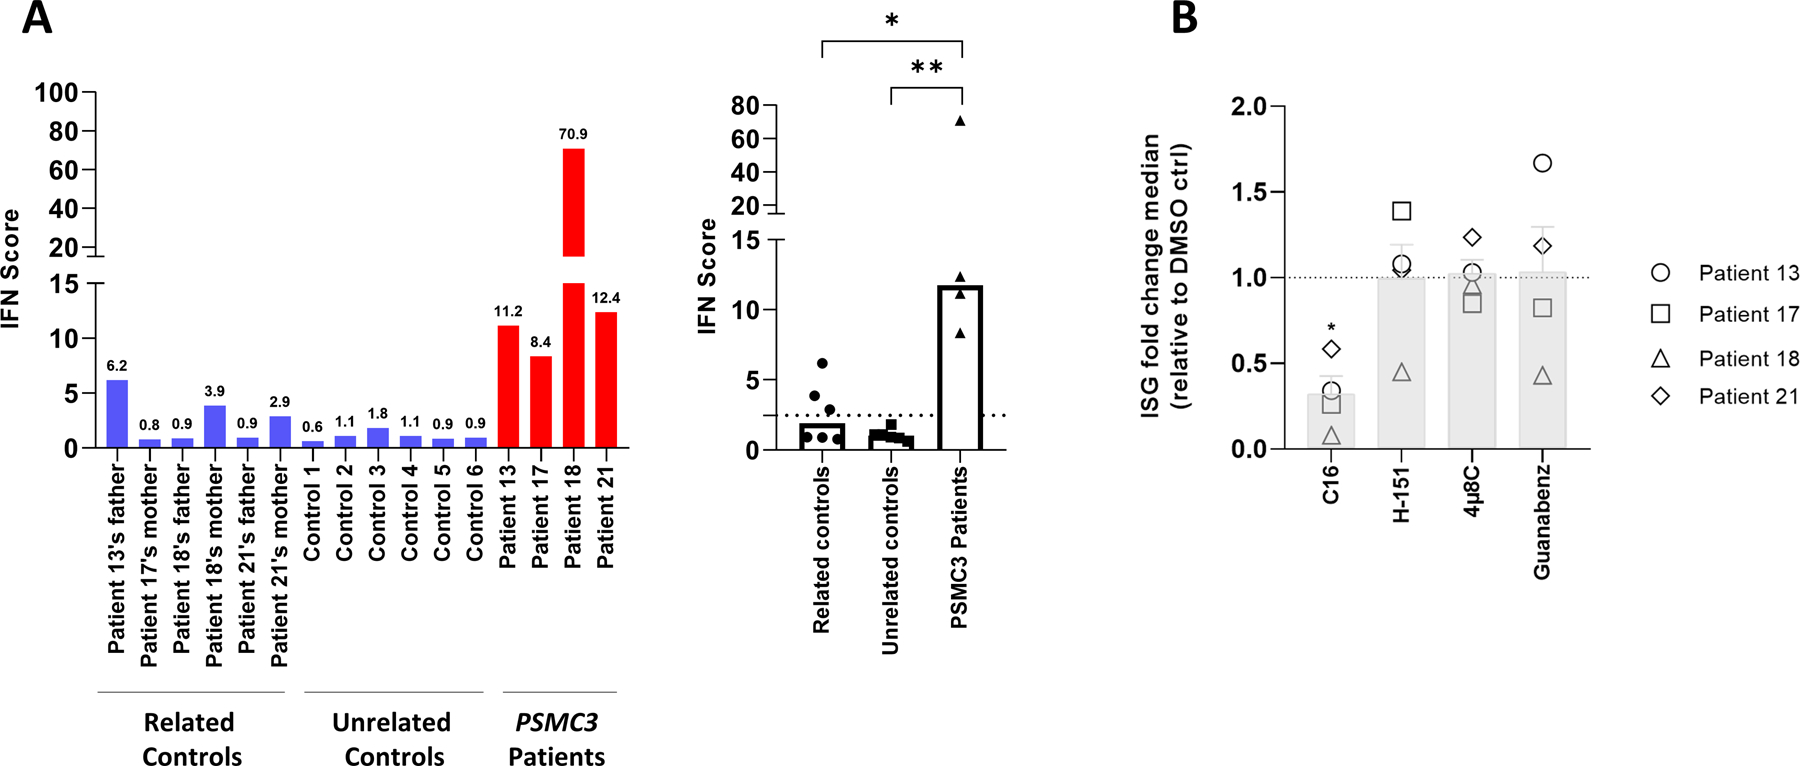
A critical step in preserving protein homeostasis is the recognition, binding, unfolding, and translocation of protein substrates by six AAA-ATPase proteasome subunits (ATPase-associated with various cellular activities) termed PSMC1-6, which are required for degradation of proteins by 26S proteasomes. Here, we identified 15 de novo missense variants in the PSMC3 gene encoding the AAA-ATPase proteasome subunit PSMC3/Rpt5 in 23 unrelated heterozygous patients with an autosomal dominant form of neurodevelopmental delay and intellectual disability. Expression of PSMC3 variants in mouse neuronal cultures led to altered dendrite development, and deletion of the PSMC3 fly ortholog Rpt5 impaired reversal learning capabilities in fruit flies. Structural modeling as well as proteomic and transcriptomic analyses of T cells derived from patients with PSMC3 variants implicated the PSMC3 variants in proteasome dysfunction through disruption of substrate translocation, induction of proteotoxic stress, and alterations in proteins controlling developmental and innate immune programs. The proteostatic perturbations in T cells from patients with PSMC3 variants correlated with a dysregulation in type I interferon (IFN) signaling in these T cells, which could be blocked by inhibition of the intracellular stress sensor protein kinase R (PKR). These results suggest that proteotoxic stress activated PKR in patient-derived T cells, resulting in a type I IFN response. The potential relationship among proteosome dysfunction, type I IFN production, and neurodevelopment suggests new directions in our understanding of pathogenesis in some neurodevelopmental disorders.


Conflict of interest statement

Competing interests: Authors declare that they have no competing interests.

Figures

Fig. 1:
Fig. 1:. Distribution of the de novo heterozygous PSMC3/Rpt5 variants identified in patients.
Shown are the locations of the fifteen NDD-causing missense variants (indicated in red) along the PSMC3/Rpt5 protein. The AAA-ATPase domain of the PSMC3/Rpt5 proteasome subunit of the 19S regulatory particle is depicted in blue. Pink circles indicate the presence of variants hotspots. Shown is also a sequence alignment of regions immediately adjacent to the amino acids subjected to missense substitutions. Comparison of the PSMC3/Rpt5 primary structure across six eukaryotic organisms indicates the high conservation of the missense variant residues identified in NDD/ID patients which are highlighted by red boxes.
Fig. 2:
Fig. 2:. Pan-neuronal RNAi-mediated knockdown of PSMC3/Rpt5 results in normal learning performance but defective reversal learning performance.
A. Shown is an illustration of a T-maze used for conditioning of odor-avoidance in Drosophila. Flies were trained to avoid one particular odor chamber that was associated with a foot-shock (in this example, odor chamber 1). B. The time course of the learning and reversal learning protocols used in these experiments is illustrated. Reversal learning was assessed by reversing odor shock pairing (4-methylcyclohexanol, MCH; 3-octanol, OCT+), as indicated. C. Upper left: Shown is the learning performance index of wildtype flies (WT), flies expressing elav, flies with full expression of Rpt532422 RNAi (WT: Rpt532422) and flies with pan-neuronal expression of Rpt532422 RNAi (Elav: Rpt532422) (P=0.6435, N=4). Upper right: Shown is the learning performance index of wildtype flies (WT), flies exressing elav (WT:Elav), flies with full expression of Rpt553886 RNAi (WT: Rpt553886) and flies with pan-neuronal expression of Rpt553886 RNAi (Elav: Rpt553886) (P=0.5282, N=6; Upper right). Lower left: Shown is the reversal learning performance of all group described in C, Upper left. (P<0.0001, N=4). Lower right: Shown is the reversal learning performance index for all groups descripted in C, Upper right (P=0.0022, N=6). Statistical analysis was performed using ANOVA and then Tukey tests in JMP (SAS).**, P<0.01; ***, P<0.001.
Fig. 3:
Fig. 3:. PSMC3/Rpt5 protein variants do not behave similarly at the molecular level.
A. Top: SHSY5Y cells were transfected with HA-tagged PSMC3 mutants for 24 h before protein extraction and Western-blotting using antibodies specific for PSMC3/Rpt5 and HA, as indicated. Non-transfected and mock-transfected cells served as negative controls. Equal protein loading was ensured by probing the membranes with an anti-α-tubulin monoclonal antibody (two exposure times are shown). Arrows indicate overexpressed and endogenous PSMC3/Rpt5. Shown is one representative experiment out of three. Bottom: quantification of HA-tagged and untagged PSMC3/Rpt5 proteins in transfected SHSY5Y cells by densitometry. Data are presented as protein foldchanges to wild-type (WT) PSMC3/Rpt5 proteins whose densitometry measurements were set to 1 (gridline) after normalization with GAPDH. Shown are mean values ± SEM from three independent experiments. Statistical significance was assessed by unpaired Student’s test (*p<0.05, **p<0.01, ***p<0.001 and ****p<0.0001). B. Left: SHSY5Y cells that were transfected with HA-PSMC3 variants were subjected to total RNA extraction followed by semi-quantitative RT-PCR using primer located in PSMC3 and the polyadenylation signal of the pcDNA3.1/myc-HIS expression vector (BGH). Equal loading between the samples was ensured by amplifying the RPL0 gene, as indicated. Right: quantification of HA-tagged PSMC3 transcripts in transfected SHSY5Y cells by densitometry. Data are presented as mRNA foldchanges to wild-type (WT) HA-PSMC3 mRNA whose densitometry measurements were set to 1 (gridline) after normalization with RPLP0. Shown are mean values ± SEM from three independent experiments. C. A sliced surface view of the 26S proteasome (grey) was superimposed with a cartoon representation of the subunit PSMC3/RPT5 (blue) and PSMB1/α6 (purple) as well as the substrate (orange). The ATP/ADP molecules of the AAA-ATPase ring are shown as green sticks, while the positions of the investigated missense variants are indicated as bright yellow spheres. D. Detailed representation of the missense variants in the loop region of the N-terminal α/β domain. The residues affected by these variants are involved in a polar interaction network close to the substrate tunnel (view rotated by 180° around the x-axis). E. Close up view on the RPT5-α6 interface affected by the E383L variant. Residues affected by this variant are shown as bright yellow balls and sticks with atoms coloured by polarity (oxygen in red, nitrogen in blue and sulphur in dark yellow, view rotated by 180° around the x-axis).
Fig. 4:
Fig. 4:. PSMC3/Rpt5 protein variants lead to proteasome assembly defects in patient T cells.
A. Top: five to twenty micrograms of radio-immunoprecipitation assay (RIPA) lysates from T cells isolated from Patients #13, #18 and #21 as well as related controls (index case’s father and/or mother) were separated by SDS-PAGE followed by Western-blotting using antibodies directed against PSMC3/Rpt5, PSMD12/Rpn5, PA28-α and α7, as indicated. Equal protein loading was ensured by probing the membrane with an anti-α-tubulin antibody. Arrow indicates full-length PSMC3/Rpt5 migrating at the predicted size of about 50 kDa. High molecular weight (HMW) modified PSMC3/Rpt5 species are marked by a bracket. Bottom: quantification of the Western blots by densitometry. Data are presented as foldchanges in Patients #13, #18 and #21 vs their father, mother or both, whose densitometric measurements were set to 1 (gridline), as indicated. Columns indicate the foldchange mean values ± SEM calculated from the five normalizations. B. Top: twenty micrograms of T-cell lysates from patients #13, #18 and #21 and their parents (mother and/or father) were separated by 3–12% native-PAGE. Proteasome chymotrypsin-like activity was assessed in gels using the LLVY-AMC fluorogenic peptide, as indicated. Gels were subsequently subjected to Western-blotting using antibodies specific for α6, PSMC3/Rpt5 and PA28-α, as indicated. The schematic to the left depicts the proteasome complexes (30S, hybrid, 26S, 20S-PA28 and 20S) and free regulators (19S and PA28) detected by the three antibodies. Bottom: quantification of the LLVY-AMC fluorescent signals and α6, PA28α and PSMC3 immunoreactive bands in 20S (short exposure), 20S-PA28 (short exposure), 26S (long exposure), hybrid (long exposure) and/or 30S (long exposure) proteasome complexes by densitometry, as indicated. Data are presented as activity (LLVY-AMC) and protein (α6, PA28α and PSMC3) foldchanges in Patients #13, #18 and #21 vs their father and/or mother whose densitometric measurements were set to 1 (gridline), as indicated. Columns indicate the foldchange mean values ± SEM calculated from the five normalizations. Statistical significance was assessed by unpaired Student’s test (*p<0.05).
Fig. 5:
Fig. 5:. Proteomic signatures of patients carrying PSMC3/Rpt5 variants.
Heatmap cluster analysis showing the similarities in the protein expression profiles of the Patients #17 and #21 (carrying the R304W and E305D PSMC3 variants, respectively) compared to their related controls (father and/or mother of the proband), as indicated. The heatmap indicates the normalized and scale expression value of proteins in the individual samples. Only the differentially expressed proteins with an absolute value of log2 fold-change greater than 2 were selected for the clustering analysis.
Fig. 6:
Fig. 6:. T cells from patients carrying PSMC3/Rpt5 variants exhibit signs of protein homeostasis perturbations and alterations of the UPR, ISR and autophagy/mitophagy pathways.
A. Top: five to twenty micrograms of RIPA lysates from T cells isolated from Patients #13, #17, #18 and #21 as well as related controls (PSMC3 index case’s father and/or mother) were separated by SDS-PAGE followed by Western-blotting using antibodies directed against K48-linked ubiquitin-modified proteins, GRP94, IRE1, phospho-IRE1, eIF2α, phospho-eIF2α, GADD34, CReP, PKR, phospho-PKR and GAPDH (loading control), as indicated. Bottom: Shown is the quantification of the Western-blots by densitometry. Data are presented as foldchanges in Patients #13, #17, #18 and #21 vs their father and/or mother whose densitometric measurements were set to 1 (gridline), as indicated. Columns indicate the foldchange mean values ± SEM calculated from the six normalizations. Statistical significance was assessed by unpaired Student’s test (*p<0.05, **p<0.01 and ***p<0.001). B. Top: RIPA-cell lysates from Patients #13, #17, #18 and #21 as well as their related controls (index case’s father and/or mother) were subjected to SDS-PAGE/Western-blotting using antibodies specific for LC3b, PINK1, BNIP3L and α-tubulin (loading control), as indicated. Bottom: quantification of the Western-blots by densitometry. Data are presented as protein foldchanges in Patients #13, #17, #18 and #21 vs their father and/or mother whose densitometric measurements were set to 1 (gridline), as indicated. Columns indicate the foldchange mean values ± SEM of the six normalizations. Statistical significance was assessed by unpaired Student’s test (***p<0.001 and ****p<0.0001).
Fig. 7:
Fig. 7:. T cells from patients with PSMC3/Rpt5 missense variants exhibit a typical type I interferon (IFN) signature.
A. Heat map clustering of gene expression in T cells isolated from patients carrying a PSMC3 variant and their relative controls (father and/or mother). Each column represents one individual patient or related control and each row represents one gene. Clustering of genes and samples was carried out by centred Pearson correlation. Colour indicates normalized counts of each transcript, with green representing higher expression and red relatively lower expression. B. Gene expression of seven typical IFN-stimulated genes (IFIT1, IFI27, IFI44, IFI44L, ISG15, MX1 and RSAD2) was assayed by RT-qPCR on T cells derived from Patients #13, #17, #18 and #21 as well as their respective controls (the index case’s father and/or mother). Expression levels were normalized to GAPDH and relative quantifications (RQ) are presented as fold change over controls. Shown is also the median fold expression of the seven ISGs over relative controls. Statistical significance was assessed by ratio paired t test where *indicates p<0.05, ** indicates p<0.01 and *** indicates p<0.001.
Fig. 8:
Fig. 8:. T cells from patients carrying PSMC3/Rpt5 variants exhibit high protein kinase R (PKR)-dependent type I IFN scores.
A. left panel: IFN scores for Patients #13, #17, #18 and #21 and related controls, as well as for six unrelated controls (1 to 6) were calculated as the median of the relative quantifications of the seven ISGs over a single calibrator control. Shown are the IFN scores of each sample (left panel) and the sample groups, namely parents, unrelated healthy donors and patients carrying PSMC3 variants, as indicated. right panel: Box plot of concatenated data. Statistical significance was assessed by unpaired t test where *indicates p<0.05 and ** indicates p<0.001. B. T cells isolated from individuals carrying PSMC3 variants were subjected to a 6-h treatment with DMSO (vehicle), C16 (500 nM), H-151 (2 µM), 4µ8C (100 µM) or Guanabenz (50 µM) inhibitors before RNA extraction and RT-qPCR for expression analysis of IFI27, IFI44L, IFIT1, ISG15, RSAD2, IFI44, OASL and MX1. Transcript expression was normalized to GAPDH and data are presented as the foldchange median values of the eight ISG relative to DMSO (gridline) for each patient in each treatment. Columns indicate the foldchange mean values ± SEM of the patient group (n=4) for each treatment. Statistical significance was assessed by ratio paired t test where * indicates p<0.05.

References

    1. Tanaka K, Mizushima T, Saeki Y. The proteasome: molecular machinery and pathophysiological roles. Biol Chem 393, 217–34 (2012). - PubMed
    1. Collins GA, Goldberg AL. The Logic of the 26S Proteasome. Cell 169, 792–806 (2017). - PMC - PubMed
    1. Hetzer MW, Toyama BH, Protein homeostasis: live long, won’t prosper. Nat Rev Mol Cell Biol 14, 55–61 (2013). - PMC - PubMed
    1. Goloubinoff P. Mechanisms of protein homeostasis in health, aging and disease. Swiss Med Wkly 146, w14306 (2016). - PubMed
    1. Seifert U, Bialy LP, Ebstein F, Bech-Otschir D, Voigt A, Schröter F, Prozorovski T, Lange N, Steffen J, Rieger M, Kuckelkorn U, Aktas O, Kloetzel P-M, Krüger E. Immunoproteasomes preserve protein homeostasis upon interferon-induced oxidative stress. Cell 142, 613–24 (2010). - PubMed

Publication types