. 2023 Sep;165(3):613-628.e20.
doi: 10.1053/j.gastro.2023.05.030. Epub 2023 May 29.

Key Genetic Determinants Driving Esophageal Squamous Cell Carcinoma Initiation and Immune Evasion

Affiliations

Key Genetic Determinants Driving Esophageal Squamous Cell Carcinoma Initiation and Immune Evasion

Kyung-Pil Ko et al. Gastroenterology. 2023 Sep.

Abstract

Background & aims: Despite recent progress in identifying aberrant genetic and epigenetic alterations in esophageal squamous cell carcinoma (ESCC), the mechanism of ESCC initiation remains unknown.

Methods: Using CRISPR/Cas 9-based genetic ablation, we targeted 9 genes (TP53, CDKN2A, NOTCH1, NOTCH3, KMT2D, KMT2C, FAT1, FAT4, and AJUBA) in murine esophageal organoids. Transcriptomic phenotypes of organoids and chemokine released by organoids were analyzed by single-cell RNA sequencing. Tumorigenicity and immune evasion of organoids were monitored by allograft transplantation. Human ESCC single-cell RNA sequencing data sets were analyzed to classify patients and find subsets relevant to organoid models and immune evasion.

Results: We established 32 genetically engineered esophageal organoids and identified key genetic determinants that drive ESCC initiation. A single-cell transcriptomic analysis uncovered that Trp53, Cdkn2a, and Notch1 (PCN) triple-knockout induces neoplastic features of ESCC by generating cell lineage heterogeneity and high cell plasticity. PCN knockout also generates an immunosuppressive niche enriched with exhausted T cells and M2 macrophages via the CCL2-CCR2 axis. Mechanistically, CDKN2A inactivation transactivates CCL2 via nuclear factor-κB. Moreover, comparative single-cell transcriptomic analyses stratified patients with ESCC and identified a specific subtype recapitulating the PCN-type ESCC signatures, including the high expression of CCL2 and CD274/PD-L1.

Conclusions: Our study unveils that loss of TP53, CDKN2A, and NOTCH1 induces esophageal neoplasia and immune evasion for ESCC initiation and proposes the CCL2 blockade as a viable option for targeting PCN-type ESCC.

Keywords: CCL2; CDKN2A; Esophageal Squamous Cell Cancer; Immune Evasion; Immunotherapy; NOTCH; Organoids; Patient Stratification; Single-Cell RNA-Sequencing; TP53.


Conflict of interest statement

Disclosure of potential conflicts of interest

No potential conflicts of interest were disclosed.

Figures
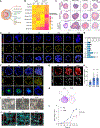
Figure 1.
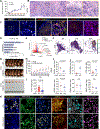
Figure 1.. Genetic ablation of Trp53 and Notchl induces esophageal hyperplasia and de-differentiation.
A, Schematic structure of murine EOs. B, Heatmap visualizing the volume of each EO. C, Hematoxylin-and-eosin (H&E) images; scale bars = 50 μm. D,E, Immunofluorescent (IF) images of EOs (D); MKI67+ cell quantification (E). WT: Trp53floxed/floxed, N: Notchl KO, C: Cdkn2a KO, CN: Cdkn2a KO + Notchl KO, P: Trp53del/del, PN: Trp53del/del + Notchl KO, PC: Trp53del/del + Cdkn2a KO, PCN: Trp53del/del + Cdkn2a KO + Notchl KO; scale bars = 20 μm; ****P < 0.0001. F, IF staining images; scale bars = 20 μm. G,H, BrdU incorporation assays; IF with anti-BrdU antibody (G); BrdU+ cell quantification (H); scale bars = 10 μm; ****p < 0.0001. I,J, Bright-field images of EOs co-cultured with mesenchymal (Tomato [red] fluorescent-expressing) cells (I); E-cadherin/CDHI IF images of EOs (J); scale bars = 50 μm. K,L, Assessing colony formation ability (K) and cell growth rate (L) of EOs.
Figure 2.
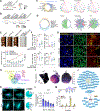
Figure 2.. Single-cell transcriptomic analysis of genetically engineered EOs.
A, Schematic overview of scRNA-seq procedure. Four types of EOs (WT, PC, PN, and PCN) were multiplexed for library preparation. B,C, UMAPs of four integrated datasets. D, The proportion of each cluster was compared to the same cluster of the WT dataset. Statistical significance between 2 groups was assessed by the permutation test. E, RNA velocity-based UMAP projection based on cell types in each dataset. F, Cell trajectory inference by RNA velocity. G, Latent time results projected on the velocity-based UMAP. H, PAGA analysis of RNA velocity–based cell clusters showing the direction of cell lineage on UMAP. The size of the circle corresponds to the cell number. I, Representative marker genes of root cell clusters with simplified lineage trajectories.
Figure 3.
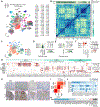
Figure 3.. Transcriptomes of PN and PCN recapitulate the ESCC phenotype.
A, Dot plot of ESCC stem cell markers. B,C, ESCC phenotype–associated cells were marked as ESCC+ cells in Scissor-based UMAP projection (B), and the proportion of ESCC+ cells is shown in bar plot (C). ****p value < 0.0001, as determined by Fisher’s exact test. D,E, Poor survival of ESCC patient–associated cells is displayed as Poor survival+ cells in UMAP (D), and the proportion was analyzed (E). ****p value < 0.0001, as determined by Fisher’s exact test. n.s. = not significant. F, Gene set enrichment analysis of PN or PCN dataset. G, Heatmap clustering of bulk RNA-sequencing from WT, PN, and PCN EOs. H, Enrichr from bulk RNA-seq datasets. PN- or PCN-enriched genes compared to WT were analyzed using Bioplanet and REACTOME databases; TOP5 features of each database are shown; *P value. I, Dot plots of PN or PCN highly expressed genes compared to gene sets of the Kyoto Encyclopedia of Genes and Genomes (KEGG) pathways; dot size: gene number count; dot colors: adjusted P values.
Figure 4.
Figure 4.. In vivo tumorigenicity of PCN with pro-tumorigenic TME.
A, Assessment of tumor growth from C57BL/6 mice subcutaneously injected with either PN or PCN cells. B, H&E images; red arrowheads, mitotic cells; black arrowhead, blood vessel; dotted circle, inflammatory cells; scale bars = 100 μm. C, IF images of transplanted tumors; scale bars = 100 μm. D, Enrichr analysis from DEGs of PCN and PN scRNA-seq datasets. E, Volcano plot of DEGs between PCN and PN datasets. F, Feature plot of Cc/2. G-I, Tumor assessment of mice subcutaneously transplanted with PCN or PCN-Cc/2 KO cells; tumor images (G), tumor volume (H), and weight (I) comparison. J, PDCD1+, PRF1/PERFORIN+, CD8+, CD206+, CD209+, and MKI67+ cells in randomly chosen 630× magnified images were analyzed and plotted. n.s. = not significant. K, PDCD1/PD-1, PRF1/PERFORIN, CD8, CD206, CD209, and MKI67 staining of PCN and PCN-Cc/2 KO–derived tumors. Scale bars = 20 μm.
Figure 5.
Figure 5.. CCL2-CCR2-induced immune evasion during ESCC development.
A, Dot plot visualizing epithelial cells’ Cc/2 expression of each disease status. B, Dot plot showing Ccr2 expression in immune cells based on the disease status. C, Circle plots visualizing ligand-receptor interactions related to CCL pathway in sub-clusters of immune and epithelial cells using ‘CellChat’ package. D, Chord diagrams displaying significant interactions of the CCL pathway in epithelial cells with Tex cell, MDSC, and macrophage sub-clusters. Directions from ligands (epithelial cell) to receptors (immune cell) are indicated. E, Tumors from Sox2-overexpressed PCN (PCNS) cell–transplanted mice were monitored and measured after intraperitoneal injection (days 17, 21, and 25) of Ccr2 inhibitors (CCR2 22 and BMS-813160) or DMSO (vehicle control); ***P < 0.001, ****P < 0.0001. F,G, Microscopic analyses of vehicle-, CCR2 22-, and BMS-813160-treated tumors; quantification (F) of IF images (G); scale bars = 20 μm, *P < 0.05, **P < 0.01, ***P < 0.001, ****P < 0.0001. H, Venn diagram showing overlapped transcription factors of the UCSC ChIP seq database and PN- and PCN-specific regulons. I, Rela regulon projection in regulon-based UMAP of WT, PC, and PCN datasets. The color shows regulon specificity score of the cells. J, Network analysis of transcription factors related to human Ccl2 gene expression. Target genes of transcription factors were refined by iRegulon, and the Ccl2 connections to Taf1 and Rela are displayed. K, Rela immunofluorescence images of 2D-cultured PN and PCN. Nuclei were stained with DAPI. Scale bar = 10 μm. The proportion of cells with nuclear-accumulated Rela was evaluated in PN and PCN cells. L, qRT-PCR results showing Ccl2 expression in PCN cells treated with different doses of NF- κB inhibitor for 6 hrs. M, ChIP assays showing binding activity of Rela to Ccl2 promoter in PN and PCN cells. Putative Rela binding sites (a, b, and c) and non-binding sites in the distant region (d) were analyzed with eluted DNA fragment amplification by PCR.
Figure 6.
Figure 6.. Classification of ESCC patients and PCN relevance.
A, Integrated UMAP of tumor epithelial cells of 69 ESCC patients and PCN organoids. B, Correlation matrix heatmap of integrated datasets of ESCC patients and PCN organoids. The dendrogram showing the distance of each dataset based on principal component analysis with the Pearson correlation (a color spectrum) and pathway scores (TP53, CDKN2A, and NOTCH). PCN was excluded for pathway scores. C, UMAP showing ESCC subtypes. D-F, Dot plots of pathway scores (TP53, CDKN2A, and NOTCH) (D), NF-kB score (E), and CCL2, CD274/PD-L1, and PDCD1LG2/PD-L2 gene expression (F) in ESCC subtypes. G, Dot plot of ESCC subtype’s representative marker genes selected from DEG analysis using the Wilcoxon method. H,I, B2M and CCL2 staining of human ESCC tissue microarray samples (H) and the correlation of the results (I); scale bars = 50 μm (upper) and 20 μm (lower); r: Pearson correlation coefficient; P: P values; N: number of samples. J,K, Heatmap of B2M staining results in tumor samples (J) and B2M, CCL2, and RELA staining results in ESCC patients with adjacent normal and tumor paired samples (K). Immunohistochemistry scores displayed from 1 (lowest) to 3 (highest) expression.

References

    1. Pennathur A, Gibson MK, Jobe BA, et al. Oesophageal carcinoma. The Lancet 2013;381:400–412. - PubMed
    1. Wang GQ, Abnet CC, Shen Q, et al. Histological precursors of oesophageal squamous cell carcinoma: results from a 13 year prospective follow up study in a high risk population. Gut 2005;54:187–92. - PMC - PubMed
    1. Board PATE. Esophageal Cancer Treatment (Adult) (PDQ(R)): Patient Version. PDQ Cancer Information Summaries. Bethesda (mD), 2002.
    1. Bejarano L, Jordao MJC, Joyce JA. Therapeutic Targeting of the Tumor Microenvironment. Cancer Discov 2021; 11:933–959. - PubMed
    1. Hinshaw DC, Shevde LA. The Tumor Microenvironment Innately Modulates Cancer Progression. Cancer Res 2019;79:4557–4566. - PMC - PubMed

Publication types