

Identification of PLOD3 and LRRN3 as potential biomarkers for Parkinson's disease based on integrative analysis
- PMID: 37258507
- PMCID: PMC10232497
- DOI: 10.1038/s41531-023-00527-8
Identification of PLOD3 and LRRN3 as potential biomarkers for Parkinson's disease based on integrative analysis
Abstract
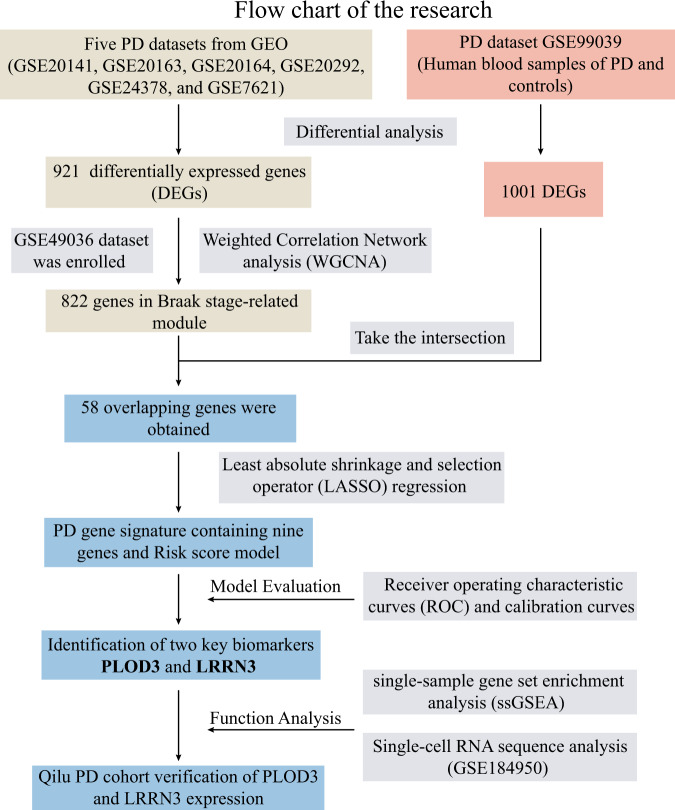
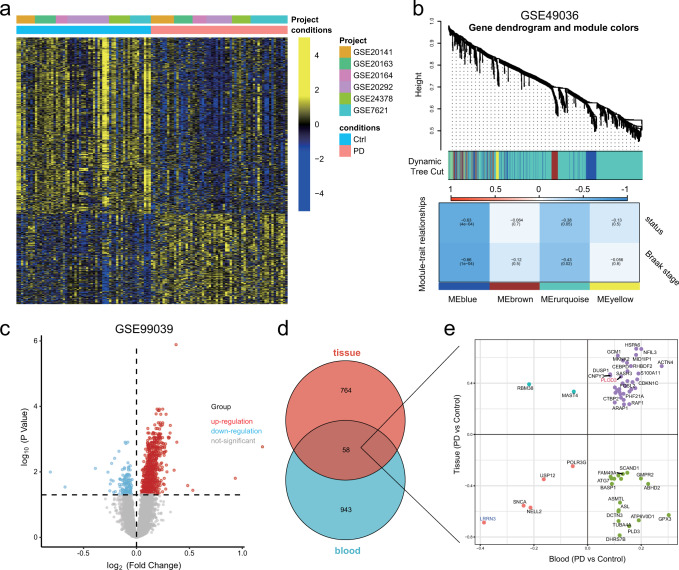
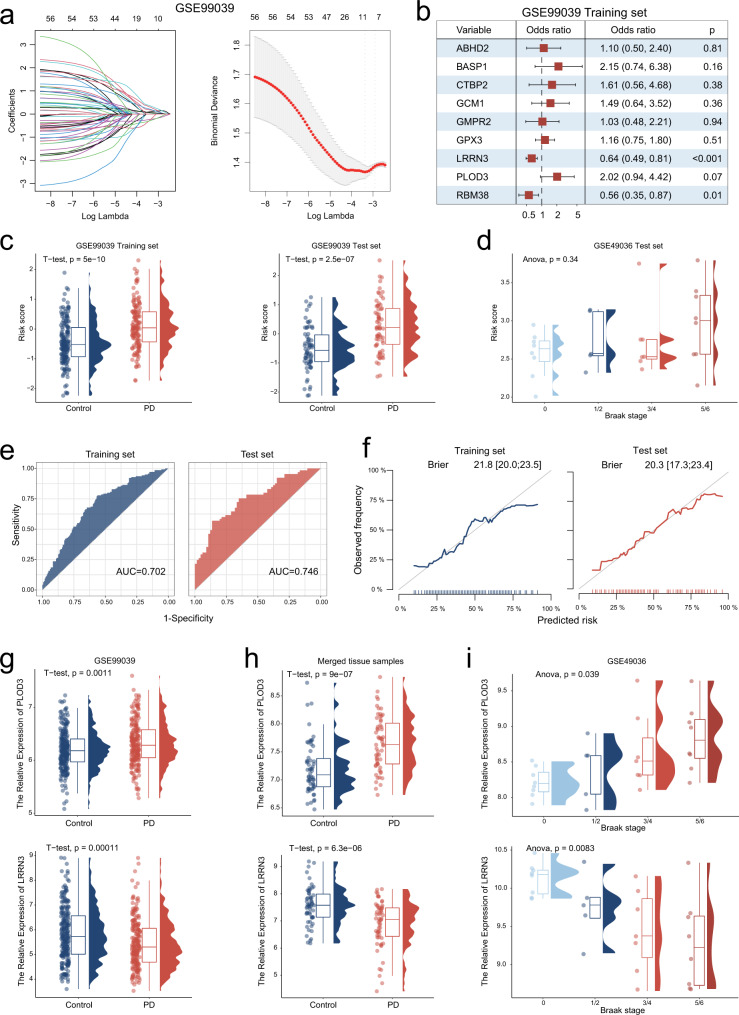
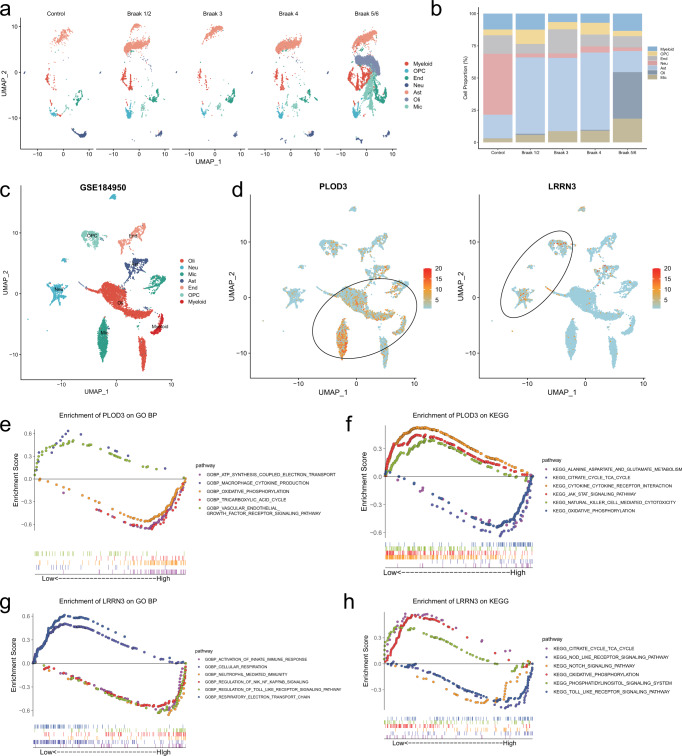
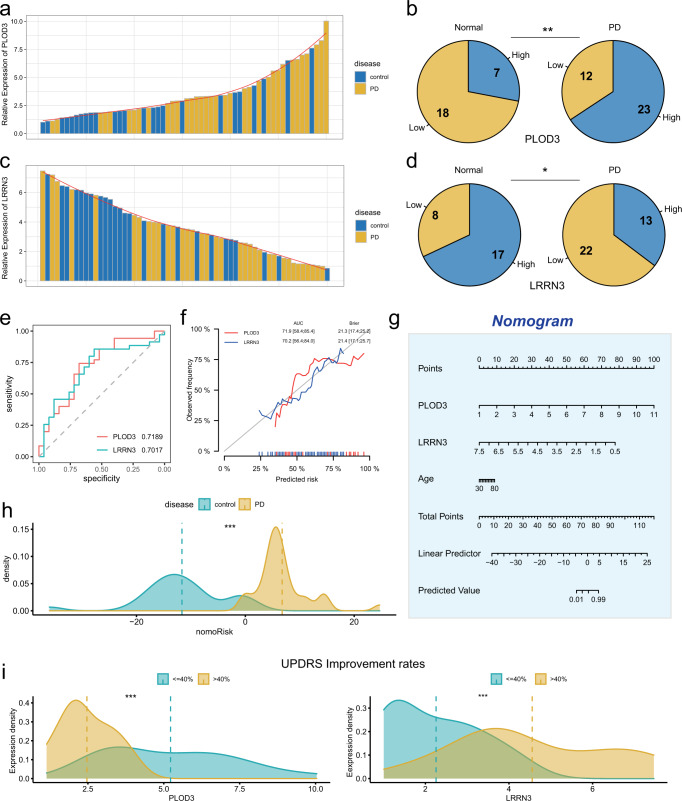
Parkinson's disease (PD) is one of the most prevalent movement disorders and its diagnosis relies heavily on the typical clinical manifestations in the late stages. This study aims to screen and identify biomarkers of PD for earlier intervention. We performed a differential analysis of postmortem brain transcriptome studies. Weighted Gene Co-expression Network Analysis (WGCNA) was used to identify biomarkers related to Braak stage. We found 58 genes with significantly different expression in both PD brain tissue and blood samples. PD gene signature and risk score model consisting of nine genes were constructed using least absolute shrinkage and selection operator regression (LASSO) and logistic regression. PLOD3 and LRRN3 in gene signature were identified to serve as key genes as well as potential risk factors in PD. Gene function enrichment analysis and evaluation of immune cell infiltration revealed that PLOD3 was implicated in suppression of cellular metabolic function and inflammatory cell infiltration, whereas LRRN3 exhibited an inverse trend. The cellular subpopulation expression of the PLOD3 and LRRN3 has significant distributional variability. The expression of PLOD3 was more enriched in inflammatory cell subpopulations, such as microglia, whereas LRRN3 was more enriched in neurons and oligodendrocyte progenitor cells clusters (OPC). Additionally, the expression of PLOD3 and LRRN3 in Qilu cohort was verified to be consistent with previous results. Collectively, we screened and identified the functions of PLOD3 and LRRN3 based the integrated study. The combined detection of PLOD3 and LRRN3 expression in blood samples can improve the early detection of PD.
© 2023. The Author(s).
Conflict of interest statement
The authors declare no competing interests.
Figures
Similar articles
-
Analysis of LRRN3, MEF2C, SLC22A, and P2RY12 Gene Expression in the Peripheral Blood of Patients in the Early Stages of Parkinson's Disease.Biomedicines. 2024 Jun 23;12(7):1391. doi: 10.3390/biomedicines12071391. Biomedicines. 2024. PMID: 39061965 Free PMC article.
-
Identifying the hub gene and immune infiltration of Parkinson's disease using bioinformatical methods.Brain Res. 2022 Jun 15;1785:147879. doi: 10.1016/j.brainres.2022.147879. Epub 2022 Mar 10. Brain Res. 2022. PMID: 35278479
-
Identification of potential diagnostic biomarkers for Parkinson's disease.FEBS Open Bio. 2019 Aug;9(8):1460-1468. doi: 10.1002/2211-5463.12687. Epub 2019 Jul 3. FEBS Open Bio. 2019. PMID: 31199560 Free PMC article.
-
Immune Profiling of Parkinson's Disease Revealed Its Association With a Subset of Infiltrating Cells and Signature Genes.Front Aging Neurosci. 2021 Feb 9;13:605970. doi: 10.3389/fnagi.2021.605970. eCollection 2021. Front Aging Neurosci. 2021. PMID: 33633562 Free PMC article.
-
A computational approach based on weighted gene co-expression network analysis for biomarkers analysis of Parkinson's disease and construction of diagnostic model.Front Comput Neurosci. 2023 Jan 10;16:1095676. doi: 10.3389/fncom.2022.1095676. eCollection 2022. Front Comput Neurosci. 2023. PMID: 36704228 Free PMC article.
Cited by
-
Differential gene expression and immune profiling in Parkinson's disease: unveiling potential candidate biomarkers.BMC Neurol. 2025 Aug 27;25(1):354. doi: 10.1186/s12883-025-04388-x. BMC Neurol. 2025. PMID: 40859216 Free PMC article.
-
Substantia nigra and blood gene signatures and biomarkers for Parkinson's disease from integrated multicenter microarray-based transcriptomic analyses.Front Aging Neurosci. 2025 Apr 7;17:1540830. doi: 10.3389/fnagi.2025.1540830. eCollection 2025. Front Aging Neurosci. 2025. PMID: 40259945 Free PMC article.
-
Analysis of LRRN3, MEF2C, SLC22A, and P2RY12 Gene Expression in the Peripheral Blood of Patients in the Early Stages of Parkinson's Disease.Biomedicines. 2024 Jun 23;12(7):1391. doi: 10.3390/biomedicines12071391. Biomedicines. 2024. PMID: 39061965 Free PMC article.
-
Integrating Blood Biomarkers and Marine Brown Algae-Derived Inhibitors in Parkinson's Disease: A Multi-scale Approach from Interactomics to Quantum Mechanics.Mol Biotechnol. 2024 Sep 3. doi: 10.1007/s12033-024-01262-y. Online ahead of print. Mol Biotechnol. 2024. PMID: 39225961
-
Albendazole ameliorates aerobic glycolysis in myofibroblasts to reverse pulmonary fibrosis.J Transl Med. 2024 Oct 7;22(1):910. doi: 10.1186/s12967-024-05655-0. J Transl Med. 2024. PMID: 39375691 Free PMC article.
References
LinkOut - more resources
Full Text Sources
Miscellaneous
