. 2023 May 31;14(1):3150.
doi: 10.1038/s41467-023-38841-7.

In vivo CRISPR screens reveal Serpinb9 and Adam2 as regulators of immune therapy response in lung cancer

Affiliations

In vivo CRISPR screens reveal Serpinb9 and Adam2 as regulators of immune therapy response in lung cancer

Dzana Dervovic et al. Nat Commun. .

Erratum in

Abstract

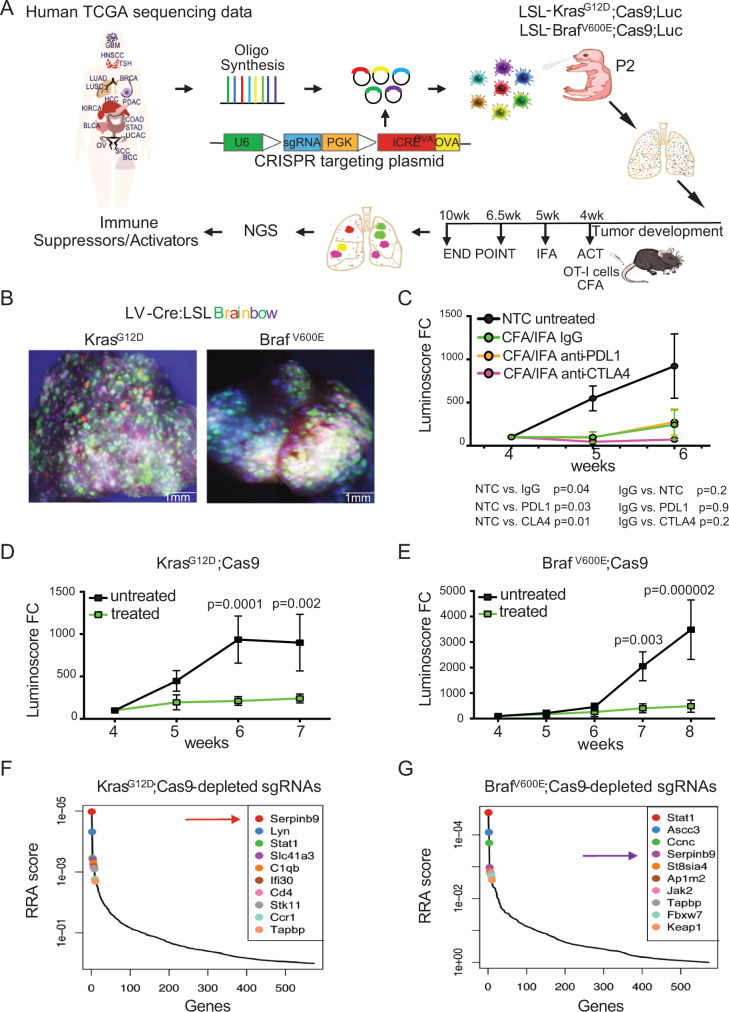
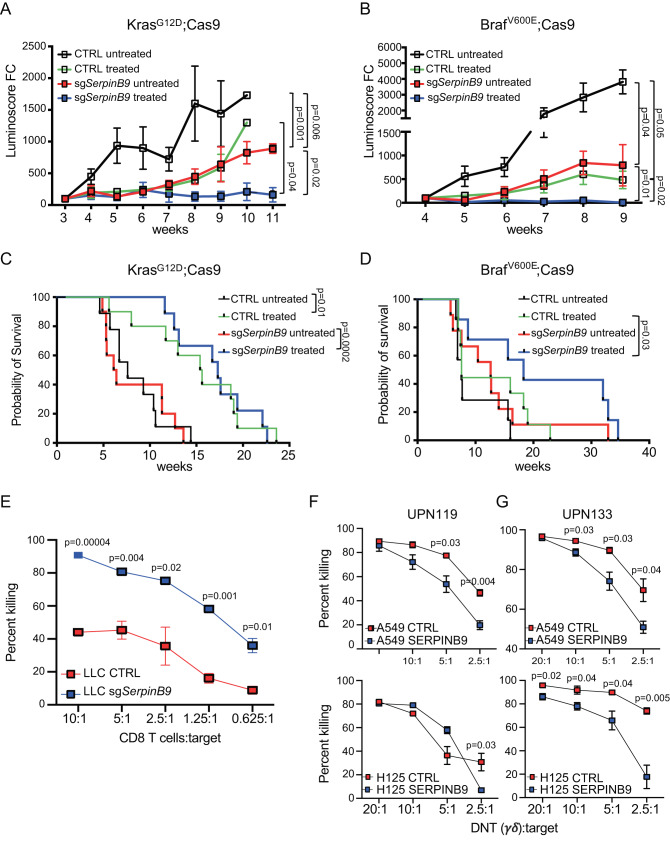
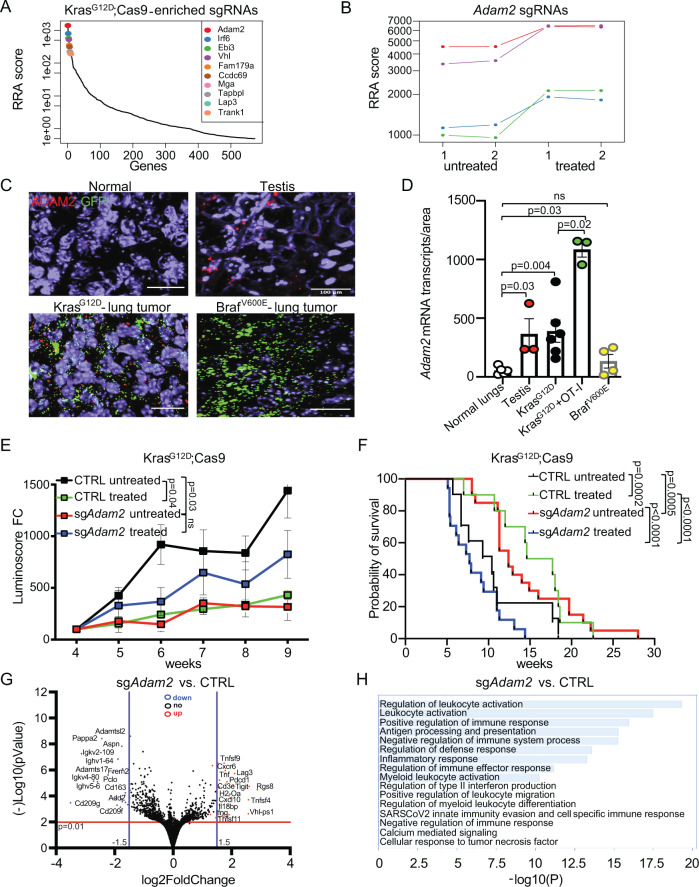
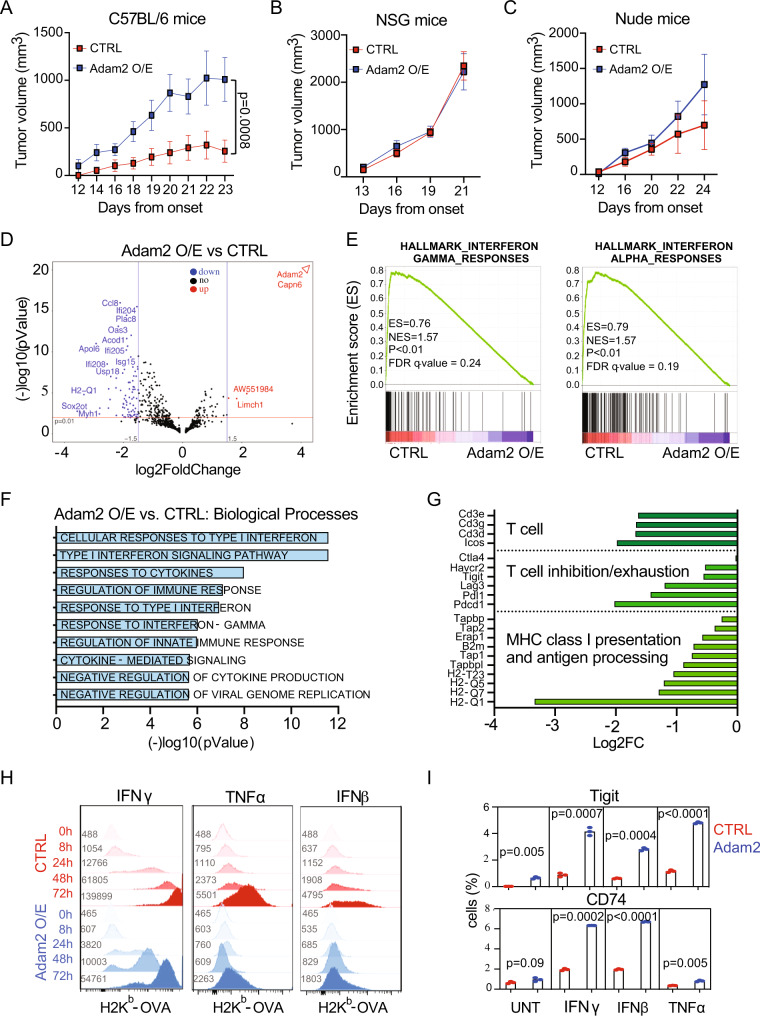
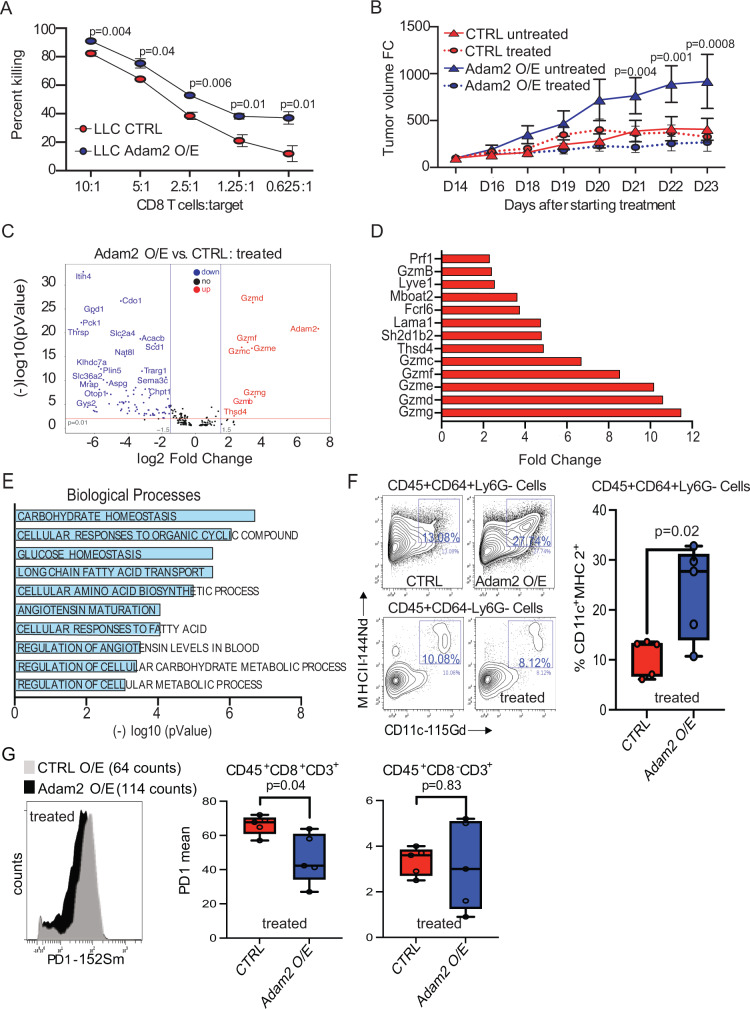
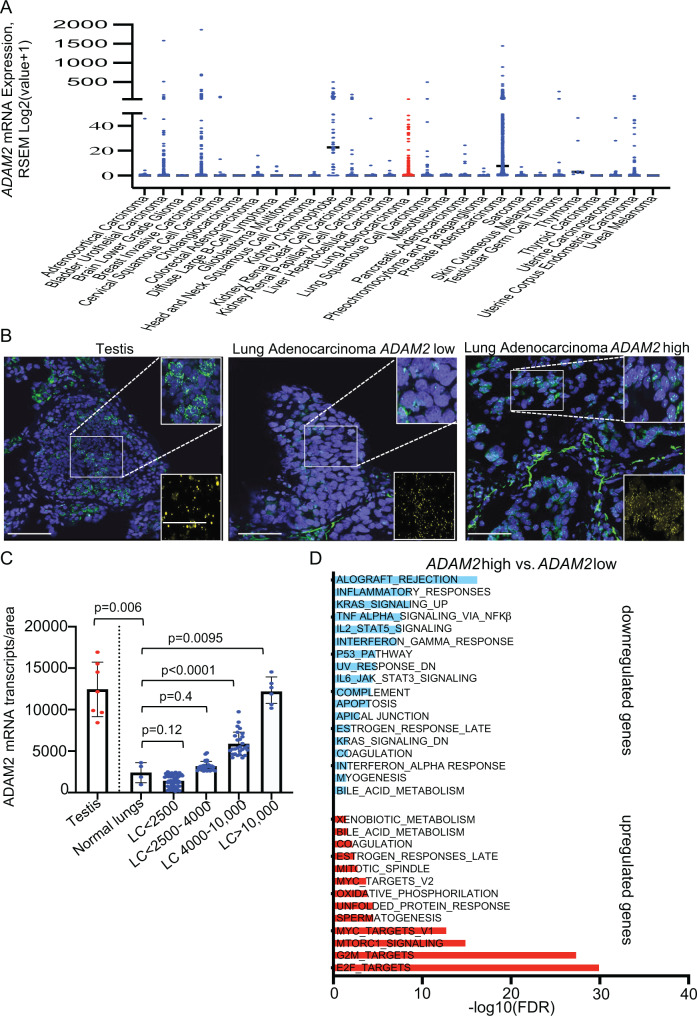
How the genetic landscape governs a tumor's response to immunotherapy remains poorly understood. To assess the immune-modulatory capabilities of 573 genes associated with altered cytotoxicity in human cancers, here we perform CRISPR/Cas9 screens directly in mouse lung cancer models. We recover the known immune evasion factors Stat1 and Serpinb9 and identify the cancer testis antigen Adam2 as an immune modulator, whose expression is induced by KrasG12D and further elevated by immunotherapy. Using loss- and gain-of-function experiments, we show that ADAM2 functions as an oncogene by restraining interferon and TNF cytokine signaling causing reduced presentation of tumor-associated antigens. ADAM2 also restricts expression of the immune checkpoint inhibitors PDL1, LAG3, TIGIT and TIM3 in the tumor microenvironment, which might explain why ex vivo expanded and adoptively transferred cytotoxic T-cells show enhanced cytotoxic efficacy in ADAM2 overexpressing tumors. Together, direct in vivo CRISPR/Cas9 screens can uncover genetic alterations that control responses to immunotherapies.


Conflict of interest statement

The authors declare no competing interests.

Figures

Fig. 1
Fig. 1. In vivo CRISPR screen identifies regulators of immune response in lung cancer.
A Experimental workflow of the in vivo CRISPR screen to identify immune-modulatory cancer genes. A lentiviral sgRNA library targeting mouse homologs of 573 human genes, which are associated with altered cytotoxicity in cancer, is introduced into the lung of tumor-prone mice at P2. Mice are treated with OT-I T cells at week 4 and immunized with OVA emulsified in CFA/IFA. sgRNA representation in genomic tumor DNA are quantified by NGS. Human diagram is a modified version of ‘Design by Freepik’ (www.freepik.com) B Representative whole mount immunofluorescence images of the lung from LSL-KrasG12D;LSL-Confetti and LSL-BrafV600E;LSL-Confetti mice transduced with Cre lentivirus (n = 6 biologically independent samples for each group). C Growth curves of tumors in KrasG12D;Cas9 mice treated with OT-I cells at week 4 in the presence or absence of PDL1 or CTLA4 blocking antibodies (n = 5 for each group). The p values for tumor growth were determined by an unpaired two-sided t-test. The data are presented as the mean ± SEM. D Growth curves of tumors in KrasG12D;Cas9 mice. (untreated n = 7; OT-I treated n = 10). The p values for tumor growth were determined by multiple unpaired t-test. The data are presented as the mean ± SEM. E Growth curves of tumors in BrafV600E;Cas9 mice (untreated n = 6; OT-I treated n = 6). The p values for tumor growth were determined by multiple unpaired t-test. The data are presented as the mean ± SEM. Top 10 genes whose sgRNAs are depleted in lungs of ACT-treated KrasG12D;Cas9 (F) and -Braf V600E;Cas9 mice (G) (untreated, n = 10; treated, n = 10). RRA, Robust Rank Aggregation, which identifies statistically significant depleted genes across the two experimental conditions with the p values gained from the negative binomial (NB) model used by MAGeCK RRA to rank the sgRNAs.
Fig. 2
Fig. 2. SERPINB9 regulates T-cell-mediated killing and lung tumor growth.
A Growth curves of tumors in KrasG12D;Cas9 mice transduced with sgNTC or sgSerpinb9 untreated or ACT treated. (CTRL: untreated n = 10; treated, n = 10 for each group) The p values for tumor growth were determined by an unpaired two-sided t-test with Welch’s correction. The data are presented as the mean ± SEM. B Growth curves of tumors in BrafV600E;Cas9 mice transduced with sgNTC or sgSerpinb9 untreated or ACT treated. (CTRL: untreated n = 7 and treated n = 9; sgSerpinb9: untreated n = 6 and treated n = 6). The p values for tumor growth were determined by an unpaired two-sided t-test with Welch’s correction. The data are presented as the mean ± SEM C Tumor-free survival of KrasG12D;Cas9 mice from (A). D Tumor-free survival of Braf V600E;Cas9 mice from (B). Comparison of survival curves was performed by Log-rank (Mantel–Cox test). E The effect of Serpinb9 knockout on T-cell-mediated tumor killing. LLC cells transduced with sgNTC or sgSerpinb9 and labeled with CFSE were used as targets (T) and cocultured with activated OT-I effector cells (E) at different E:T ratios for 4 h. Flow cytometry analysis was used to quantify the percentage of target cells killing at different E:T ratios. Data presents mean ± s.e.m. of three technical replicates analyzed by multiple unpaired t-tests. One representative experiment out of three independent experiments is shown. F, G The effect of SERPINB9 overexpression on DNT cell-mediated killing. Human LUAD cell lines, A549 and H125 labeled with CFSE were used as targets (T) and cocultured with activated and expanded DNT effector cells (E) from two different donors (UPN119, UPN133) at different E:T ratios for 18 h. Data presents mean ± s.e.m. of three technical replicates analyzed by multiple unpaired t-tests. One representative experiment out of two independent experiments is shown for each donor.
None
Fig. 3 ADAM2 regulates leukocyte activation and cytokines in Kras-driven lung cancer.
A Top 10 genes whose sgRNAs are enriched in lungs of ACT-treated KrasG12D;Cas9 mice. (untreated n = 10; treated n = 10; RRA, Robust Rank Aggregation, which identifies statistically significant enriched genes across the two experimental conditions with the p values gained from the negative binomial (NB) model used by MAGeCK RRA to rank the sgRNAs). B Relative abundance of 4 different sgRNAs targeting Adam2 depicted by different colors in 2 replicates of untreated and 2 replicates of ACT-treated KrasG12D lungs (n = 5 lungs for each replicate). C RNAscope analysis of Adam2 (red) and GFP (green; tumor cells) expression in indicated tissues (n = 5 normal lungs; n = 3 testis; n = 6 KrasG12DCas9; n = 3 KrasG12DCas9 + OT-I; n = 4 BrafV600ECas9 biologically independent samples). The scale bar represents 100 µm. D Quantification of Adam2 transcripts from (C) with p values calculated by unpaired two-sided student’s t-test; ns non-significant; data are mean ± s.e.m. E Growth curves of tumors in KrasG12D;Cas9 mice transduced with sgNTC (CTRL untreated n = 8; CTRL treated n = 12) or sgAdam2 (untreated n = 14; treated n = 17; sg1 and sg2 are shown combined here and are shown separately in Supplementary Fig. 11d, e). The p values for tumor growth were determined by an unpaired two-sided t-test with Welch’s correction. The data are presented as the mean ± SEM. F Tumor-free survival of KrasG12D;Cas9 mice transduced with sgNTC (untreated, n = 10; treated, n = 10) vs. sgRNA sgAdam2 (untreated, n = 20; treated, n = 18; sg1 and sg2 are shown combined here and are shown separately in Supplementary Fig. 11f, g); Comparison of survival curves was performed by Log-rank (Mantel–Cox test). Data are mean ± s.e.m. G Volcano plot showing differentially expressed genes (DEGs) in sgAdam2 KO (n = 4) compared to CTRL (n = 4) lung tumors isolated from C57BL/6 mice, where log2 FC indicates the mean expression and (−)log10 adjusted p value level for each gene. The blue dots denote downregulated gene expression, the red dots denote upregulated expression, and black dots denote the gene expression without marked difference. Data represents three independent biological samples for each group. H Bar graph showing Gene Ontology of the DEGs (FC > 2, p < 0.05) downregulated in sgAdam2 KO compared to CTRL lung tumors assigned to Biological Process.
Fig. 4
Fig. 4. ADAM2 promotes tumorigenesis by suppressing IFN and TNF immune responses.
AC Tumor growth of CTRL and Adam2 O/E LLC cells allografted subcutaneously into C57BL/6 mice (A, n = 4 CTRL, n = 5 Adam2), NSG mice (B, n = 8) and Nude mice (C, n = 5) examined over three independent experiments. The p values for tumor growth were determined by an unpaired two-sided t-test with Welch’s correction. The data are presented as the mean ± SEM. D Volcano plot showing differentially expressed genes (DEGs) in Adam2 O/E compared to CTRL tumors isolated from C57BL/6 mice, where log2 FC indicates the mean expression and (−)log10 adjusted p-value level for each gene. The blue dots denote downregulated gene expression, the red dots denote upregulated expression, and black dots denote the gene expression without marked difference. Data represents three independent biological samples for each group. E GSEA plots showing Hallmarks of IFNγ and IFNα pathways between Adam2 O/E compared to CTRL tumors isolated from C57BL/6 mice (A) with FDR < 25% and p < 1%. F Bar graph showing Gene Ontology of the DEGs (FC > 2, p < 0.05) downregulated in Adam2 O/E compared to CTRL tumors assigned to Biological Process isolated from C57BL/6 mice (A). G Bar graph depicting selected downregulated genes in Adam2 O/E compared to CTRL tumors categorized by immune function isolated from C57BL/6 mice (A). H Cell surface expression of MHC-I H2Kb-OVA on CTRL and Adam2 O/E LLC cells after treatment with 100 ng/ml of IFNγ, IFNβ or TNFα over the indicated time course. Numbers denote mean fluorescence intensity (MFI). I Percentage of CTRL and Adam2 O/E LLC cells expressing CD74 and Tigit after IFNγ, IFNβ or TNFα treatment (100 ng/ml each, 24 h). Data presents mean ± s.e.m. of three technical replicates analyzed by two-sided student’s t-test examined. One representative experiment out of three independent experiments is shown.
Fig. 5
Fig. 5. ADAM2 increases cytolytic activity of TAA-specific CD8 T cells.
A The effect of Adam2 overexpression in LLC cells on CD8+ OT-I T-cell-mediated killing. CTRL or Adam2 O/E cells labeled with CFSE were used as targets (T) and cocultured with activated OT-I CD8 T cells (E) at different E:T ratios. Flow cytometry analysis was used to calculate the ratio of killed cells at different E:T ratios. Data presents mean ± s.e.m. of four technical replicates analyzed by two-sided student’s t-test examined. One representative experiment out of three independent experiments is shown. B Tumor growth of CTRL or Adam2 O/E LLC cells allografted into C57BL/6 mice, which were subsequently treated with OT-I T cells (n = 4) or left untreated (n = 4). Three independent experiments were performed. C Volcano plot showing differentially expressed genes in OT-I treated CTRL and Adam2 O/E tumors isolated from C57BL/6 mice where log2 FC indicates the mean expression and (−)log10 adjusted p value level for each gene. The blue dots denote downregulated gene expression, the red dots denote upregulated expression, and black dots denote the gene expression without marked difference. Data represents three independent biological samples for each group. D Bar plot showing 12 top upregulated genes between OT-I treated Adam2 O/E versus CTRL tumors isolated from C57BL/6 mice. Data represents three independent biological samples for each group. E Bar graph showing Gene Ontology of the DEGs (FC > 2, p < 0.05) downregulated in OT-I treated Adam2 O/E compared to CTRL tumors assigned to Biological Process. Data represents three independent biological samples for each group. F CyTOF analysis showing the expression of MHCII and CD11c in CD45+ CD64+ Ly6G cells from OT-I treated CTRL and Adam2 O/E tumors isolated from C57BL/6 mice (n = 6 biologically independent samples for each group examined over two independent experiments). Box and whiskers plots illustrate the median, first and third quartiles, maximum and minimum of relative MHCII and CD11c abundance between two groups analyzed by two-sided student’s t-test. G CyTOF analysis showing PD1 surface expression on pre-gated CD45+CD8+CD3+ cell population from OT-I treated CTRL and Adam2 O/E tumors isolated from C57BL/6 mice. Bar plots representing the frequency of PD1 surface expression on CD45+CD8+CD3+ and CD45+CD8-CD3+ cells from OT-I treated CTRL and Adam2 O/E tumors isolated from C57BL/6 mice (n = 6 for each group examined over two independent experiments). Box and whiskers plots illustrate the median, first and third quartiles, maximum and minimum of relative PD1 abundance between two groups analyzed by two-sided student’s t-test.
Fig. 6
Fig. 6. ADAM2 is a bona fide cancer-testis antigen associated with reduced inflammatory responses and increased cancer hallmark pathways in human LUAD.
A Pan-cancer TCGA analysis reveals increased ADAM2 mRNA expression in multiple cancers. B RNAscope analysis of ADAM2 (green) and EPCAM (yellow) expression in testis and LUAD samples. C Quantification of ADAM2 transcripts from (B) in indicated tissues (n = 5 normal lungs; n = 8 testis; n = 96 LUAD). Data were analyzed by two-sided student’s t-test and present mean ± s.e.m. D Pathway enrichment analysis of Cancer Hallmark gene sets in 510 TCGA LUAD samples. Bar plots showing the pathways that were significantly enriched for upregulated and downregulated genes in the TCGA LUAD cohort (FDR < 0.05). Pathways enriched for upregulated genes are shown in red and pathways enriched for downregulated genes are shown in blue. -log10 transformed FDR-adjusted p values are shown on the x-axis.

References

    1. Takahashi T, et al. p53: a frequent target for genetic abnormalities in lung cancer. Science. 1989;246:491–494. - PubMed
    1. Rodenhuis S, et al. Incidence and possible clinical significance of K-ras oncogene activation in adenocarcinoma of the human lung. Cancer Res. 1988;48:5738–5741. - PubMed
    1. Jaramillo MC, Zhang DD. The emerging role of the Nrf2-Keap1 signaling pathway in cancer. Genes Dev. 2013;27:2179–2191. - PMC - PubMed
    1. Lignitto L, et al. Nrf2 activation promotes lung cancer metastasis by inhibiting the degradation of Bach1. Cell. 2019;178:316–329.e318. - PMC - PubMed
    1. Singh A, et al. Dysfunctional KEAP1-NRF2 interaction in non-small-cell lung cancer. PLoS Med. 2006;3:e420. - PMC - PubMed

Publication types