Randomized Controlled Trial
. 2023 May 31;14(1):3161.
doi: 10.1038/s41467-023-38778-x.

Host-diet-gut microbiome interactions influence human energy balance: a randomized clinical trial

Affiliations
Randomized Controlled Trial

Host-diet-gut microbiome interactions influence human energy balance: a randomized clinical trial

Karen D Corbin et al. Nat Commun. .

Abstract

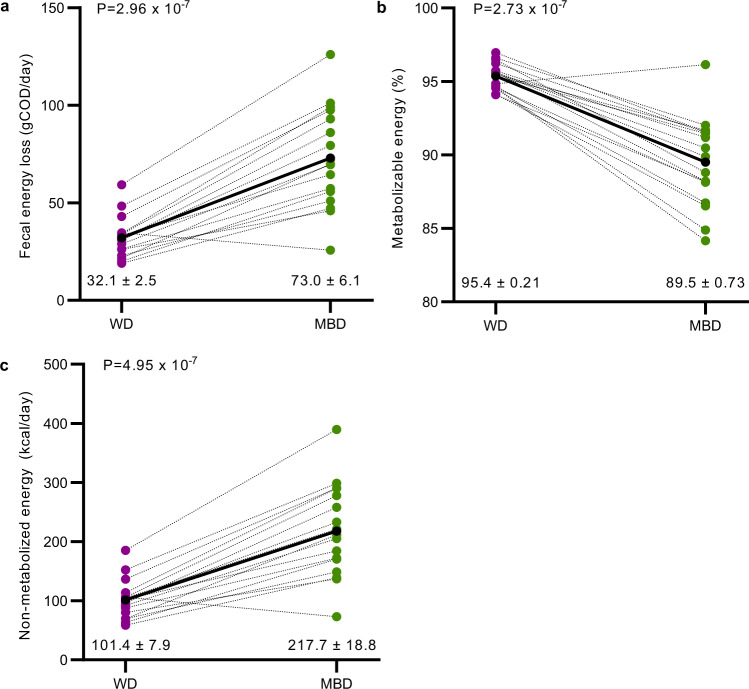
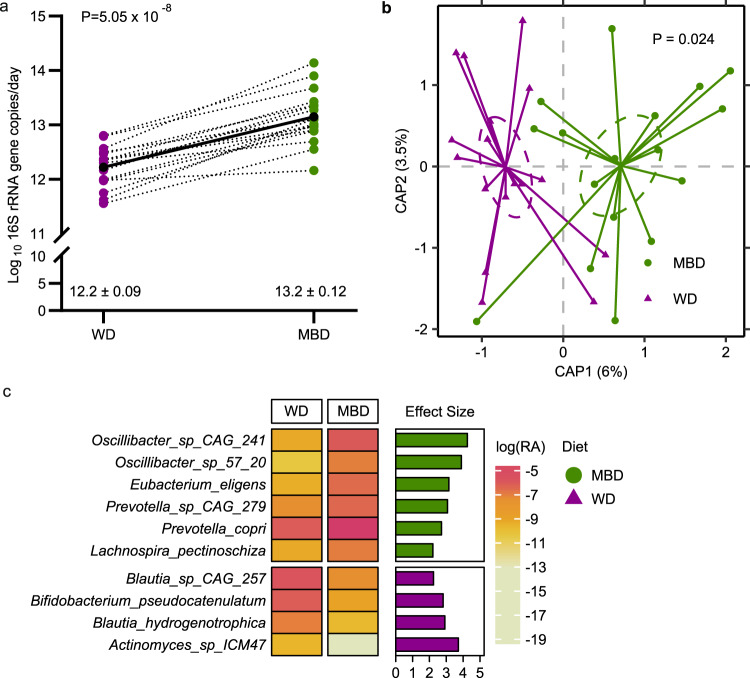
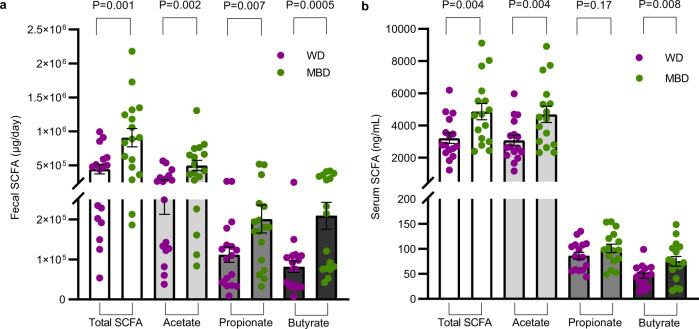
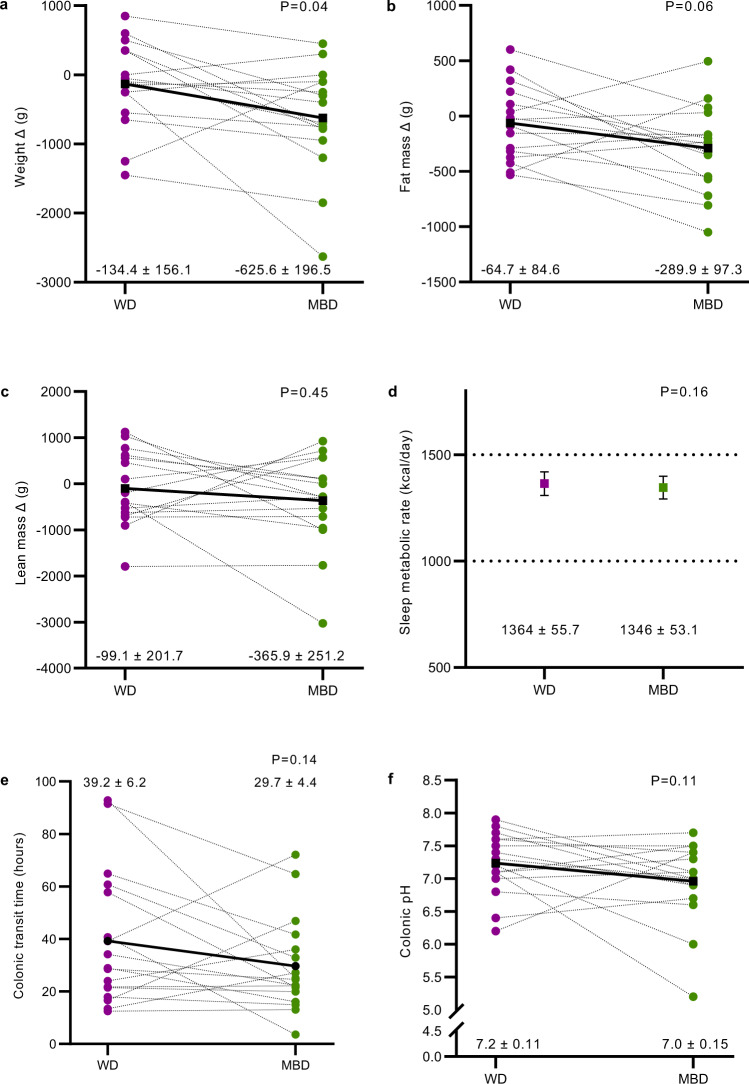
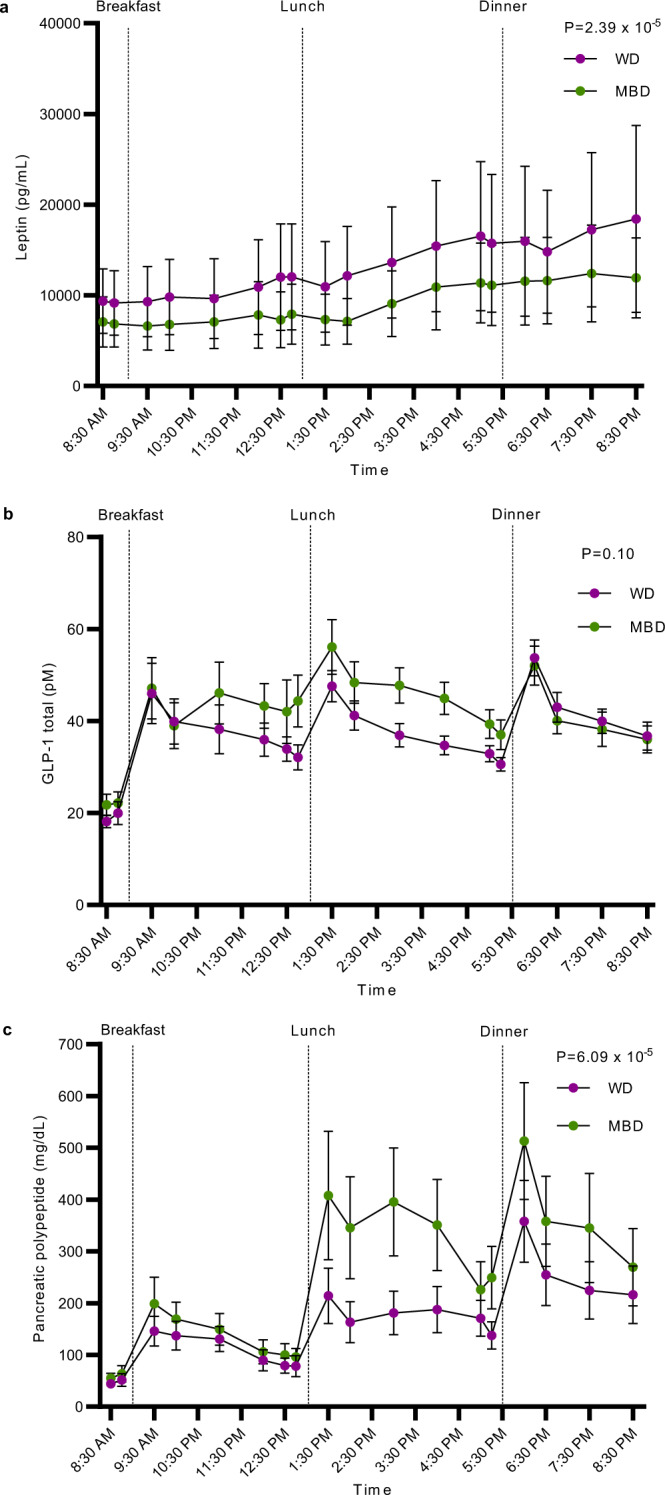
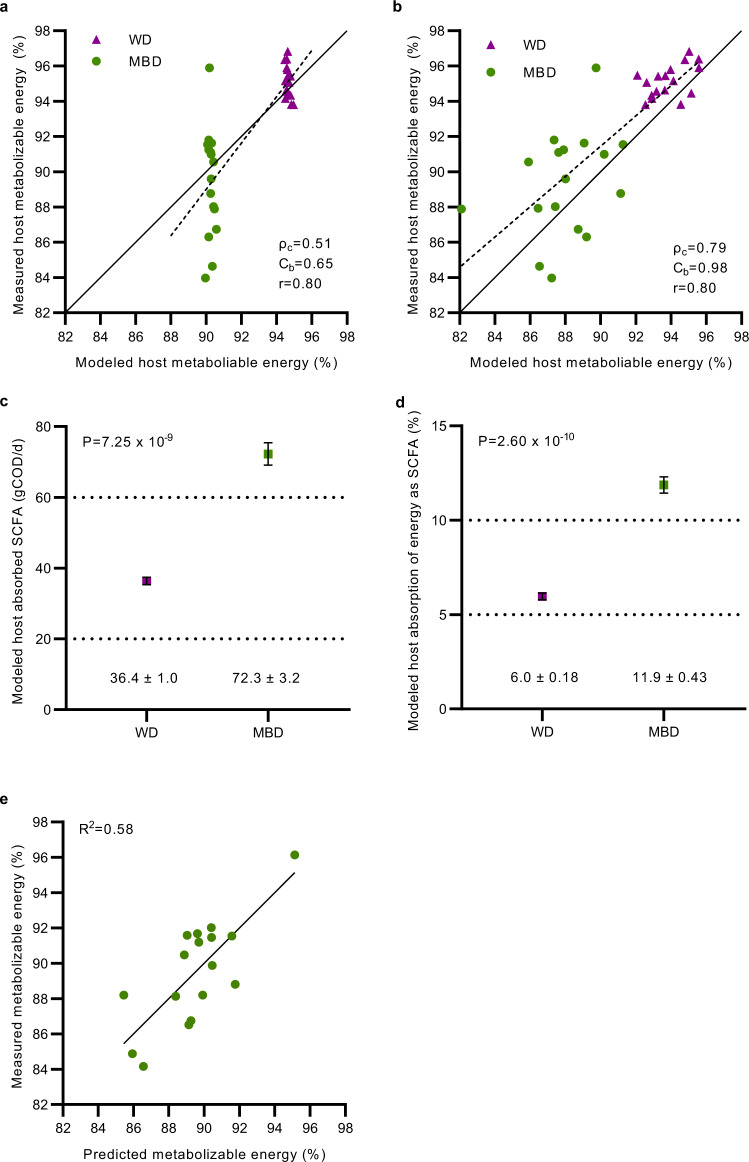
The gut microbiome is emerging as a key modulator of human energy balance. Prior studies in humans lacked the environmental and dietary controls and precision required to quantitatively evaluate the contributions of the gut microbiome. Using a Microbiome Enhancer Diet (MBD) designed to deliver more dietary substrates to the colon and therefore modulate the gut microbiome, we quantified microbial and host contributions to human energy balance in a controlled feeding study with a randomized crossover design in young, healthy, weight stable males and females (NCT02939703). In a metabolic ward where the environment was strictly controlled, we measured energy intake, energy expenditure, and energy output (fecal and urinary). The primary endpoint was the within-participant difference in host metabolizable energy between experimental conditions [Control, Western Diet (WD) vs. MBD]. The secondary endpoints were enteroendocrine hormones, hunger/satiety, and food intake. Here we show that, compared to the WD, the MBD leads to an additional 116 ± 56 kcals (P < 0.0001) lost in feces daily and thus, lower metabolizable energy for the host (89.5 ± 0.73%; range 84.2-96.1% on the MBD vs. 95.4 ± 0.21%; range 94.1-97.0% on the WD; P < 0.0001) without changes in energy expenditure, hunger/satiety or food intake (P > 0.05). Microbial 16S rRNA gene copy number (a surrogate of biomass) increases (P < 0.0001), beta-diversity changes (whole genome shotgun sequencing; P = 0.02), and fermentation products increase (P < 0.01) on an MBD as compared to a WD along with significant changes in the host enteroendocrine system (P < 0.0001). The substantial interindividual variability in metabolizable energy on the MBD is explained in part by fecal SCFAs and biomass. Our results reveal the complex host-diet-microbiome interplay that modulates energy balance.


Conflict of interest statement

The authors declare no competing interests.

Figures

Fig. 1
Fig. 1. The microbiome enhancer diet reduced host metabolizable energy.
a Daily energy lost by each participant in feces on the WD vs. MBD in grams COD/day (gCOD/day). b Host metabolizable energy based on the proportion of fecal COD to dietary intake. c Calculated host non-metabolizable energy (kcals). All data reported as are mean ± s.e.m. n = 17 per diet for all panels. P values are from linear mixed effects regression models and denote a statistically significant effect of diet on each endpoint. Source data are provided as a Source Data file. COD Chemical Oxygen Demand, MBD Microbiome Enhancer Diet (green), WD Western Diet (purple).
Fig. 2
Fig. 2. Diet modulated the gut microbiome.
a Fecal bacterial 16S rRNA gene copy number (a surrogate of biomass); P value is from linear mixed effects regression model and denotes a statistically significant effect of diet on 16S rRNA gene copy number. b Beta-diversity (Bray–Curtis Dissimilarity). P value is from PERMANOVA test and denotes a statistically significant effect of diet on Bray–Curtis Dissimilarity metric. c Heatmap showing the natural-log-transformed mean relative abundance of species whose relative abundance was significantly different by diet (based on MaAsLin2); bar plot shows the effect size of the regression coefficient from compound Poisson regression models comparing the relative abundance of each species by diet. Species shown in this figure were significantly different by diet (P values were corrected to produce Q values using the Benjamini–Hochberg method; Q < 0.05), and the diet difference had an effect size ≥2. n = 17 per diet for all panels. Source data are provided as a Source Data file. CAP Canonical Analysis of Principal Coordinates, MBD Microbiome Enhancer Diet (green), WD Western Diet (purple).
Fig. 3
Fig. 3. Increased microbial fermentation on the microbiome enhancer diet.
a, b Fecal and circulating short chain fatty acids. Data are presented as mean ± s.e.m (n = 17 per diet for panel a and n = 16 for panel b). Error bars in panels a and b are displayed as s.e.m. P values are from linear mixed effects regression models and denote a statistically significant effect of diet on fecal and serum SCFAs. Source data are provided as a Source Data file. MBD Microbiome Enhancer Diet (green), SCFA short-chain fatty acids, WD Western Diet (purple).
Fig. 4
Fig. 4. Host energy stores and energy expenditure in response to diet-gut microbiome interactions.
ac Weight, fat mass and lean mass changes on the WD vs. MBD; n = 16 per diet. d Energy expenditure (sleep metabolic rate extrapolated to 24-h); e, f Colonic transit time and median colonic pH; n = 17 per diet for all panels. Error bars in panel c are displayed as s.e.m. P values are from linear mixed effects regression models and denote a statistically significant effect of diet on each endpoint. Source data are provided as a Source Data file.
Fig. 5
Fig. 5. An adipose-pancreas-gut appetite-modulating axis in response to diet.
a–c Leptin, GLP-1, and pancreatic polypeptide iAUC, respectively (N = 15 per diet). All data reported as mean ± s.e.m. P values are from linear mixed effects regression models and denote a statistically significant effect of diet (or trend for an effect in the case of total GLP-1) on each hormone. Source data are provided as a Source Data file. GLP-1 Glucagon-Like Peptide 1, iAUC Incremental Area Under the Curve, MBD Microbiome Enhancer Diet (green), WD Western Diet (purple).
Fig. 6
Fig. 6. The contributions of the gut microbiome to host metabolizable energy.
a Concordance correlation coefficient plot between predicted (by modeling) and measured host metabolizable energy (ME) using the same fixed CTT (48 h) for all participants. Dashed line is a simple linear regression between pairs of data; solid line is the identity line (perfect reproducibility between measured and modeled data). b The same plot with each participant’s measured CTT. c Plot shows total energy absorbed by the host as SCFAs in grams COD per day (gCOD/day) for the WD and the MBD. gCOD were calculated as the sum of acetate, propionate, n-butyrate, and iso-butyrate absorbed. d The percentage of COD absorbed as SCFAs adjusted for total energy intake (in gCOD/day). e Scatterplot of predicted and measured host ME on the MBD; predicted host ME was obtained from the model selection procedure which estimated that 6-day fecal propionate and 16S rRNA gene copy number (a surrogate of biomass) jointly explained 58% of the variance in host ME. Thus, the R-squared for the simple linear regression of predicted and measured host ME is 0.58. N = 17 per diet for all panels. For panels c and d, data reported as mean with error bars showing the s.e.m. A paired samples t-test by diet was used to generate the P values in panels c and d. Source data are provided as a Source Data file. ρc concordance correlation coefficient (reproducibility), Cb bias correction factor (accuracy), COD Chemical Oxygen Demand, CTT Colonic Transit Time, Host ME Host Metabolizable Energy, IQR Interquartile Range, MBD Microbiome Enhancer Diet (green), SCFA short-chain fatty acids, r Pearson’s correlation coefficient (precision), RA Relative Abundance, WD Western Diet (purple).

Update of

References

    1. Cani PD. Human gut microbiome: hopes, threats and promises. Gut. 2018;67:1716–1725. doi: 10.1136/gutjnl-2018-316723. - DOI - PMC - PubMed
    1. Fan Y, Pedersen O. Gut microbiota in human metabolic health and disease. Nat. Rev. Microbiol. 2021;19:55–71. doi: 10.1038/s41579-020-0433-9. - DOI - PubMed
    1. Yu Y, Yang W, Li Y, Cong Y. Enteroendocrine cells: sensing gut microbiota and regulating inflammatory bowel diseases. Inflamm. Bowel Dis. 2019;26:11–20. doi: 10.1093/ibd/izz217. - DOI - PMC - PubMed
    1. Zhao L. The gut microbiota and obesity: from correlation to causality. Nat. Rev. Microbiol. 2013;11:639–647. doi: 10.1038/nrmicro3089. - DOI - PubMed
    1. Rosenbaum M, Knight R, Leibel RL. The gut microbiota in human energy homeostasis and obesity. Trends Endocrinol. Metab. 2015;26:493–501. doi: 10.1016/j.tem.2015.07.002. - DOI - PMC - PubMed

Publication types

Substances

Associated data