. 2023 May 31;14(1):3155.
doi: 10.1038/s41467-023-38891-x.

Multi-omic features of oesophageal adenocarcinoma in patients treated with preoperative neoadjuvant therapy

Affiliations

Multi-omic features of oesophageal adenocarcinoma in patients treated with preoperative neoadjuvant therapy

Marjan M Naeini et al. Nat Commun. .

Abstract

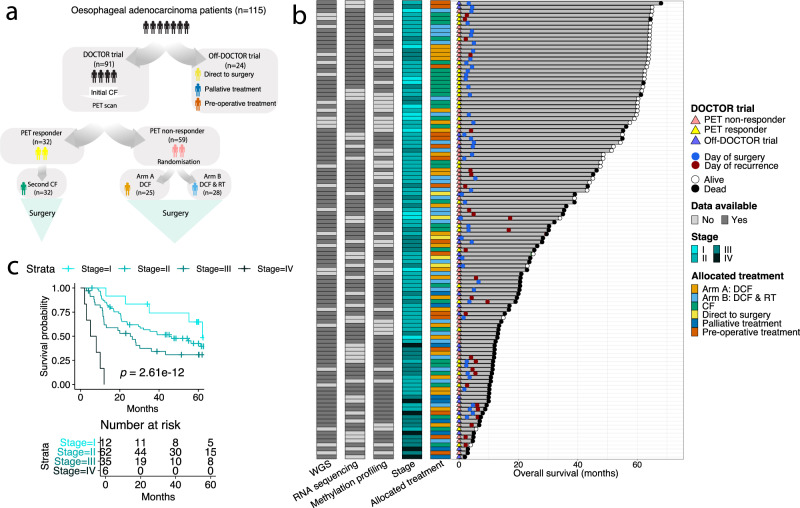
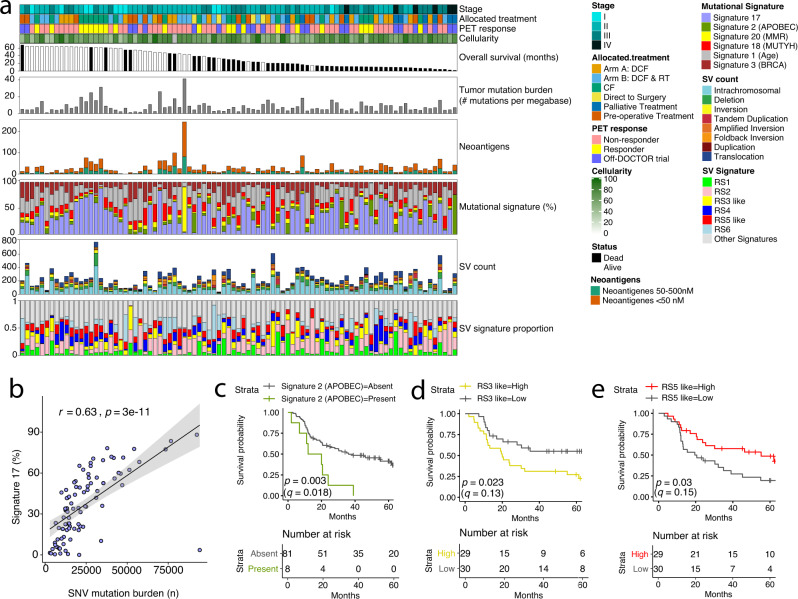
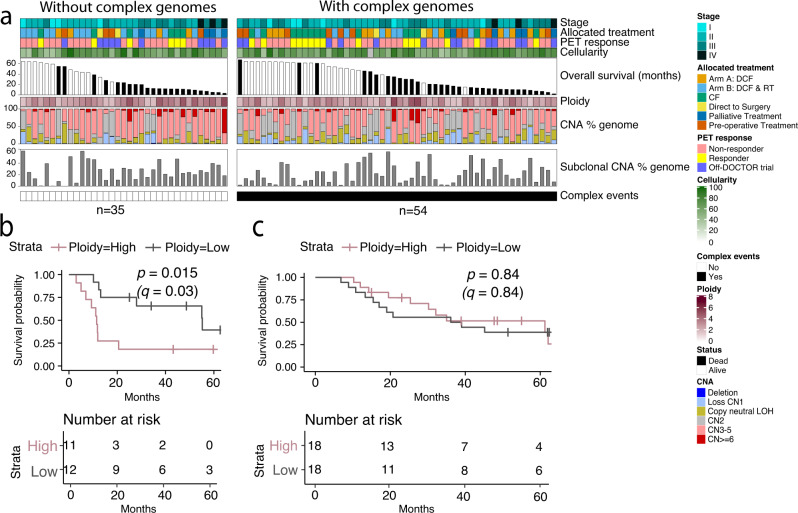
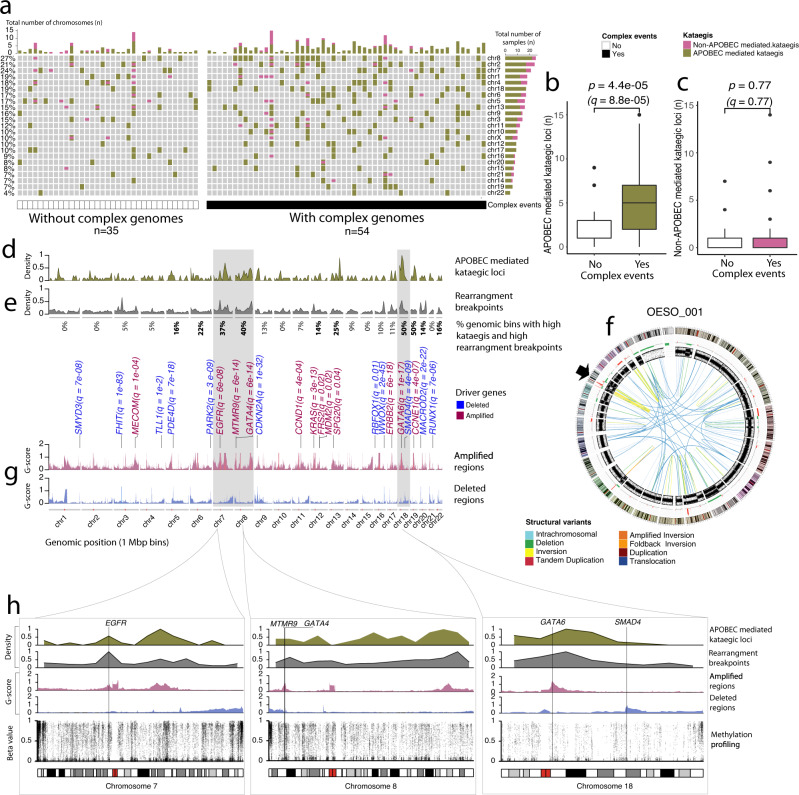
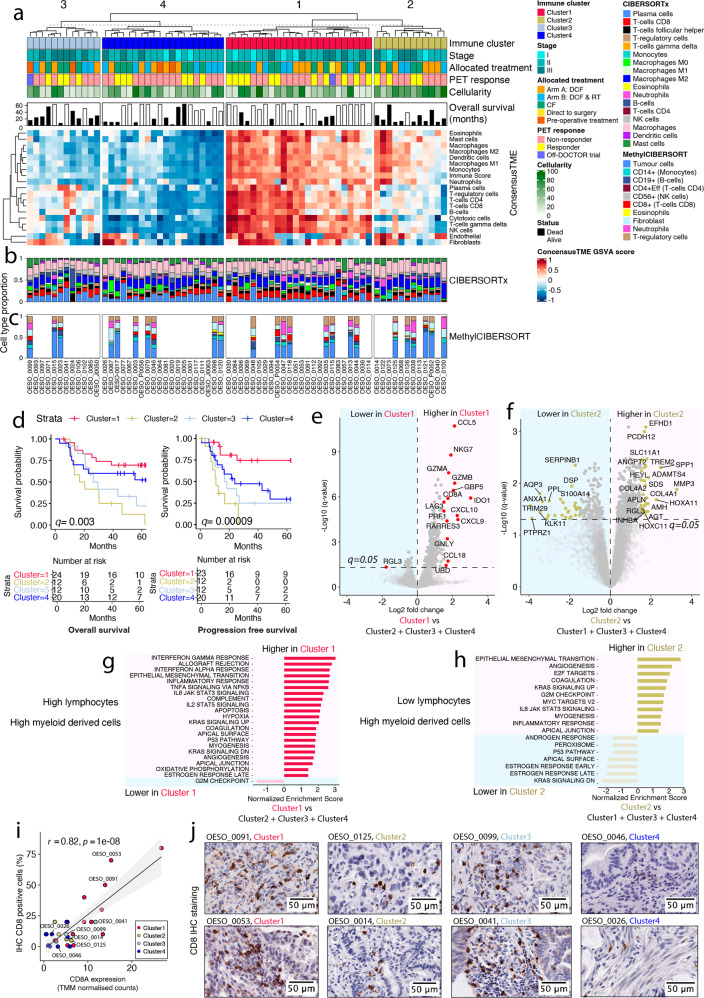
Oesophageal adenocarcinoma is a poor prognosis cancer and the molecular features underpinning response to treatment remain unclear. We investigate whole genome, transcriptomic and methylation data from 115 oesophageal adenocarcinoma patients mostly from the DOCTOR phase II clinical trial (Australian New Zealand Clinical Trials Registry-ACTRN12609000665235), with exploratory analysis pre-specified in the study protocol of the trial. We report genomic features associated with poorer overall survival, such as the APOBEC mutational and RS3-like rearrangement signatures. We also show that positron emission tomography non-responders have more sub-clonal genomic copy number alterations. Transcriptomic analysis categorises patients into four immune clusters correlated with survival. The immune suppressed cluster is associated with worse survival, enriched with myeloid-derived cells, and an epithelial-mesenchymal transition signature. The immune hot cluster is associated with better survival, enriched with lymphocytes, myeloid-derived cells, and an immune signature including CCL5, CD8A, and NKG7. The immune clusters highlight patients who may respond to immunotherapy and thus may guide future clinical trials.


Conflict of interest statement

J.V.P. and N.W. are founders of genomiQa Pty Ltd, and members of its Board. All other authors have no competing interests.

Figures

Fig. 1
Fig. 1. Clinical overview of OAC cohort.
a OAC cohort treatment options. b Plot summarizing features of 115 patients including overall survival (months), patient status, DOCTOR trial details, day of surgery, day of recurrence, overall stage, allocated treatment, available data of WGS, RNA sequencing and methylation profiling with distinct colour codes shown in the key. Patients are ordered by overall survival (months). c Kaplan–Meier plot for overall survival (log-rank test) comparing patients with different clinical stage (Stage I n = 12, Stage II n = 62, Stage III n = 35 and Stage IV n = 6). PET, positron emission tomography; CF, Cisplatin and 5-Fluorouracil; DCF, CF and docetaxel; RT, radiotherapy; WGS, whole genome sequencing. Source data are provided as a Source data file.
Fig. 2
Fig. 2. The genomic landscape and mutational signatures in OAC.
a Bar plots displaying the genomic features of OAC samples within the cohort, with samples sorted by overall survival. The colour bar above the figure represents from top to bottom: stage, allocated treatment, PET response and tumour cellularity. The histograms from top to bottom are: overall patient survival with white bars are patients who are alive and black who are dead, the mutations per megabase, the number of neoantigens, the proportion of mutational signatures from SNV, the number and type of SVs, and the proportion of structural variant signatures. Clinical features per sample are annotated above the bar plots. b Pearson correlation (two-sided) of percent of mutational signature 17 burden (y-axis) with the total number of SNVs (x-axis) in each tumour (n = 89 biologically independent samples). Shading indicates 95% confidence intervals. ce Kaplan–Meier plots of overall patient survival (log-rank test) with the number of patients (biologically independent samples) in each group shown in the table below each plot. Samples are stratified by the prevalence of c the APOBEC mutational signature (present ≥15% in a sample n = 8 and absent <15% n = 81), d RS3-like structural variant signature with samples stratified into low (lower tertile, n = 30) and high (upper tertile, n = 29) groups and e RS5-like structural variant signature with samples stratified into low (lower tertile, n = 30) and high (upper tertile, n = 29) groups. PET, positron emission tomography; CF, Cisplatin and 5-Fluorouracil; DCF, CF and docetaxel; RT, 45 Gy radiotherapy. Source data are provided as a Source data file.
Fig. 3
Fig. 3. Copy number alterations in OAC genomes.
a The upper colour bars represent from top to bottom: overall stage, allocated treatment, PET response and tumour cellularity. The histogram is the overall patient survival, white indicates patients who are alive and black who are dead. The ploidy is shown for each sample. The percentage of copy number alterations across each genome and the percentage of sub-clonal CNA are shown. Samples are grouped into those that contained complex genome events (black, n = 54) and those that did not (white, n = 35), and sorted by overall survival in descending order. There are 89 biologically independent samples. b Kaplan–Meier plot (log-rank test) of patient overall survival for tumours without complex events (n = 35) stratified as ploidy high (upper tertile, n = 11) or low (lower tertile, n = 12). c Kaplan–Meier plot (log-rank test) of patient overall survival for tumours with complex events (n = 54) stratified as ploidy high (upper tertile, n = 18) or low (lower tertile, n = 18). PET, positron emission tomography; CF, Cisplatin and 5-Fluorouracil; DCF, CF and docetaxel; RT, 45 Gy radiotherapy; CNA, copy number alteration. Source data are provided as a Source data file.
Fig. 4
Fig. 4. Complex genomic events in OAC.
a Genomic location of non-APOBEC (pink) and APOBEC-mediated kataegic (olive green) loci per patient (n = 89 biologically independent samples) with chromosomes sorted by the number of kataegic loci. Samples are grouped into whether they did (black, n = 54) or did not contain complex genome events (white, n = 35), and sorted by overall survival in descending order. b Box plot of number of APOBEC mediated kataegic loci in tumours with (n = 54) and without (n = 35) complex events. c Box plot of number of non-APOBEC mediated kataegic loci in tumours with (n = 54) and without (n = 35) complex events. Box plots in b and c show the median values with the interquartile range (lower and upper hinge) and ±1.5-fold the interquartile range from the first and third quartile (lower and upper whiskers), p-values from Wilcoxon rank-sum two-sided test. dg Genome-wide data for patients with APOBEC-mediated kataegic loci (n = 77 biologically independent samples) showing d density plot of kataegic loci, e density plot of rearrangement breakpoints with values below the plot indicating the percent of 1 Mbp genome bins overlapping kataegis and SV breakpoints. Chromosomes highlighted grey harbour the most significant recurrent regions with co-localised kataegic loci and rearrangement breakpoints. f Circos plot of tumour OESO_001 highlighting rearrangement breakpoints and kataegic loci on chromosome 18 (arrow). Outer to inner panels: Chromosome banding, copy number alterations (green (below the line) represents loss and red (above the line) represents gain), BAF and somatic structural variants. g Recurrent focal amplifications (red) and deletions (blue) identified using GISTIC. OAC driver genes within focal events are shown (q <0.05). Amplified or deleted regions with a G-score >0.12 from GISTIC are plotted. h Data shown for chromosomes 7, 8 and 18 in n = 77 biologically independent samples with APOBEC-mediated kataegic loci, from top to bottom: Density plot of kataegic loci, density plot of rearrangement breakpoints, recurrent focal amplification (red) and deletion (blue) events, rainfall plots of median methylation beta values (for n = 69 samples with methylation). Source data are provided as a Source data file.
Fig. 5
Fig. 5. Immune microenvironment predicts patient outcome and future precision immunotherapy candidates.
a K-mean unsupervised clustering of patients (n = 68 biologically independent samples) using GSVA scores from ConsensusTME transcriptomic deconvolution of 18 immune cell types. The upper colour bars represent from top to bottom: immune cell cluster, overall stage, allocated treatment, PET response and tumour cellularity. The histogram is the overall patient survival, white indicates patients who are alive and black who are dead. b Estimated cell type proportion for the 68 patients using transcriptomics data and CIBERSORTx. c Estimated cell type proportion for patients (n = 24) with methylation profiling using MethylCIBERSORT. d Kaplan–Meier plot of overall survival (OS; left plot) and progression-free survival (PFS; right plot) using log-rank test to compare the four immune subtypes. The number of patients in each group is indicated below the plots. e Volcano plot of differential gene expression analysis comparing Cluster 1 with other immune clusters. Genes with absolute log scale fold change >1.5 and q <0.05 are shown in red. f Volcano plot of differential gene expression analysis comparing Cluster 2 with other clusters. Genes with absolute log scale fold change >1.5 and q <0.05 are shown in yellow. g, h GSEA normalised enrichment scores (x-axis) and enriched pathways (y-axis) using the genes differentially expressed in Cluster 1 (g) compared to other clusters and Cluster 2 (h) compared to other clusters. Represented pathways had an adjusted p-value <0.05 with GSEA, the pink background represents up-regulated pathways, the blue background down-regulated pathways. i Pearson correlation (two-sided) of the percentage of CD8 positive cells detected using immunohistochemistry (IHC; y-axis) and CD8A gene expression from RNA-seq (TMM; x-axis) for n = 32 biologically independent samples. Shading indicates 95% confidence intervals. j CD8 IHC was performed for n = 32 samples biologically independent samples, immunohistochemical staining for two representative samples from each of the four immune subtypes is shown (representative samples are highlighted in panel i). Images scanned at ×40 magnification, scale bar represents 50 μm. PET, positron emission tomography; CF, Cisplatin and 5-Flurouracil; DCF, CF and docetaxel; RT, 45 Gy radiotherapy; GSEA, gene set enrichment analysis. Source data are provided as a Source data file.
Fig. 6
Fig. 6. Proposed Clusters present in oesophageal adenocarcinoma based on the tumour microenvironment.
Transcriptome analysis of oesophageal adenocarcinomas identified four clusters of tumours based on the prediction of immune cells present within the tumour microenvironment. These clusters were associated with patient survival and tumour genomic features.

References

    1. Collaborators, G.B.D.O.C. The global, regional, and national burden of oesophageal cancer and its attributable risk factors in 195 countries and territories, 1990–2017: a systematic analysis for the Global Burden of Disease Study 2017. Lancet Gastroenterol. Hepatol. 2020;5:582–597. doi: 10.1016/S2468-1253(20)30007-8. - DOI - PMC - PubMed
    1. Allum WH, Stenning SP, Bancewicz J, Clark PI, Langley RE. Long-term results of a randomized trial of surgery with or without preoperative chemotherapy in esophageal cancer. J. Clin. Oncol. 2009;27:5062–5067. doi: 10.1200/JCO.2009.22.2083. - DOI - PubMed
    1. van Hagen P, et al. Preoperative chemoradiotherapy for esophageal or junctional cancer. N. Engl. J. Med. 2012;366:2074–2084. doi: 10.1056/NEJMoa1112088. - DOI - PubMed
    1. Kato, K. et al. Pembrolizumab plus chemotherapy versus chemotherapy as first-line therapy in patients with advanced esophageal cancer: the phase 3 KEYNOTE-590 study. Ann. Oncol.31, S1192–S1193 (2020).
    1. Shah MA, et al. Efficacy and safety of pembrolizumab for heavily pretreated patients with advanced, metastatic adenocarcinoma or squamous cell carcinoma of the esophagus: the phase 2 KEYNOTE-180 study. JAMA Oncol. 2019;5:546–550. doi: 10.1001/jamaoncol.2018.5441. - DOI - PMC - PubMed

Publication types

Supplementary concepts