. 2023 May 31;14(1):3153.
doi: 10.1038/s41467-023-38113-4.

Leukemia relapse via genetic immune escape after allogeneic hematopoietic cell transplantation

Affiliations

Leukemia relapse via genetic immune escape after allogeneic hematopoietic cell transplantation

Simona Pagliuca et al. Nat Commun. .

Abstract

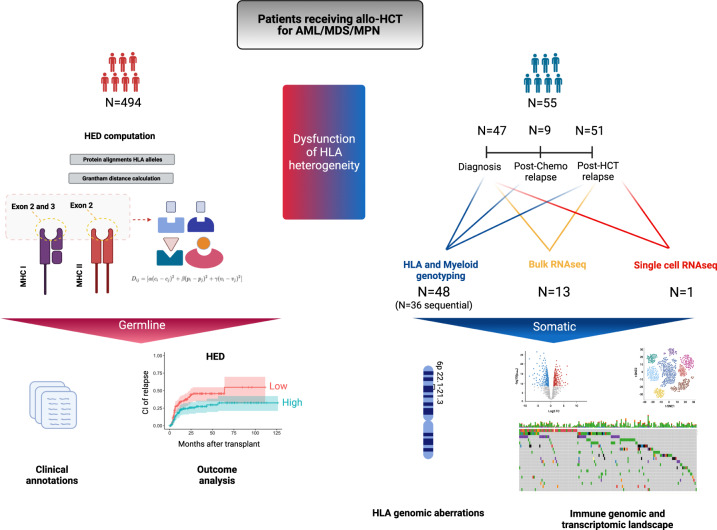
Graft-versus-leukemia (GvL) reactions are responsible for the effectiveness of allogeneic hematopoietic cell transplantation as a treatment modality for myeloid neoplasia, whereby donor T- effector cells recognize leukemia neoantigens. However, a substantial fraction of patients experiences relapses because of the failure of the immunological responses to control leukemic outgrowth. Here, through a broad immunogenetic study, we demonstrate that germline and somatic reduction of human leucocyte antigen (HLA) heterogeneity enhances the risk of leukemic recurrence. We show that preexistent germline-encoded low evolutionary divergence of class II HLA genotypes constitutes an independent factor associated with disease relapse and that acquisition of clonal somatic defects in HLA alleles may lead to escape from GvL control. Both class I and II HLA genes are targeted by somatic mutations as clonal selection factors potentially impairing cellular immune responses and response to immunomodulatory strategies. These findings define key molecular modes of post-transplant leukemia escape contributing to relapse.


Conflict of interest statement

The authors declare no competing interests.

Figures

Fig. 1
Fig. 1. Study design.
In total 494 patients receiving a first allogeneic hematopoietic cell transplantation (HCT) for a myeloid disorder were included in this study. For the estimation of the dysfunction of the germline HLA diversity, we calculated the HLA evolutionary divergence, a metric able to quantitate the structural diversity at the peptide binding site of each homologous HLA molecule (LEFT panel). This metric was correlated in univariable and multivariate analysis with the cumulative incidence of relapse and other clinical outcomes. To characterize the somatic dysfunction of HLA diversity (RIGHT panel) we performed a longitudinal immunogenomic and transcriptomic analysis in a subgroup of patients relapsing after HCT (N = 55). Classical HLA loci and myeloid genes were genotyped, and their mutational status was analyzed. In addition, bulk and single cell RNA sequencing were also performed. Of note is that 7 samples used for the bulk RNA sequencing were previously published (Christopher et al. NEJM 2018).
Fig. 2
Fig. 2. Impact of HED on cumulative incidence of relapse.
a Density distribution of class I and class II HED scores in post-HCT relapsed (red) and non-relapsed patients (blue). b Impact of per-class and per-locus HED scores on cumulative incidence (CI) of relapse. Low (red) and high (blue) HED are defined according to the 50th percentile of the corresponding locus in healthy controls. Shaded bands represent 95% confident interval. Non-adjusted p-values indicate the significance of the log-rank test. c Cause specific multivariable cox regression analysis of relapse including class I HED as main effect variable. d Cause specific multivariable cox regression analysis of relapse including class I HED as main effect variable. In (c) and (d) disease risk was intended as: 1 = low; 2 = intermediate; 3 = high. Black squares indicate the odd ratio and error bars the 95% confident intervals. All the p-values were two sided. Source data 1. Abbreviations: HCT-CI hematopoietic cell transplant comorbidity index, AML acute myeloid leukemia, MDS myelodysplastic syndromes, MPN myeloproliferative neoplasms, MRD matched related donor, MUD matched unrelated donor, MAC myeloablative conditioning regimen, RIC reduced intensity conditioning regimen, HR Hazard ratio 95% CI: 95% confident interval.
Fig. 3
Fig. 3. HLA and myeloid landscape of AML and MDS relapsing after allo-HCT.
a Barplot indicating the frequency of HLA mutations in each studied group. Numbers of patients harboring HLA aberrations are reported on the top of each bar. Pie charts capture the frequency of mutations and losses in each group. b Lollipop chart showing the frequency of each HLA aberration. The height of the line denotes the frequency, while the color of each dot indicates the type of aberration. c Frequency of HLA alterations according to donor group (Haplo: haploidentical donor); MRD (matched related donor); MUD (matched unrelated donor). Pie charts represent the distribution of mutations or losses in each group. d Time dependent curve indicating the incidence of relapse of the sequenced group (median time to relapse was 5.8 months). e Swimming plot capturing main clinico-biological information for each patient of the sequenced cohort. The yellow barplot indicates the frequency of HLA alterations in late (after 6 months) vs early (before 6 months) post-HCT relapses. f Barplots showing the frequency and distribution of HLA mutations, losses and mutations in main myeloid driver genes in AML/MDS at diagnosis (yellow) and at post-HCT relapses (green). g Frequency of mutations in myeloid driver genes in HLA-altered vs HLA wild type post-HCT specimens. Source Data 1 and 2.
Fig. 4
Fig. 4. Immune transcriptional dysregulation in post-HCT relapses vs newly diagnosed AML/MDS.
a Results of differential gene expression analysis of bulk RNA samples. Upper panel: Venn diagram showing downregulated (yellow) and upregulated (fucsia) genes. Bottom panel: Volcano plot showing the results of the differential analysis between post-HCT relapses vs newly diagnosed AML/MDS. X-axis depicts the logarithmic fold change [log2(FC)] for each gene, while Y-axis indicates the negative logarithm of the adjusted p-values. The labels highlight HLA genes. b Line charts: Paired comparisons of level expression of each HLA gene in pre and post-HCT samples (each paired dot indicates one patient). Patients characterized by a downregulated HLA expression in post-transplant samples are shown in red. Those who did not down-regulate HLA in post-HCT relapses are highlighted in blue. From the bottom to the top, the first series of pie charts highlights the per-locus distribution of downregulated HLA (red) in post-HCT samples. The second series of pie charts shows how many downregulated samples are also affected by HLA mutations/losses (light blue). c Barplots indicating the log (FC) of immune genes derived from the differential analysis between post-HCT relapsed vs newly diagnosed AML/MDS (Source Data 3). All the p-values were two sided.

Update of

References

    1. Passweg JR, et al. Hematopoietic cell transplantation and cellular therapy survey of the EBMT: monitoring of activities and trends over 30 years. Bone Marrow Transpl. 2021;56:1651–1664. doi: 10.1038/s41409-021-01227-8. - DOI - PMC - PubMed
    1. Döhner H, et al. Diagnosis and management of AML in adults: 2017 ELN recommendations from an international expert panel. Blood. 2017;129:424–447. doi: 10.1182/blood-2016-08-733196. - DOI - PMC - PubMed
    1. O’Neill AT, Chakraverty R. Graft versus leukemia: current status and future. Perspect. JCO. 2021;39:361–372. - PubMed
    1. Vago L, Gojo I. Immune escape and immunotherapy of acute myeloid leukemia. J. Clin. Invest. 2020;130:1552–1564. doi: 10.1172/JCI129204. - DOI - PMC - PubMed
    1. Hong S, et al. Pattern of somatic mutation changes after allogeneic hematopoietic cell transplantation for acute myeloid leukemia and myelodysplastic syndromes. Bone Marrow Transpl. 2022;57:1615–1619. doi: 10.1038/s41409-022-01762-y. - DOI - PMC - PubMed

Publication types