. 2023 May 31;9(1):48.
doi: 10.1038/s41523-023-00556-9.

Pak1 pathway hyper-activation mediates resistance to endocrine therapy and CDK4/6 inhibitors in ER+ breast cancer

Affiliations

Pak1 pathway hyper-activation mediates resistance to endocrine therapy and CDK4/6 inhibitors in ER+ breast cancer

Stefania Belli et al. NPJ Breast Cancer. .

Abstract

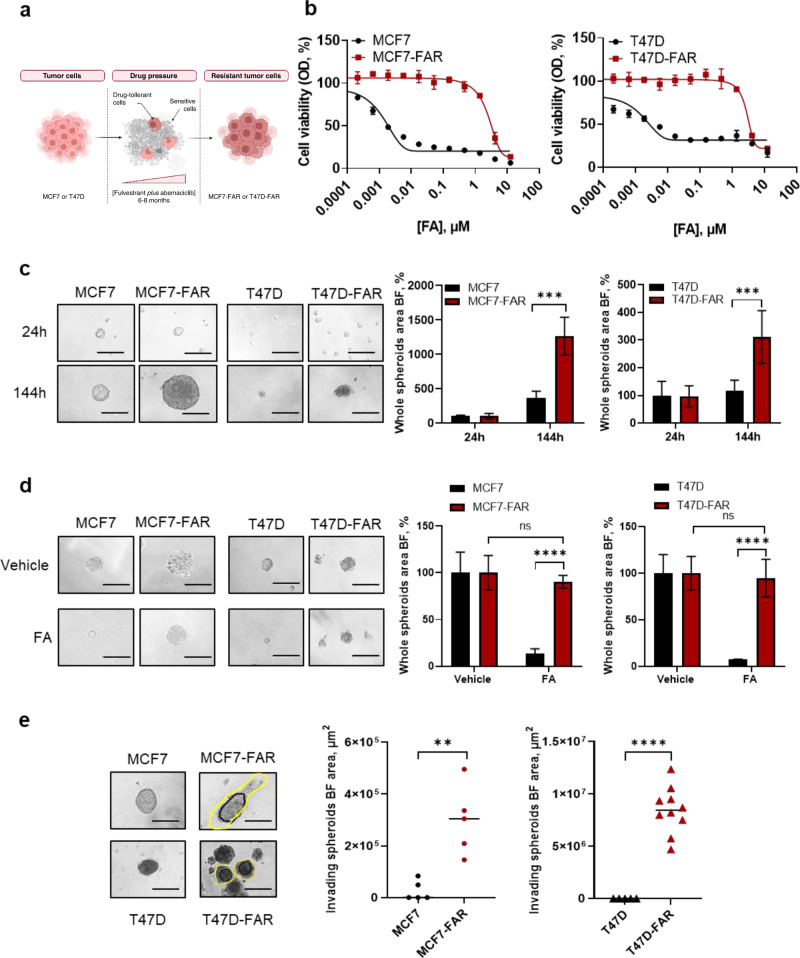
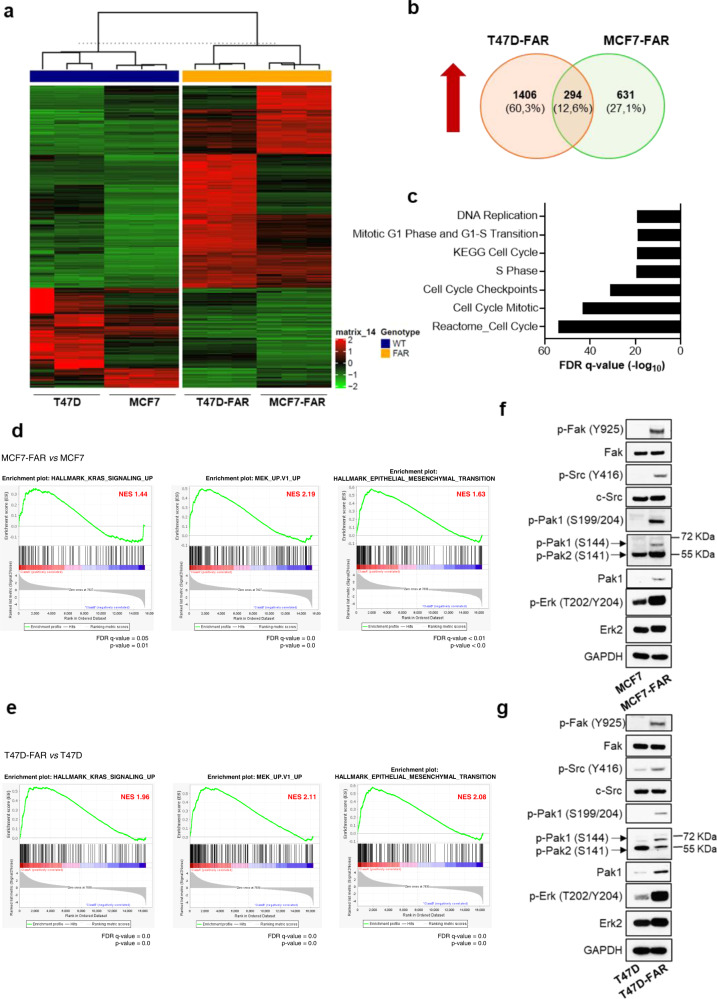
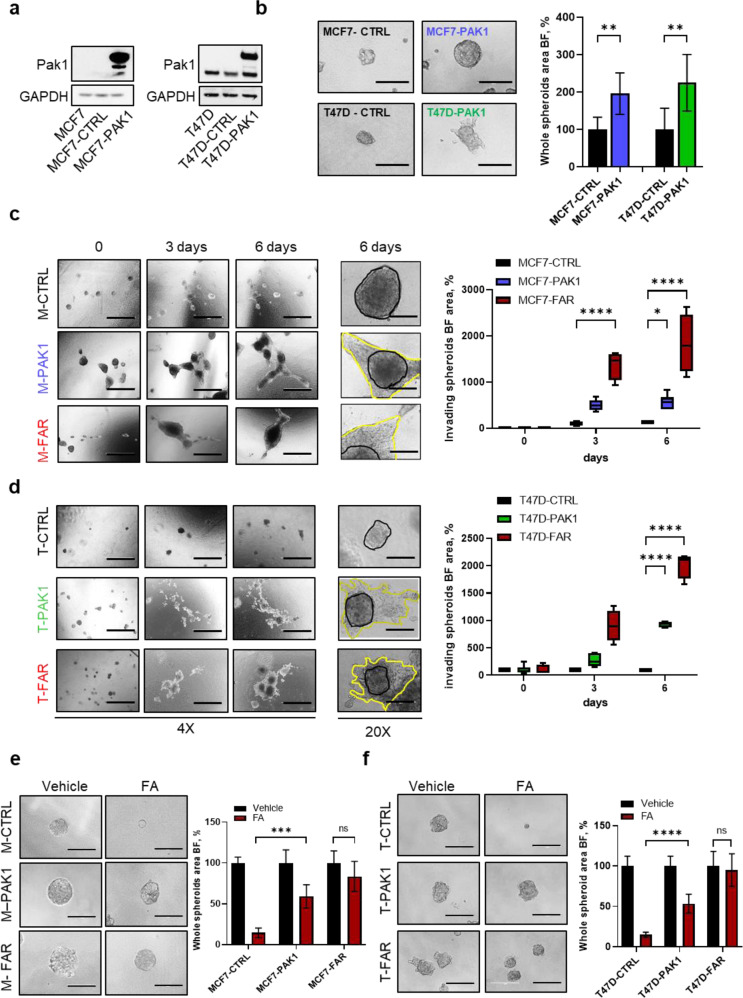
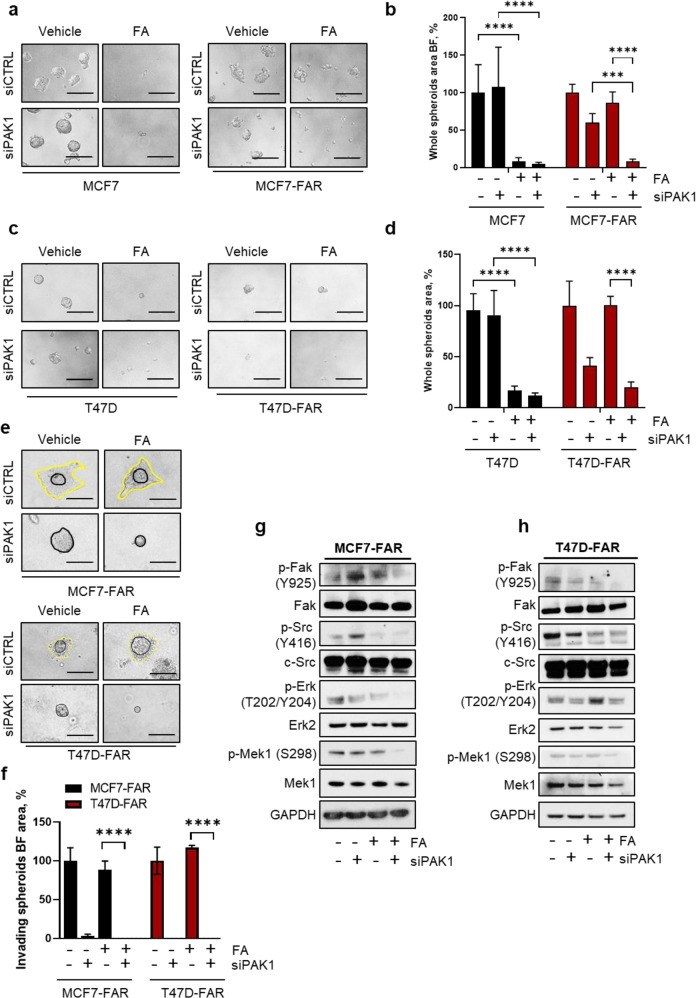
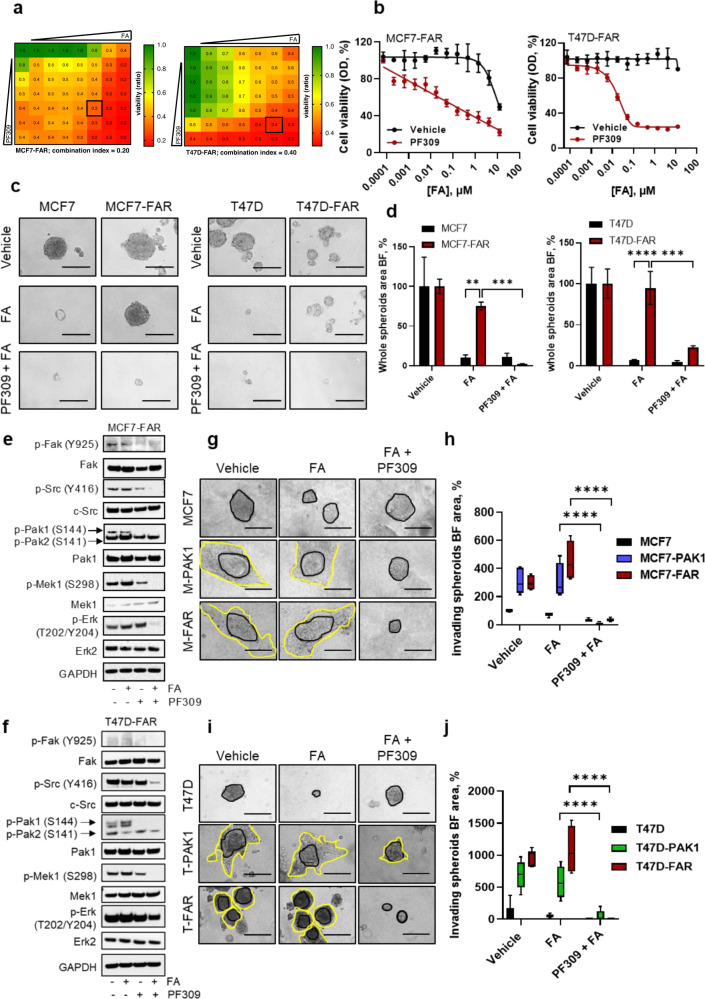
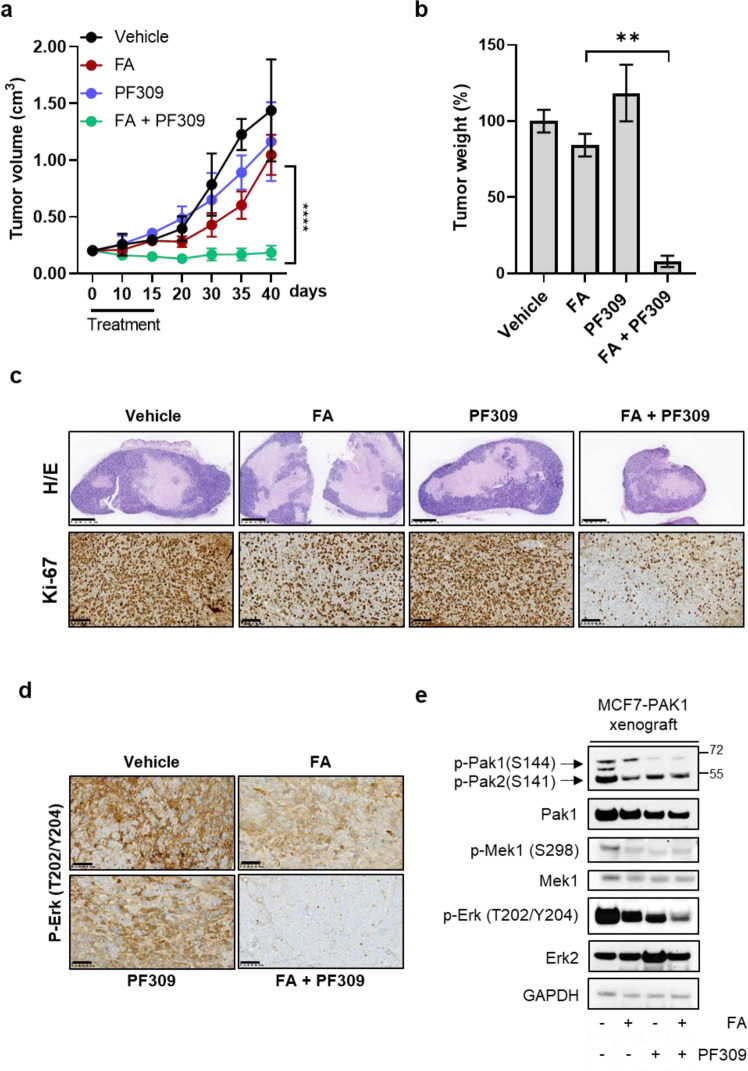
Cyclin-dependent kinase 4 and 6 inhibitors (CDK4/6i) have been approved in combination with endocrine therapy (ET) to treat estrogen receptor-positive (ER+) metastatic breast cancer (BC). However, drug resistance represents the leading cause of breast cancer patients mortality. This study aimed to identify novel resistance mechanisms to ER antagonists in combination with CDK4/6 inhibitors. We generated two ER+ BC cell lines, T47D and MCF7, resistant to the combination of the ER antagonist fulvestrant and CDK4/6i abemaciclib, named T47D-FAR and MCF7-FAR. Transcriptomic analysis revealed common up-regulation of genes involved in MAPK and epithelial to mesenchymal transition (EMT) pathways in FAR cells, sustaining their hyper-invasive phenotype and increased anchorage-independent growth, compared to sensitive cells. FAR cells showed higher p21-activated kinase 1 (Pak1) expression and phosphorylation levels than parental cells. PAK1 knockdown by siRNAs hampered cell proliferation, reduced anchorage-independent growth and invasive properties of T47D-FAR and MCF7-FAR, re-sensitizing them to fulvestrant and abemaciclib. Conversely, over-expression of PAK1 in MCF7 and T47D cells increased tumor spheroids' growth and invasion and reduced sensitivity to fulvestrant and abemaciclib, confirming its role in inducing drug resistance. Finally, treatment with Pak1 inhibitors, PF-3758309 (PF309) and NVS-PAK1-1, restored cell sensitivity to fulvestrant and abemaciclib of MCF7-FAR and T47D-FAR cells, both in vitro and in vivo. In conclusion, our data suggested a pivotal role for Pak1 in resistance to ET and CDK4/6i in ER+ breast cancers. These data might promote the rationale for the development of novel Pak1 inhibitors for treatment of patients with ER+ BC progressing on ET plus CDK4/6i.


Conflict of interest statement

L.F. declares the following competing interests: consultant and advisory board for Seagen, Amgen, BMS, MSD, Jansen and Pierre Fabre Pharma. R.B. declares the following competing interests: consultant and advisory board for BMS, MSD, Pfizer, AstraZeneca, Lilly and Novartis.

Figures

Fig. 1
Fig. 1. Generation and characterization of fulvestrant and abemaciclib resistant ER+ breast cancer cell lines.
Schematic representation of fulvestrant-abemaciclib resistant cells (FAR) generation (a). Dose-response curves of MCF7, MCF7-FAR (left) or T47D, T47D-FAR (right) exposed to increasing doses of fulvestrant and abemaciclib (FA; up to 10 µM fulvestrant +2.5 µM abemaciclib) combination every 72 h for 1 week and stained with crystal violet. Each data point represents the percent of viable cells relative to vehicle-treated controls (b). Representative images of spheroids from 5 × 104 MCF7 and MCF7-FAR or 10 × 104 T47D and T47D-FAR cultured up to 144 h in ultra-low attachment plates (left). All images were capture at 20x magnification (Bars = 200 µm). Spheroids area is reported in the right panels for MCF7/MCF7-FAR and T47D/T47D-FAR. Values are expressed as percentage relative to the area calculated 24 h after spheroid formation (c). Representative images of spheroids from 5 × 104 MCF7 and 2.5 × 104 MCF7-FAR, 10 × 104 T47D and 5 × 104 T47D-FAR spheroids exposed to 400 nM fulvestrant and 100 nM abemaciclib (FA) every 72 h for 7days (left). Magnification 20x (scale bar = 200 μm). On the right, bar graphs showing percentage of whole spheroids area upon FA treatment compared to spheroids treated with vehicle (plotted as 100%) (d). Representative images of MCF7 and MCF7-FAR spheroids or T47D and T47D-FAR spheroids (left) embedded in collagen type I matrix for 7 days. All images were capture at 20x magnification (Bars = 200 µm) (e). Quantification of invading area (yellow lines), calculated by subtracting the core area (black lines) to the total spheroidal one, is reported in right panel for both MCF7/MCF7-FAR and T47D/T47D-FAR. For all panels data are expressed as mean±standard deviation (SD) of three separate experiments, indicated by error bars, performed in triplicate or quadruplicate (**p < 0.01; ***p < 0.001; ****p < 0.0001; Student’s T-test).
Fig. 2
Fig. 2. Evaluation of the common transcriptional reprogramming underpinning drug resistance to fulvestrant and abemaciclib in ER+ breast cancer cell lines.
Heatmap of hierarchical clustering indicating differentially expressed genes (rows) between parental and FAR cells (a). Venn-diagram of common up-regulated genes between MCF7-FAR and T47D-FAR is shown in (b). Bar graphs showing gene set names obtained by Gene Set Enrichment Analysis (GSEA) of common 294 up-regulated genes between MCF7-FAR and T47D-FAR cells. Data are plotted for False Discovery Rate (FDR) q-value (c). RNA-seq based GSEA of pathways significantly up-regulated in FAR resistant vs parental MCF7 and T47D cells are shown with Normalized Enriched Score (NES) and FDR q-value and p-value (d, e). Western blot analysis of sensitive MCF7 and T47D or resistant FAR collected after 18 h of treatment with fulvestrant (1 µM) and abemaciclib (0.25 µM) (f, g, respectively). Whole cell lysates were prepared and subjected to immunoblot analysis with the indicated antibodies. Images are representatives from three independent experiments.
Fig. 3
Fig. 3. Effects of PAK1 over-expression on cell proliferation and invasion in MCF7 and T47D cells.
Representative western blot analysis for Pak1 of parental MCF7 (left) and T47D (right), GFP vector control (pLenti-C-mGFP-P2A-Puro) over-expressing cells (MCF7-CTRL and T47D-CTRL) or PAK1-over-expressing cells (MCF7-PAK1 and T47D-PAK1). GAPDH was used as a loading control (a). Representative images of MCF7-CTRL or -PAK1 and T47D-CTRL or -PAK1 (left) spheroids cultured for 72 h. All images were capture at 20x magnification (Bars = 200 µm). Bar graph shows the whole spheroids area plotted as percentage relative to spheroids CTRL area (right) (b). Representative images of spheroids from MCF7-CTRL or -PAK1 or -FAR cells (c) and T47D-CTRL or -PAK1 or -FAR cells (d) embedded into a collagen type I matrix at different time points. All images were capture at 4x magnification (Bars = 1000 µm), or 20x magnification (scale bar = 200 μm). Box plots showing spheroid invading area are reported for MCF7 (c, right) and T47D (d, right) models. Data are plotted with median and SD. Representative images of MCF7-CTRL, -PAK1 or –FAR (e, left) and T47D-CTRL, -PAK1 or –FAR (f, left) spheroids treated for 72 h with vehicle or with the combination of 400 nM of fulvestrant and 100 nM of abemaciclib (FA). Magnification 20x (scale bar = 200 μm). Bar graphs showing percentage of whole spheroids area upon FA treatment compared to spheroids treated with vehicle (plotted as 100%) are reported for MCF7 (e, right) and T47D (f, right) models. For panels b, e, f right, data are expressed as mean ± SD performed in quadruplicate. For al panels (*p < 0.05; **p < 0.01, ***p < 0.001; ****p < 0.0001; 2way ANOVA Bonferroni’s multiple comparisons).
Fig. 4
Fig. 4. PAK1 knock-down as key event in increasing resistant cell sensitivity to fulvestrant and abemaciclib.
Representative images of MCF7 (a, left) and MCF7-FAR (a, right) or T47D (c, left) and T47D-FAR (c, right) spheroids transfected with siRNA scrambled (siCTRL) or siRNA targeting PAK1 (siPAK1) for 72 h and treated with vehicle or the combination of 400 nM of fulvestrant and 100 nM of abemaciclib (FA) for other 72 h. Magnification 20x (scale bar = 200 μm). Bar graphs showing percentage of whole spheroids area upon FA treatment ± siPAK1 compared to spheroids treated with vehicle (plotted as 100%) are reported for MCF7 and MCF7-FAR (b) and T47D and T47D-FAR (d) cells (ad). Representative images of spheroids from MCF7-FAR (e, top) and T47D-FAR (e, bottom) knocked-down for PAK1 and treated with vehicle or the combination of 400 nM fulvestrant and 100 nM abemaciclib (FA) embedded in collagen type I matrix for 6 days. Magnification 20x (scale bars = 200 μm). Bar graph showing quantification of invading spheroids area upon silencing of PAK1 and in presence or not of FA (f). Data are plotted as percentage relative to cells transfected with scrambled siRNAs and treated with vehicle (f). Representative western blot analysis for the indicated antibodies of MCF7-FAR (g) or T47D-FAR (h) total lysates of cells silenced for PAK1 for 72 h and treated for further 72 h with 1 μM of fulvestrant and 0.25 μM of abemaciclib (FA). GAPDH was used as loading control. Images are representatives of three independent experiments. For all panels, data are plotted as means±SD of three independent experiment performed in quadruplicate (***p < 0.001; ****p < 0.0001; 2way ANOVA Bonferroni’s multiple comparisons).
Fig. 5
Fig. 5. Impairment of FAR cell growth and invasion upon Pak1 pharmacological inhibition.
Viability assay to test synergy between FA and PF309. Cells were treated with increasing concentrations of fulvestrant and abemaciclib (FA) and PF309 (up to 10 + 2.5 μM and 0.1 μM, respectively) alone or in combination every 72 h until vehicle-treated controls reached ∼90% of confluence. Intensity values of cell monolayers stained with crystal violet were used to perform the Chou-Talalay test. Numbers inside each box indicate the ratio of viable treated cells to untreated cells from three independent experiments for MCF7-FAR (a, left) and for T47D-FAR (a, right). Dose-response curves of MCF7-FAR (b, left) or T47D-FAR (b, right) exposed to increasing doses of fulvestrant and abemaciclib (FA), in presence or not of 10 nM of PF309 for 1 week. Representative images of MCF7 and MCF7-FAR (c, left) or T47D and T47D-FAR (c, right) spheroids exposed to 400 nM fulvestrant and 100 nM abemaciclib (FA) ± 10 nM PF-309. Bar graphs showing percentage of whole spheroids area upon FA ± PF-309 treatment compared to spheroids treated with vehicle (plotted as 100%) are reported for MCF7/MCF7-FAR (d, left) and T47D/T47D-FAR (d, right) cells. Western Blot analysis of MCF7-FAR (e) and T47D-FAR (f) treated with fulvestrant and abemaciclib (FA, 1 μM and 0.25 μM, respectively), PF-309 (500 nM) or the combination for 48 h. GAPDH was used as loading control. Images are representatives from three independent experiments. Morphology of MCF7, MCF7-PAK1 and MCF7-FAR (g) or T47D, T47D-PAK1 and T47D-FAR (i) spheroids cultured into a collagen matrix in presence of vehicle or 400 nM fulvestrant and 100 nM abemaciclib (FA) ± 10 nM PF-309. All images were capture at 20x magnification (Bars = 200 µm). Box plot showing spheroids invading area is reported for MCF7 and T47D models (h, j respectively). Data are plotted relative to vehicle-treated MCF7 (h) and T47D (j) area. Middle line in box represents the median±SD performed in quadruplicate (****p < 0.0001, 2way ANOVA Bonferroni’s multiple comparisons). For panel d, data are plotted as means ± SD of three independent experiment performed in triplicate or quadruplicate (**p < 0.01; ***p < 0.001; ****p < 0.0001; 2way ANOVA Bonferroni’s multiple comparisons).
Fig. 6
Fig. 6. Tumor xenograft growth impairment and drug resistance reversion upon Pak1 pharmacological inhibition.
MCF7-PAK1 xenografts were established in Balb/c nude mice. Once tumors reached ≥200 mm3, mice were randomized to treatment with vehicle, fulvestrant and abemaciclib (FA; 5 mg/week, 25 mg/kg p.o., respectively), PF309 (15 mg/kg p.o.) alone or in combination. Tumor growth curve is showed in a. Each data point represents the mean of tumor volume in cm3 ±SD (n = 5 per arm, ****p < 0.0001 vs. FA drug arms; Student’s t-test). At the end of the treatment tumours were collected, weights were measured and reported in bar graph as percentage relative to vehicle-treated control (b). Representative images of MCF7-PAK1 xenografts’ sections stained with Hematoxylin and eosin (H/e) or processed for Ki67 staining are showed in c (top panels and bottom panels, respectively). Images were capture at 2.5x (top panels) or 20x magnification (bottom panels); bars=1000 µm or 100 µm, respectively. Representative images of MCF7-PAK1 xenografts’ sections subjected to IHC for p-ERK (T202/Y204) (d). All images were capture at 20x magnification (Bars=100 µm). Western blot analysis of proteins extracted from MCF7-PAK1 tumor xenografts after 4 h of treatment and blotted for the indicated antibodies (e). Images are representatives from three independent experiments.

References

    1. Spring LM, et al. Cyclin-dependent kinase 4 and 6 inhibitors for hormone receptor-positive breast cancer: past, present, and future. Lancet. 2020;395:817–827. doi: 10.1016/S0140-6736(20)30165-3. - DOI - PubMed
    1. Kumar R, Gururaj AE, Barnes CJ. p21-activated kinases in cancer. Nat. Rev. Cancer. 2006;6:459–471. doi: 10.1038/nrc1892. - DOI - PubMed
    1. Ong CC, et al. Targeting p21-activated kinase 1 (PAK1) to induce apoptosis of tumor cells. Proc. Natl. Acad. Sci. 2011;108:7177–7182. doi: 10.1073/pnas.1103350108. - DOI - PMC - PubMed
    1. Radu, et al. PAK signalling during the development and progression of cancer. Nat. Rev. Cancer. 2014;14:13–25. doi: 10.1038/nrc3645. - DOI - PMC - PubMed
    1. Manser E, Leung T, Salihuddin H, Zhao Z, Lim L. A brain serine/threonine protein kinase activated by Cdc42 and Rac1. Nature. 1994;367:40–46. doi: 10.1038/367040a0. - DOI - PubMed